Roi Summary
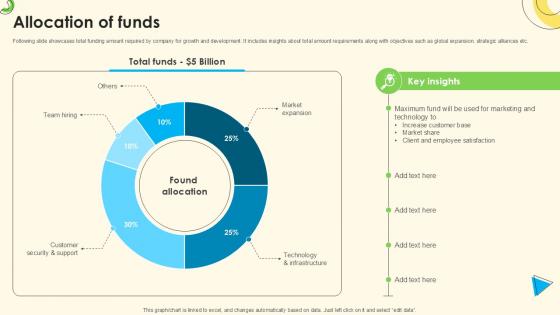
Allocation Of Funds Sales Pitch Deck For Online Retail Ppt Template
Following slide showcases total funding amount required by company for growth and development. It includes insights about total amount requirements along with objectives such as global expansion, strategic alliances etc. Do you have an important presentation coming up Are you looking for something that will make your presentation stand out from the rest Look no further than Allocation Of Funds Sales Pitch Deck For Online Retail Ppt Template With our professional designs, you can trust that your presentation will pop and make delivering it a smooth process. And with Slidegeeks, you can trust that your presentation will be unique and memorable. So why wait Grab Allocation Of Funds Sales Pitch Deck For Online Retail Ppt Template today and make your presentation stand out from the rest Following slide showcases total funding amount required by company for growth and development. It includes insights about total amount requirements along with objectives such as global expansion, strategic alliances etc.

Key Financial Ratios Template 1 Ppt PowerPoint Presentation Gallery Ideas
This is a key financial ratios template 1 ppt powerpoint presentation gallery ideas. This is a eight stage process. The stages in this process are return on assets, return on equity, return on investment, debt to equity ratio, current ratio.
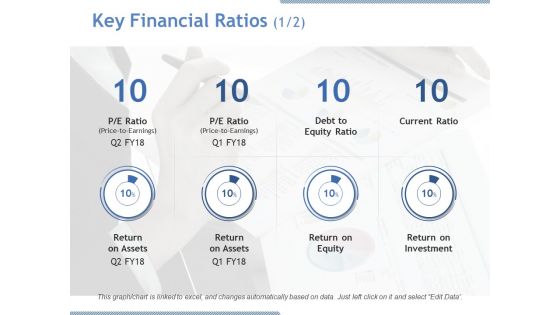
Key Financial Ratios Template 1 Ppt PowerPoint Presentation Ideas Designs
This is a key financial ratios template 1 ppt powerpoint presentation ideas designs. This is a eight stage process. The stages in this process are return on assets, return on equity, return on investment, current ratio.
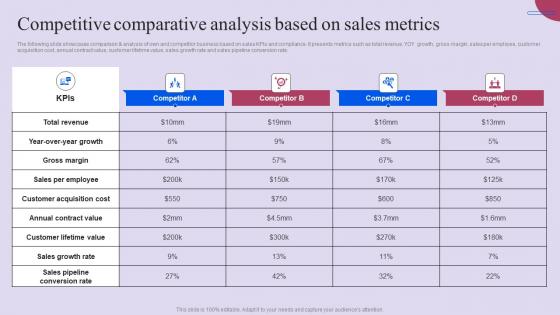
Competitive Comparative Analysis Based On Sales Metrics Ppt File Designs Pdf
The following slide showcases comparison and analysis of own and competitor business based on sales KPIs and compliance. It presents metrics such as total revenue, YOY growth, gross margin, sales per employee, customer acquisition cost, annual contract value, customer lifetime value, sales growth rate and sales pipeline conversion rate. There are so many reasons you need a Competitive Comparative Analysis Based On Sales Metrics Ppt File Designs Pdf. The first reason is you can not spend time making everything from scratch, Thus, Slidegeeks has made presentation templates for you too. You can easily download these templates from our website easily. The following slide showcases comparison and analysis of own and competitor business based on sales KPIs and compliance. It presents metrics such as total revenue, YOY growth, gross margin, sales per employee, customer acquisition cost, annual contract value, customer lifetime value, sales growth rate and sales pipeline conversion rate.
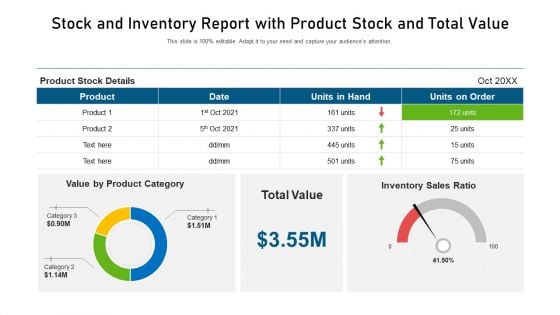
Stock And Inventory Report With Product Stock And Total Value Ppt PowerPoint Presentation File Slides PDF
Pitch your topic with ease and precision using this stock and inventory report with product stock and total value ppt powerpoint presentation file slides pdf. This layout presents information on product category, value, inventory sales, product stock details. It is also available for immediate download and adjustment. So, changes can be made in the color, design, graphics or any other component to create a unique layout.
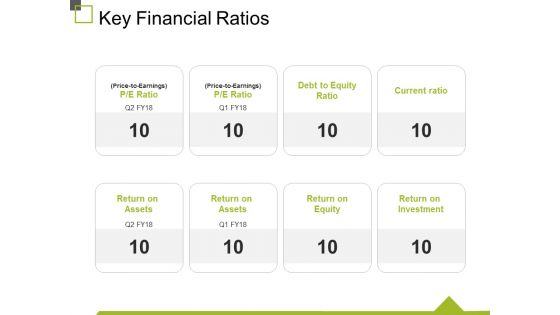
Key Financial Ratios Ppt PowerPoint Presentation Professional Brochure
This is a key financial ratios ppt powerpoint presentation professional brochure. This is a eight stage process. The stages in this process are return on assets, return on assets, return on equity, return on investment, current ratio.
Advantages Of Term Insurance With Icons Ppt PowerPoint Presentation Outline Graphic Images PDF
Presenting this set of slides with name advantages of term insurance with icons ppt powerpoint presentation outline graphic images pdf. This is a five stage process. The stages in this process are loan against life insurance, return on investment, life stage specific planning, tax benefits, death benefits. This is a completely editable PowerPoint presentation and is available for immediate download. Download now and impress your audience.
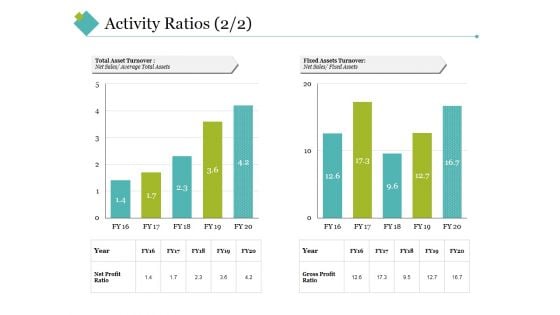
Activity Ratios Template 4 Ppt PowerPoint Presentation Styles Slideshow
This is a activity ratios template 4 ppt powerpoint presentation styles slideshow. This is a two stage process. The stages in this process are total asset turnover, fixed assets turnover, net sales, year, net profit ratio, gross profit ratio.
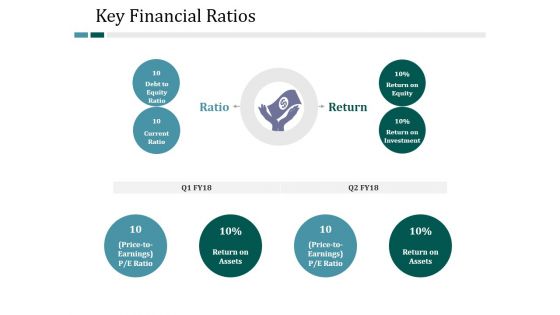
Key Financial Ratios Ppt PowerPoint Presentation File Introduction
This is a key financial ratios ppt powerpoint presentation file introduction. This is a four stage process. The stages in this process are ratio, return, return on equity, return on investment, return on assets, current ratio, debt to equity ratio.
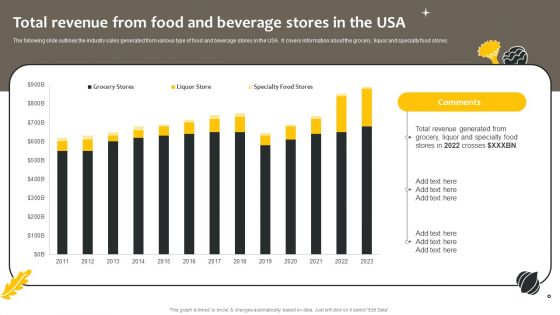
Effective Online And Offline Promotional Total Revenue From Food And Beverage Stores Introduction PDF
The following slide outlines the industry sales generated from various type of food and beverage stores in the USA. It covers information about the grocery, liquor and specialty food stores. The best PPT templates are a great way to save time, energy, and resources. Slidegeeks have 100 percent editable powerpoint slides making them incredibly versatile. With these quality presentation templates, you can create a captivating and memorable presentation by combining visually appealing slides and effectively communicating your message. Download Effective Online And Offline Promotional Total Revenue From Food And Beverage Stores Introduction PDF from Slidegeeks and deliver a wonderful presentation.
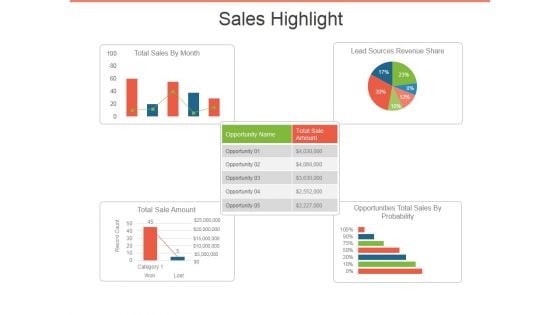
Sales Highlight Ppt PowerPoint Presentation Ideas Design Templates
This is a sales highlight ppt powerpoint presentation ideas design templates. This is a five stage process. The stages in this process are total sales by month, lead sources revenue share, opportunities total sales by probability, total sale amount.
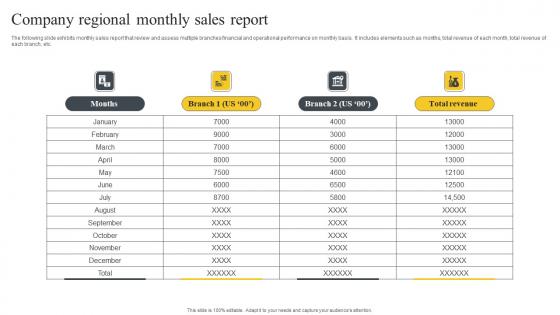
Company Regional Monthly Sales Report Background Pdf
The following slide exhibits monthly sales report that review and assess multiple branches financial and operational performance on monthly basis. It includes elements such as months, total revenue of each month, total revenue of each branch, etc. Showcasing this set of slides titled Company Regional Monthly Sales Report Background Pdf. The topics addressed in these templates are Months, Branch, Total Revenue. All the content presented in this PPT design is completely editable. Download it and make adjustments in color, background, font etc. as per your unique business setting. The following slide exhibits monthly sales report that review and assess multiple branches financial and operational performance on monthly basis. It includes elements such as months, total revenue of each month, total revenue of each branch, etc.
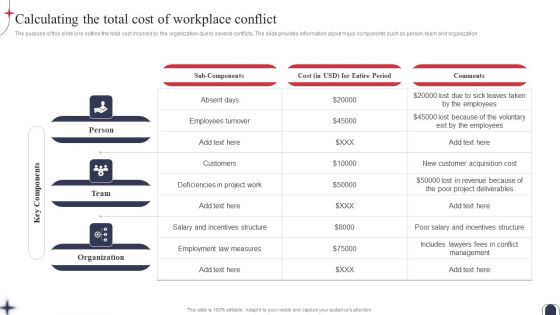
Workplace Conflict Resolution Calculating The Total Cost Of Workplace Conflict Graphics PDF
The purpose of this slide is to outline the total cost incurred by the organization due to several conflicts. The slide provides information about major components such as person, team and organization. Slidegeeks is here to make your presentations a breeze with Workplace Conflict Resolution Calculating The Total Cost Of Workplace Conflict Graphics PDF With our easy-to-use and customizable templates, you can focus on delivering your ideas rather than worrying about formatting. With a variety of designs to choose from, youre sure to find one that suits your needs. And with animations and unique photos, illustrations, and fonts, you can make your presentation pop. So whether youre giving a sales pitch or presenting to the board, make sure to check out Slidegeeks first.
Performance Evaluation Sales And Profit Tracking Report Ideas Pdf
This slide illustrate tables that helps in tracking performance of product and also track profit margin. It includes elements such as item code, item name, quantity , total cost, total sales, gross profit and profit margin. Showcasing this set of slides titled Performance Evaluation Sales And Profit Tracking Report Ideas Pdf The topics addressed in these templates are Product Performance Dashboard, Total Sales, Gross Profit All the content presented in this PPT design is completely editable. Download it and make adjustments in color, background, font etc. as per your unique business setting. This slide illustrate tables that helps in tracking performance of product and also track profit margin. It includes elements such as item code, item name, quantity , total cost, total sales, gross profit and profit margin.
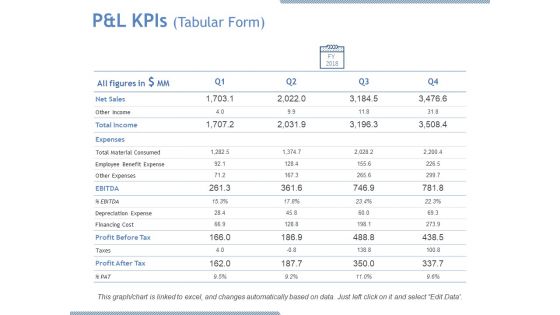
P And L Kpis Tabular Form Ppt PowerPoint Presentation Outline Aids
This is a p and l kpis tabular form ppt powerpoint presentation outline aids. This is a four stage process. The stages in this process are net sales, other income, total income, expenses, taxes.

Investment Ask Sales Pitch Deck For Online Retail Ppt Sample
Following slide showcases total funding amount required by company for growth and development. It includes insights about total amount requirements along with objectives such as global expansion, strategic alliances etc. This Investment Ask Sales Pitch Deck For Online Retail Ppt Sample is perfect for any presentation, be it in front of clients or colleagues. It is a versatile and stylish solution for organizing your meetings. The Investment Ask Sales Pitch Deck For Online Retail Ppt Sample features a modern design for your presentation meetings. The adjustable and customizable slides provide unlimited possibilities for acing up your presentation. Slidegeeks has done all the homework before launching the product for you. So, do not wait, grab the presentation templates today Following slide showcases total funding amount required by company for growth and development. It includes insights about total amount requirements along with objectives such as global expansion, strategic alliances etc.
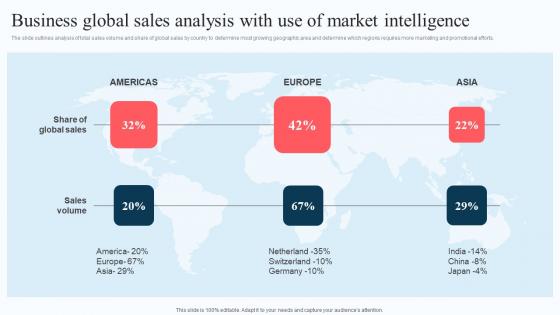
Business Global Sales Analysis With Use Of Execution Of Strategic Intelligence Brochure PDF
The slide outlines analysis of total sales volume and share of global sales by country to determine most growing geographic area and determine which regions requires more marketing and promotional efforts. Boost your pitch with our creative Business Global Sales Analysis With Use Of Execution Of Strategic Intelligence Brochure PDF. Deliver an awe-inspiring pitch that will mesmerize everyone. Using these presentation templates you will surely catch everyones attention. You can browse the ppts collection on our website. We have researchers who are experts at creating the right content for the templates. So you do not have to invest time in any additional work. Just grab the template now and use them. The slide outlines analysis of total sales volume and share of global sales by country to determine most growing geographic area and determine which regions requires more marketing and promotional efforts.
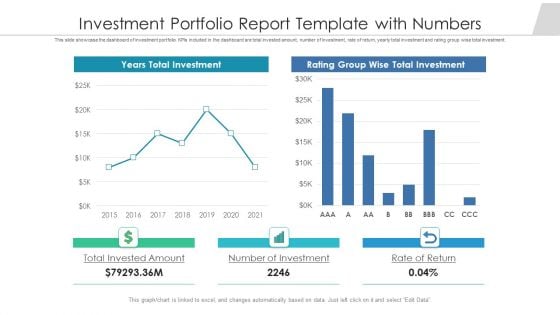
Investment Portfolio Report Template With Numbers Ppt PowerPoint Presentation Gallery Grid PDF
This slide showcase the dashboard of investment portfolio. KPIs included in the dashboard are total invested amount, number of investment, rate of return, yearly total investment and rating group wise total investment. Pitch your topic with ease and precision using this investment portfolio report template with numbers ppt powerpoint presentation gallery grid pdf. This layout presents information on total invested amount, number of investment, rate of return. It is also available for immediate download and adjustment. So, changes can be made in the color, design, graphics or any other component to create a unique layout.
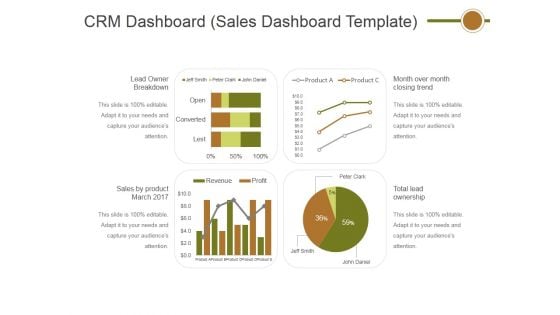
Crm Dashboard Sales Dashboard Template Ppt PowerPoint Presentation Professional Layout
This is a crm dashboard sales dashboard template ppt powerpoint presentation professional layout. This is a four stage process. The stages in this process are lead owner breakdown, sales by product march 2017, total lead ownership, month over month closing trend.

Total Quality Management Elements Ppt PowerPoint Presentation Complete Deck With Slides
Presenting this set of slides with name total quality management elements ppt powerpoint presentation complete deck with slides. The topics discussed in these slides are sales, financing cost, inventories, training plans, consultation. This is a completely editable PowerPoint presentation and is available for immediate download. Download now and impress your audience.
Investment Fund Performance Tracking Dashboard Microsoft PDF
This slide showcases a dashboard to track and supervise funds performance for portfolio balancing . it includes key components such as amount invested in funds, number of invested funds, rate of return, annual investments and rating wise investments. Pitch your topic with ease and precision using this Investment Fund Performance Tracking Dashboard Microsoft PDF. This layout presents information on Amount Invented Funds, Rate Return, Rating Wise Investments. It is also available for immediate download and adjustment. So, changes can be made in the color, design, graphics or any other component to create a unique layout.
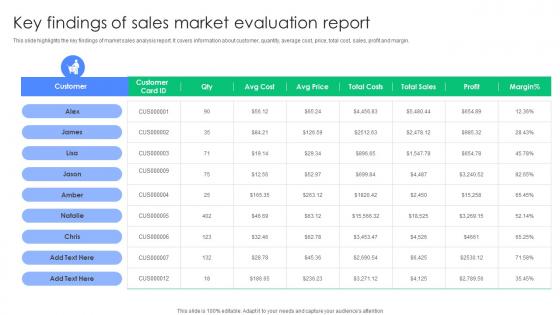
Key Findings Of Sales Market Evaluation Report Microsoft Pdf
This slide highlights the key findings of market sales analysis report. It covers information about customer, quantity, average cost, price, total cost, sales, profit and margin. Pitch your topic with ease and precision using this Key Findings Of Sales Market Evaluation Report Microsoft Pdf. This layout presents information on Customer, Sales Market, Evaluation Report. It is also available for immediate download and adjustment. So, changes can be made in the color, design, graphics or any other component to create a unique layout. This slide highlights the key findings of market sales analysis report. It covers information about customer, quantity, average cost, price, total cost, sales, profit and margin.
Quarterly Regional Sales Performance Report Icons Pdf
This slide provides quarterly performance sales report of different branches. It includes key elements such as actual sales, targeted sales, quarterly total revenue, and individual store sales. Showcasing this set of slides titled Quarterly Regional Sales Performance Report Icons Pdf. The topics addressed in these templates are Quarterly Regional, Sales Performance Report. All the content presented in this PPT design is completely editable. Download it and make adjustments in color, background, font etc. as per your unique business setting. This slide provides quarterly performance sales report of different branches. It includes key elements such as actual sales, targeted sales, quarterly total revenue, and individual store sales.
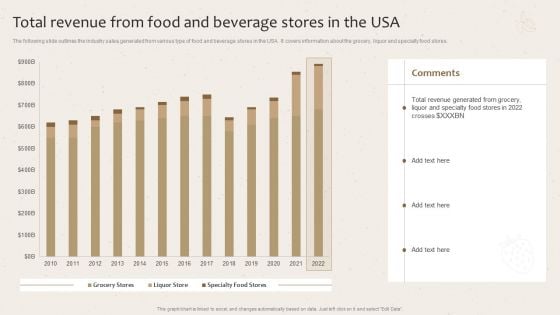
Total Revenue From Food And Beverage Stores In The Usa Launching New Beverage Product Mockup PDF
The following slide outlines the industry sales generated from various type of food and beverage stores in the USA. It covers information about the grocery, liquor and specialty food stores. Coming up with a presentation necessitates that the majority of the effort goes into the content and the message you intend to convey. The visuals of a PowerPoint presentation can only be effective if it supplements and supports the story that is being told. Keeping this in mind our experts created Total Revenue From Food And Beverage Stores In The Usa Launching New Beverage Product Mockup PDF to reduce the time that goes into designing the presentation. This way, you can concentrate on the message while our designers take care of providing you with the right template for the situation.
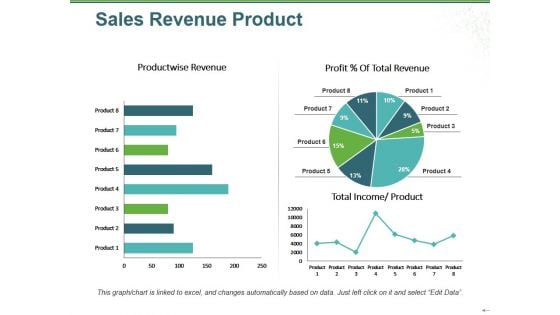
Sales Revenue Product Ppt PowerPoint Presentation Infographic Template Infographic Template
This is a sales revenue product ppt powerpoint presentation infographic template infographic template. This is a three stage process. The stages in this process are product wise revenue, total income, product, profit total revenue, pie.

Weekly Report On Corporate Product Sales Portrait Pdf
Mentioned slide showcases weekly product sales report to inform management about revenue growth. It comprises of components such as price per unit, units sold and total sales for four weeks. Showcasing this set of slides titled Weekly Report On Corporate Product Sales Portrait Pdf. The topics addressed in these templates are Weekly Report, Corporate Product Sales. All the content presented in this PPT design is completely editable. Download it and make adjustments in color, background, font etc. as per your unique business setting. Mentioned slide showcases weekly product sales report to inform management about revenue growth. It comprises of components such as price per unit, units sold and total sales for four weeks.
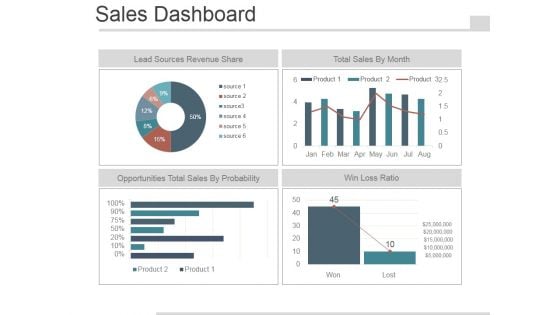
Sales Dashboard Slide Template 2 Ppt PowerPoint Presentation Images
This is a sales dashboard slide template 2 ppt powerpoint presentation images. This is a four stage process. The stages in this process are lead sources revenue share, total sales by month, opportunities total sales by probability, win loss ratio.
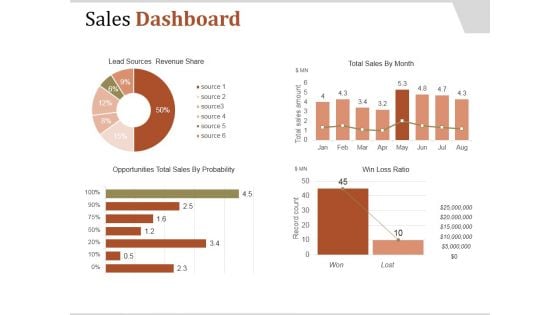
Sales Dashboard Template 2 Ppt PowerPoint Presentation Clipart
This is a sales dashboard template 2 ppt powerpoint presentation clipart. This is a four stage process. The stages in this process are lead sources revenue share, total sales by month, win loss ratio, opportunities total sales by probability.
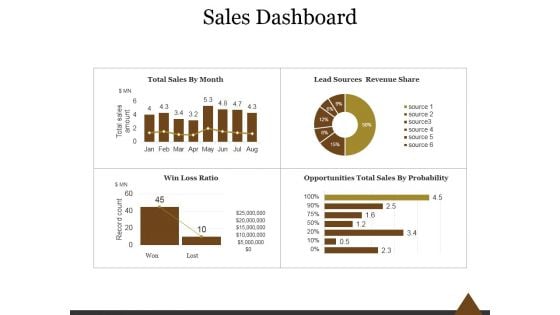
Sales Dashboard Template 2 Ppt PowerPoint Presentation Introduction
This is a sales dashboard template 2 ppt powerpoint presentation introduction. This is a four stage process. The stages in this process are total sales by month, lead sources revenue share, win loss ratio, opportunities total sales by probability.
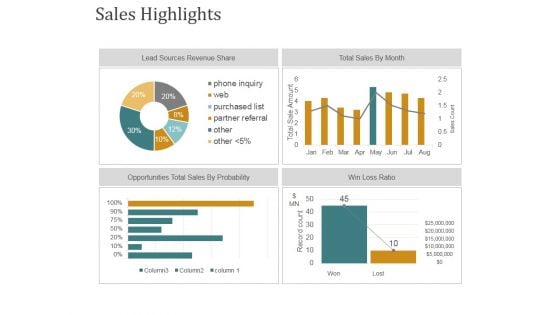
Sales Highlights Ppt PowerPoint Presentation Infographic Template Show
This is a sales highlights ppt powerpoint presentation infographic template show. This is a four stage process. The stages in this process are lead sources revenue share, total sales by month, opportunities total sales by probability, win loss ratio.
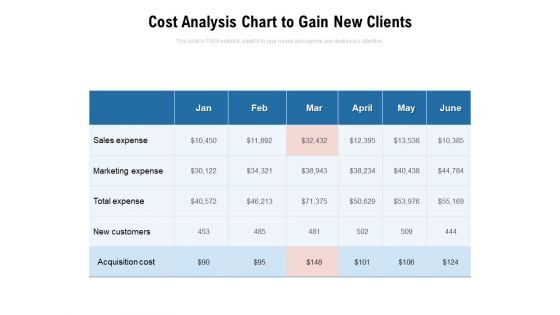
Cost Analysis Chart To Gain New Clients Ppt PowerPoint Presentation Outline Inspiration PDF
Presenting this set of slides with name cost analysis chart to gain new clients ppt powerpoint presentation outline inspiration pdf. The topics discussed in these slides are sales expense, marketing expense, total expense, new customers, acquisition cost. This is a completely editable PowerPoint presentation and is available for immediate download. Download now and impress your audience.
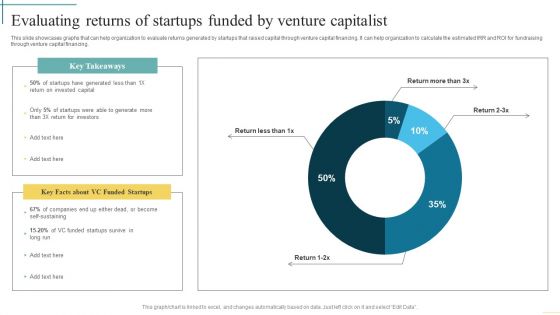
Evaluating Returns Of Startups Funded By Venture Capitalist Developing Fundraising Techniques Microsoft PDF
This slide illustrates graph that can help organization to evaluate the percentage of IPO generating negative returns. It can company to evaluate the success rate of raising money through public by issuing IPO.Boost your pitch with our creative Evaluating Returns Of Startups Funded By Venture Capitalist Developing Fundraising Techniques Microsoft PDF. Deliver an awe-inspiring pitch that will mesmerize everyone. Using these presentation templates you will surely catch everyones attention. You can browse the ppts collection on our website. We have researchers who are experts at creating the right content for the templates. So you do not have to invest time in any additional work. Just grab the template now and use them.
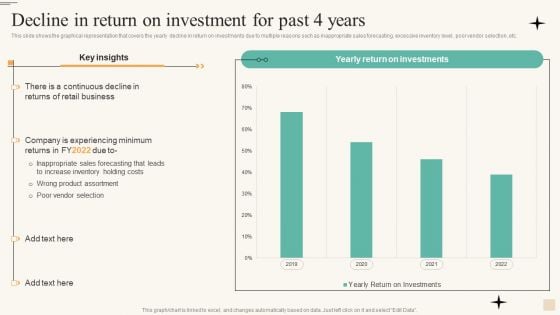
Retail Merchandise Management To Improve Buyer Engagement Decline In Return Graphics PDF
This slide shows the graphical representation that covers the yearly decline in return on investments due to multiple reasons such as inappropriate sales forecasting, excessive inventory level, poor vendor selection, etc. Formulating a presentation can take up a lot of effort and time, so the content and message should always be the primary focus. The visuals of the PowerPoint can enhance the presenters message, so our Retail Merchandise Management To Improve Buyer Engagement Decline In Return Graphics PDF was created to help save time. Instead of worrying about the design, the presenter can concentrate on the message while our designers work on creating the ideal templates for whatever situation is needed. Slidegeeks has experts for everything from amazing designs to valuable content, we have put everything into Retail Merchandise Management To Improve Buyer Engagement Decline In Return Graphics PDF.
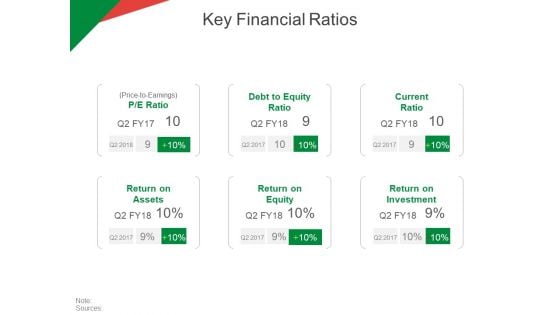
Key Financial Ratios Ppt PowerPoint Presentation File Graphics Tutorials
This is a key financial ratios ppt powerpoint presentation file graphics tutorials. This is a six stage process. The stages in this process are return on assets, return on equity return on investment, current ratio, debt to equity ratio.
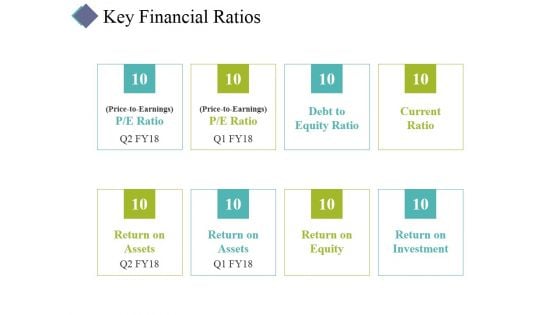
Key Financial Ratios Ppt PowerPoint Presentation Styles Portfolio
This is a key financial ratios ppt powerpoint presentation styles portfolio. This is a eight stage process. The stages in this process are return on assets, return on equity, return on investment, current ratio, debt to equity ratio.
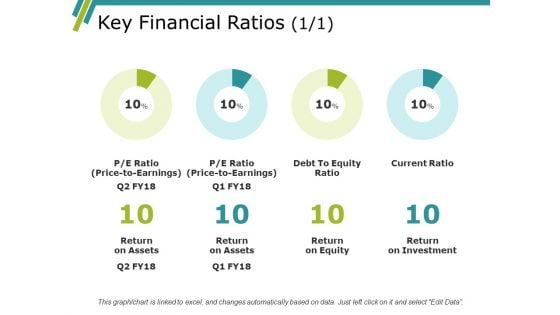
Key Financial Ratios Ppt PowerPoint Presentation Model Elements
This is a key financial ratios ppt powerpoint presentation model elements. This is a four stage process. The stages in this process are return on assets, return on equity, return on investment.
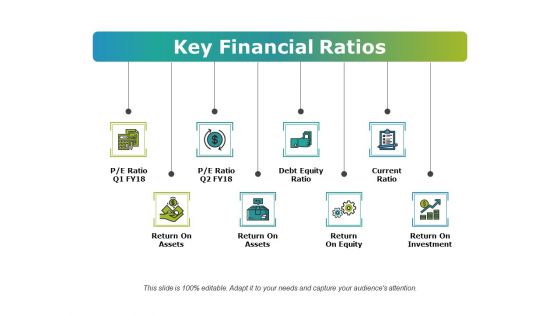
Key Financial Ratios Ppt PowerPoint Presentation Gallery Example
This is a key financial ratios ppt powerpoint presentation gallery example. This is a eight stage process. The stages in this process are return on assets, return on equity, return on investment, current ratio, debt equity ratio.

Key Financial Ratios Ppt PowerPoint Presentation Infographics Files
This is a key financial ratios ppt powerpoint presentation infographics files. This is a four stage process. The stages in this process are return on assets, return on equity, return on investment, current ratio, debt to equity ratio.

Key Financial Ratios Management Ppt Powerpoint Presentation Slides Graphics Example
This is a key financial ratios management ppt powerpoint presentation slides graphics example. This is a four stage process. The stages in this process are current ratio, return on investment, return on equity, return on assets, business.
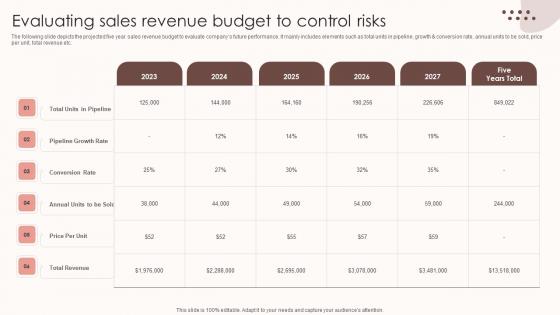
Assessing Sales Risks Evaluating Sales Revenue Budget To Control Risks Ideas PDF
The following slide depicts the projected five year sales revenue budget to evaluate companys future performance. It mainly includes elements such as total units in pipeline, growth and conversion rate, annual units to be sold, price per unit, total revenue etc. Crafting an eye-catching presentation has never been more straightforward. Let your presentation shine with this tasteful yet straightforward Assessing Sales Risks Evaluating Sales Revenue Budget To Control Risks Ideas PDF template. It offers a minimalistic and classy look that is great for making a statement. The colors have been employed intelligently to add a bit of playfulness while still remaining professional. Construct the ideal Assessing Sales Risks Evaluating Sales Revenue Budget To Control Risks Ideas PDF that effortlessly grabs the attention of your audience Begin now and be certain to wow your customers The following slide depicts the projected five year sales revenue budget to evaluate companys future performance. It mainly includes elements such as total units in pipeline, growth and conversion rate, annual units to be sold, price per unit, total revenue etc.

Sales Performance Dashboard Ppt PowerPoint Presentation Good
This is a sales performance dashboard ppt powerpoint presentation good. This is a four stage process. The stages in this process are lead sources revenue share, total sales by month, opportunities total sales by probability, win loss ratio.
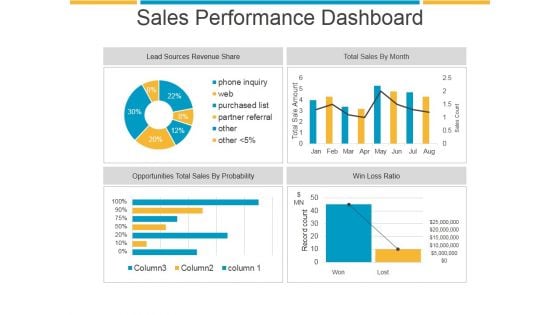
Sales Performance Dashboard Ppt PowerPoint Presentation Show
This is a sales performance dashboard ppt powerpoint presentation show. This is a four stage process. The stages in this process are lead sources revenue share, total sales by month, opportunities total sales by probability, win loss ratio.
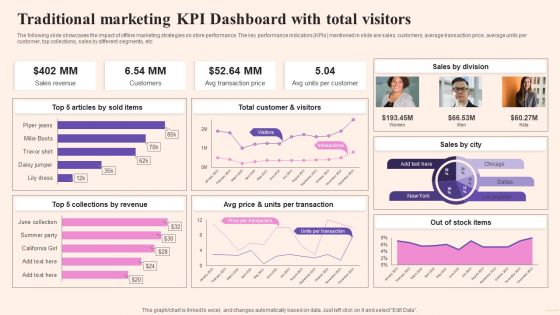
Comprehensive Guide To Build Marketing Traditional Marketing KPI Dashboard With Total Designs PDF
The following slide showcases the impact of offline marketing strategies on store performance. The key performance indicators KPIs mentioned in slide are sales, customers, average transaction price, average units per customer, top collections, sales by different segments, etc. Retrieve professionally designed Comprehensive Guide To Build Marketing Traditional Marketing KPI Dashboard With Total Designs PDF to effectively convey your message and captivate your listeners. Save time by selecting pre-made slideshows that are appropriate for various topics, from business to educational purposes. These themes come in many different styles, from creative to corporate, and all of them are easily adjustable and can be edited quickly. Access them as PowerPoint templates or as Google Slides themes. You do not have to go on a hunt for the perfect presentation because Slidegeeks got you covered from everywhere.

KPI Dashboard To Assess Retail Sales Food And Grocery Retail Ppt Sample
This slide covers KPI dashboard to analyze sales performance of retail store. It involves details such as total sales revenue, number of customers, average transaction price and average unit per customer. From laying roadmaps to briefing everything in detail, our templates are perfect for you. You can set the stage with your presentation slides. All you have to do is download these easy-to-edit and customizable templates. KPI Dashboard To Assess Retail Sales Food And Grocery Retail Ppt Sample will help you deliver an outstanding performance that everyone would remember and praise you for. Do download this presentation today. This slide covers KPI dashboard to analyze sales performance of retail store. It involves details such as total sales revenue, number of customers, average transaction price and average unit per customer.
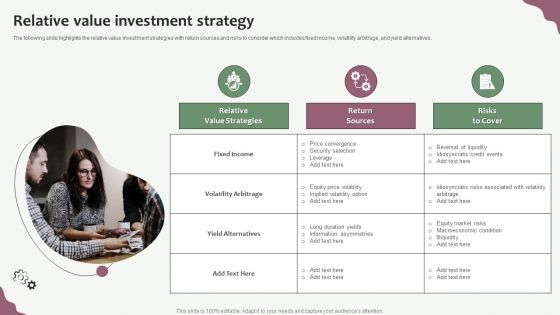
Hedge Funds Trading And Investing Strategies Relative Value Investment Strategy Rules PDF
The following slide highlights the relative value investment strategies with return sources and risks to consider which includes fixed income, volatility arbitrage, and yield alternatives. Presenting Hedge Funds Trading And Investing Strategies Relative Value Investment Strategy Rules PDF to provide visual cues and insights. Share and navigate important information on three stages that need your due attention. This template can be used to pitch topics like Relative Value Strategies, Return Sources, Risks To Cover. In addtion, this PPT design contains high resolution images, graphics, etc, that are easily editable and available for immediate download.
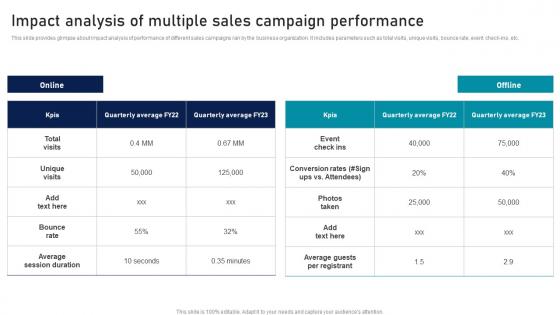
Impact Analysis Of Multiple Sales Campaign Strategic Sales Plan To Enhance Themes Pdf
This slide provides glimpse about impact analysis of performance of different sales campaigns ran by the business organization. It includes parameters such as total visits, unique visits, bounce rate, event check-ins, etc. Coming up with a presentation necessitates that the majority of the effort goes into the content and the message you intend to convey. The visuals of a PowerPoint presentation can only be effective if it supplements and supports the story that is being told. Keeping this in mind our experts created Impact Analysis Of Multiple Sales Campaign Strategic Sales Plan To Enhance Themes Pdf to reduce the time that goes into designing the presentation. This way, you can concentrate on the message while our designers take care of providing you with the right template for the situation. This slide provides glimpse about impact analysis of performance of different sales campaigns ran by the business organization. It includes parameters such as total visits, unique visits, bounce rate, event check-ins, etc.
Impact Analysis Multiple Sales Effective Sales Strategy To Enhance Customer Retention Icons Pdf
This slide provides glimpse about impact analysis of performance of different sales campaigns ran by the business organization. It includes parameters such as total visits, unique visits, bounce rate, event check ins, etc. Coming up with a presentation necessitates that the majority of the effort goes into the content and the message you intend to convey. The visuals of a PowerPoint presentation can only be effective if it supplements and supports the story that is being told. Keeping this in mind our experts created Impact Analysis Multiple Sales Effective Sales Strategy To Enhance Customer Retention Icons Pdf to reduce the time that goes into designing the presentation. This way, you can concentrate on the message while our designers take care of providing you with the right template for the situation. This slide provides glimpse about impact analysis of performance of different sales campaigns ran by the business organization. It includes parameters such as total visits, unique visits, bounce rate, event check ins, etc.

Key Financial Ratios Template 1 Ppt PowerPoint Presentation Slides Styles
This is a key financial ratios template 1 ppt powerpoint presentation slides styles. This is a six stage process. The stages in this process are debt to equity ratio, current ratio, assets, return on, equity, return on, investment.
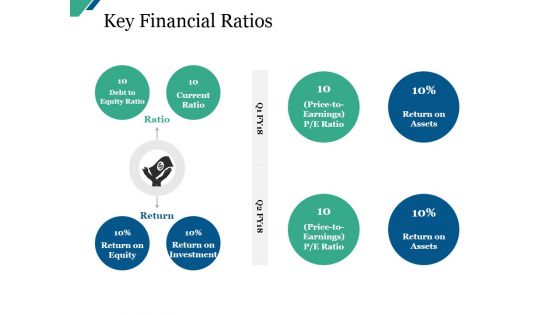
Key Financial Ratios Ppt PowerPoint Presentation Infographic Template Master Slide
This is a key financial ratios ppt powerpoint presentation infographic template master slide. This is a eight stage process. The stages in this process are debt to equity ratio, current ratio, return on equity, return on investment.
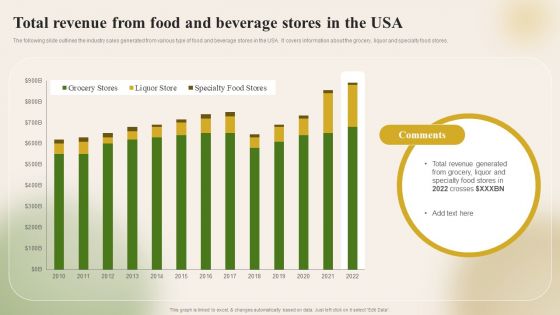
Introducing New Food Commodity Total Revenue From Food And Beverage Stores In The USA Download PDF
The following slide outlines the industry sales generated from various type of food and beverage stores in the USA. It covers information about the grocery, liquor and specialty food stores. Get a simple yet stunning designed Introducing New Food Commodity Total Revenue From Food And Beverage Stores In The USA Download PDF. It is the best one to establish the tone in your meetings. It is an excellent way to make your presentations highly effective. So, download this PPT today from Slidegeeks and see the positive impacts. Our easy-to-edit Introducing New Food Commodity Total Revenue From Food And Beverage Stores In The USA Download PDF can be your go-to option for all upcoming conferences and meetings. So, what are you waiting for Grab this template today.
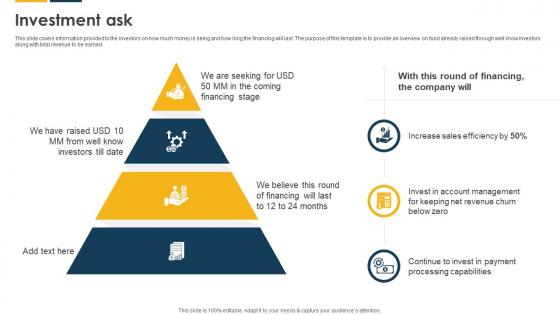
Investment Ask Payroll Solutions Provider Investor Funding Elevator Pitch Deck
This slide covers information provided to the investors on how much money is being and how long the financing will last. The purpose of this template is to provide an overview on fund already raised through well know investors along with total revenue to be earned. Whether you have daily or monthly meetings, a brilliant presentation is necessary. Investment Ask Payroll Solutions Provider Investor Funding Elevator Pitch Deck can be your best option for delivering a presentation. Represent everything in detail using Investment Ask Payroll Solutions Provider Investor Funding Elevator Pitch Deck and make yourself stand out in meetings. The template is versatile and follows a structure that will cater to your requirements. All the templates prepared by Slidegeeks are easy to download and edit. Our research experts have taken care of the corporate themes as well. So, give it a try and see the results. This slide covers information provided to the investors on how much money is being and how long the financing will last. The purpose of this template is to provide an overview on fund already raised through well know investors along with total revenue to be earned.
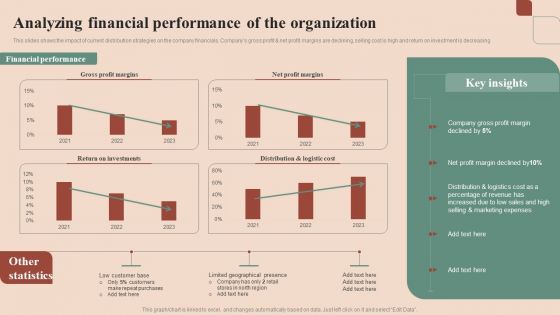
Maximizing Profit Returns With Right Distribution Source Analyzing Financial Performance Of The Organization Introduction PDF
This slides shows the impact of current distribution strategies on the company financials. Companys gross profit and net profit margins are declining, selling cost is high and return on investment is decreasing . Create an editable Maximizing Profit Returns With Right Distribution Source Analyzing Financial Performance Of The Organization Introduction PDF that communicates your idea and engages your audience. Whether you are presenting a business or an educational presentation, pre-designed presentation templates help save time. Maximizing Profit Returns With Right Distribution Source Analyzing Financial Performance Of The Organization Introduction PDF is highly customizable and very easy to edit, covering many different styles from creative to business presentations. Slidegeeks has creative team members who have crafted amazing templates. So, go and get them without any delay.

Marketing Growth Strategy KPI Dashboard To Evaluate Sales Performance Strategy SS V
The following slide outlines key performance indicator KPI dashboard to monitor sales performance of company. The key metrics covered in slide are total sales by location, monthly sales trend, average revenue AR by clients, etc. This Marketing Growth Strategy KPI Dashboard To Evaluate Sales Performance Strategy SS V is perfect for any presentation, be it in front of clients or colleagues. It is a versatile and stylish solution for organizing your meetings. The Marketing Growth Strategy KPI Dashboard To Evaluate Sales Performance Strategy SS V features a modern design for your presentation meetings. The adjustable and customizable slides provide unlimited possibilities for acing up your presentation. Slidegeeks has done all the homework before launching the product for you. So, do not wait, grab the presentation templates today The following slide outlines key performance indicator KPI dashboard to monitor sales performance of company. The key metrics covered in slide are total sales by location, monthly sales trend, average revenue AR by clients, etc.
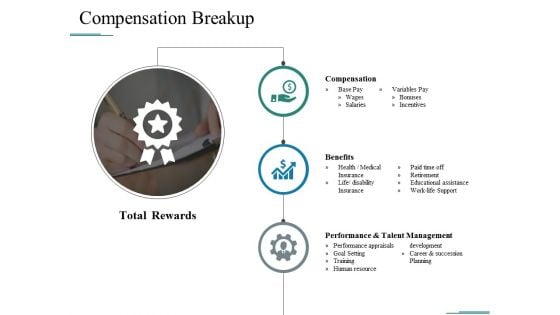
Compensation Breakup Ppt PowerPoint Presentation Infographics Layout Ideas
This is a compensation breakup ppt powerpoint presentation infographics layout ideas. This is a three stage process. The stages in this process are compensation, benefits, performance and talent management, total rewards.
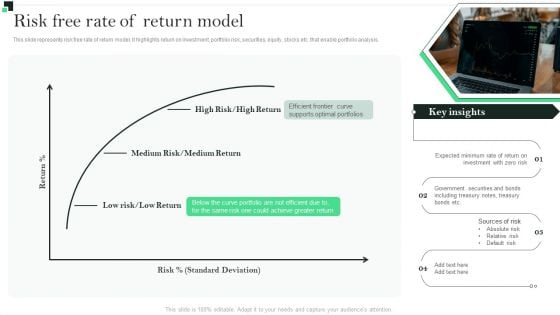
Risk Free Rate Of Return Model Strategies To Enhance Portfolio Management Graphics PDF
This slide represents risk free rate of return model. It highlights return on investment, portfolio risk, securities, equity, stocks etc. that enable portfolio analysis.This Risk Free Rate Of Return Model Strategies To Enhance Portfolio Management Graphics PDF is perfect for any presentation, be it in front of clients or colleagues. It is a versatile and stylish solution for organizing your meetings. The Risk Free Rate Of Return Model Strategies To Enhance Portfolio Management Graphics PDF features a modern design for your presentation meetings. The adjustable and customizable slides provide unlimited possibilities for acing up your presentation. Slidegeeks has done all the homework before launching the product for you. So, do not wait, grab the presentation templates today.
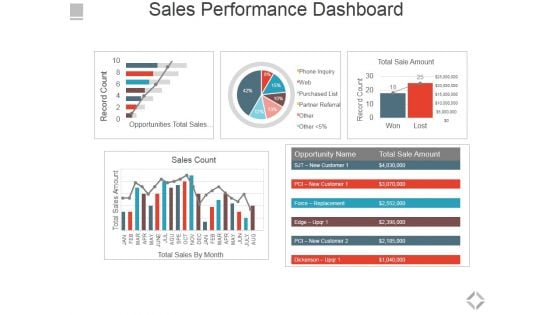
Sales Performance Dashboard Ppt PowerPoint Presentation File Graphics Pictures
This is a sales performance dashboard ppt powerpoint presentation file graphics pictures. This is a five stage process. The stages in this process are total sales by month, sales count, opportunities total sales by probability, total sale amount.
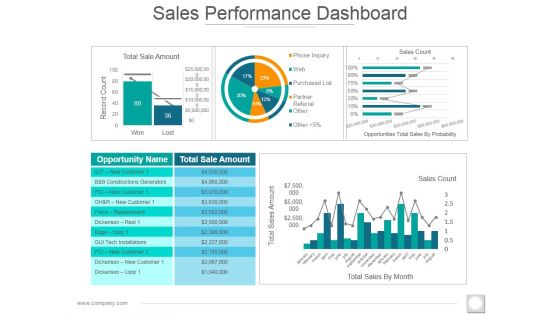
Sales Performance Dashboard Ppt PowerPoint Presentation Styles Images
This is a sales performance dashboard ppt powerpoint presentation styles images. This is a five stage process. The stages in this process are total sale amount, record count, sales count, total sales amount, total sales by month.
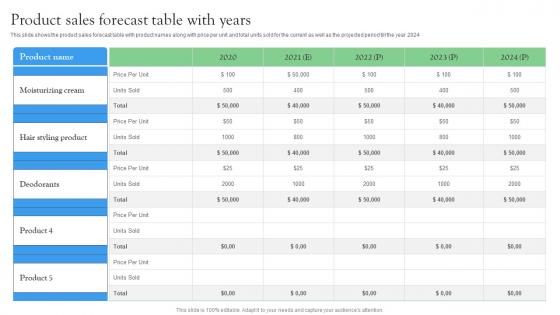
Product Sales Forecast Table With Years Startup Investment Sources Microsoft Pdf
This slide shows the product sales forecast table with product names along with price per unit and total units sold for the current as well as the projected period till the year 2024. Coming up with a presentation necessitates that the majority of the effort goes into the content and the message you intend to convey. The visuals of a PowerPoint presentation can only be effective if it supplements and supports the story that is being told. Keeping this in mind our experts created Product Sales Forecast Table With Years Startup Investment Sources Microsoft Pdf to reduce the time that goes into designing the presentation. This way, you can concentrate on the message while our designers take care of providing you with the right template for the situation. This slide shows the product sales forecast table with product names along with price per unit and total units sold for the current as well as the projected period till the year 2024.
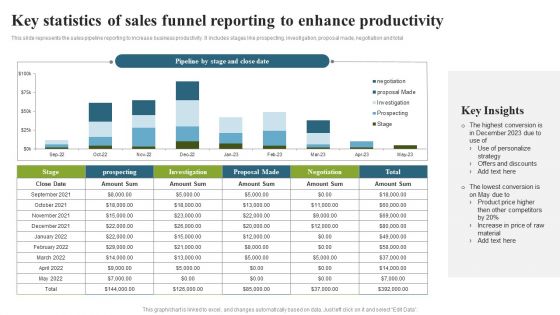
Key Statistics Of Sales Funnel Reporting To Enhance Productivity Clipart PDF
This slide represents the sales pipeline reporting to increase business productivity. It includes stages like prospecting, investigation, proposal made, negotiation and total. Showcasing this set of slides titled Key Statistics Of Sales Funnel Reporting To Enhance Productivity Clipart PDF. The topics addressed in these templates are Highest Conversion Offers Discounts, Product Higher. All the content presented in this PPT design is completely editable. Download it and make adjustments in color, background, font etc. as per your unique business setting.
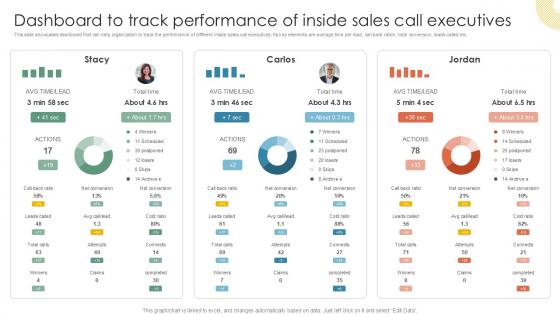
Dashboard To Track Performance Of Inside Vs Outside Sales PPT PowerPoint Strategy SS V
This slide showcases dashboard that can help organization to track the performance of different inside sales call executives. Its key elements are average time per lead, call back ration, total conversion, leads called etc. Do you have an important presentation coming up Are you looking for something that will make your presentation stand out from the rest Look no further than Dashboard To Track Performance Of Inside Vs Outside Sales PPT PowerPoint Strategy SS V. With our professional designs, you can trust that your presentation will pop and make delivering it a smooth process. And with Slidegeeks, you can trust that your presentation will be unique and memorable. So why wait Grab Dashboard To Track Performance Of Inside Vs Outside Sales PPT PowerPoint Strategy SS V today and make your presentation stand out from the rest This slide showcases dashboard that can help organization to track the performance of different inside sales call executives. Its key elements are average time per lead, call back ration, total conversion, leads called etc.


 Continue with Email

 Home
Home


