Roles And Responsibilities Chart
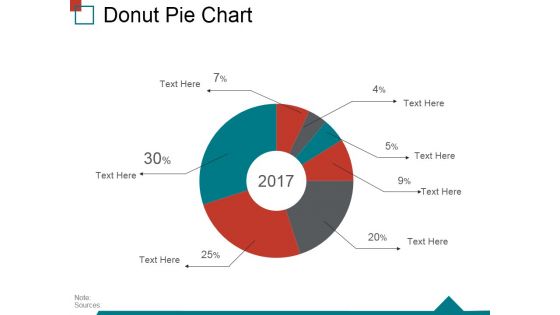
Donut Pie Chart Ppt PowerPoint Presentation Model Example
This is a donut pie chart ppt powerpoint presentation model example. This is a seven stage process. The stages in this process are donut pie chart, business, marketing, success, process.
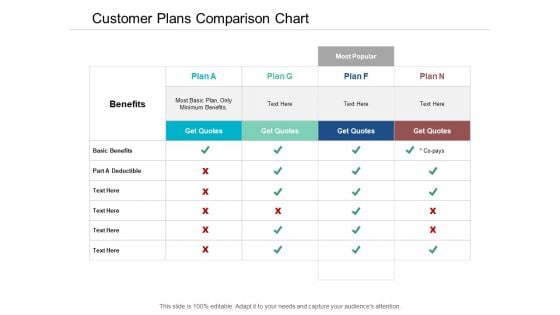
Customer Plans Comparison Chart Ppt Powerpoint Presentation Outline Graphics Example
This is a customer plans comparison chart ppt powerpoint presentation outline graphics example. This is a four stage process. The stages in this process are comparison chart, comparison table, comparison matrix.
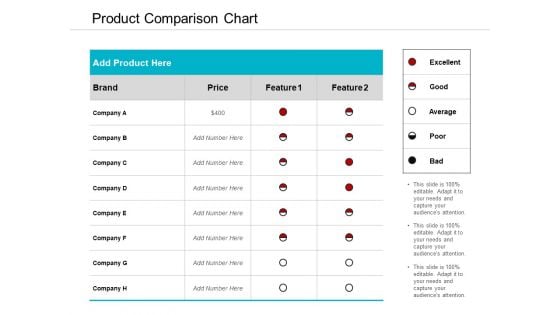
Product Comparison Chart Ppt Powerpoint Presentation Styles Background Designs
This is a product comparison chart ppt powerpoint presentation styles background designs. This is a two stage process. The stages in this process are comparison chart, comparison table, comparison matrix.
Employee Recruitment Process Flow Chart For Organization Icons PDF
This slide consists of employee recruitment process followed by HR personnel to hire the best candidate for the company. Key steps are to specify job description, classify recruitment, create job openings, review applications, schedule interview etc. Presenting Employee Recruitment Process Flow Chart For Organization Icons PDF to dispense important information. This template comprises one stages. It also presents valuable insights into the topics including Specify Job Description, Classify Recruitment, Special Hiring. This is a completely customizable PowerPoint theme that can be put to use immediately. So, download it and address the topic impactfully.
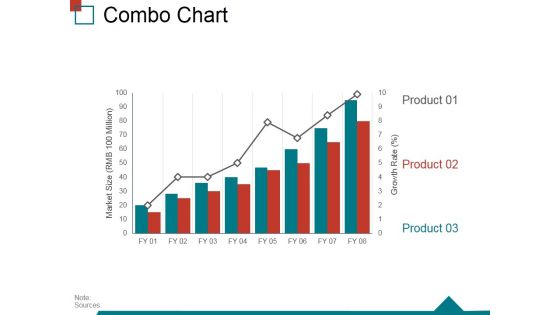
Combo Chart Ppt PowerPoint Presentation Layouts Visual Aids
This is a combo chart ppt powerpoint presentation layouts visual aids. This is a three stage process. The stages in this process are combo chart, process, growth, success, strategy.
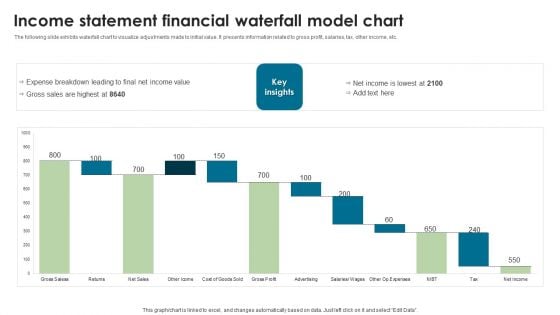
Income Statement Financial Waterfall Model Chart Elements PDF
The following slide exhibits waterfall chart to visualize adjustments made to initial value. It presents information related to gross profit, salaries, tax, other income, etc. Showcasing this set of slides titled Income Statement Financial Waterfall Model Chart Elements PDF. The topics addressed in these templates are Income, Statement Financial, Model Chart. All the content presented in this PPT design is completely editable. Download it and make adjustments in color, background, font etc. as per your unique business setting.
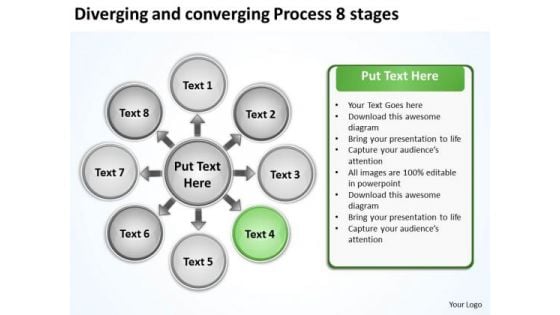
Diverging And Converging Process 8 Stages Target Chart PowerPoint Slides
We present our diverging and converging process 8 stages Target Chart PowerPoint Slides.Present our Ring Charts PowerPoint Templates because that was the well known Musketeers call. Use our Circle Charts PowerPoint Templates because you can Amplify your views, ideas and thoughts from very basic aspects to the highly technical and complicated issus using this template as a tool. Download and present our Process and flows PowerPoint Templates because it Highlights the results of you thought process and convinces your team of the reasons for selecting a particular path to follow. Present our Flow charts PowerPoint Templates because it helps you to enlighten those around you with the value of your insight. Download our Business PowerPoint Templates because this diagram can set an example to enthuse your team with the passion and fervour of your ideas.Use these PowerPoint slides for presentations relating to Arrows, blank, business,central, centralized, chart, circle, circular,circulation, concept, conceptual,converging, design, diagram, empty,executive, icon, idea, illustration,management, map, mapping, mba,model, numbers, organization, outwards,pointing, procedure, process, radial,radiating, relationship. The prominent colors used in the PowerPoint template are Black, White, Gray. People tell us our diverging and converging process 8 stages Target Chart PowerPoint Slides are Ultra. Professionals tell us our central PowerPoint templates and PPT Slides are Enchanting. We assure you our diverging and converging process 8 stages Target Chart PowerPoint Slides are Dynamic. PowerPoint presentation experts tell us our circulation PowerPoint templates and PPT Slides are Zippy. We assure you our diverging and converging process 8 stages Target Chart PowerPoint Slides will generate and maintain the level of interest you desire. They will create the impression you want to imprint on your audience. People tell us our chart PowerPoint templates and PPT Slides are Nifty. Present like a genius. Our Diverging And Converging Process 8 Stages Target Chart PowerPoint Slides help you play the part.
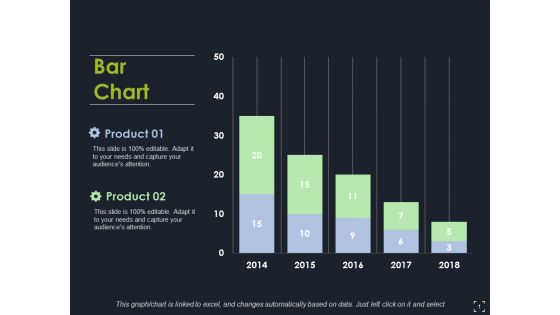
Bar Chart Ppt PowerPoint Presentation Model Clipart Images
This is a bar chart ppt powerpoint presentation model clipart images. This is a two stage process. The stages in this process are bar chart, finance, marketing, strategy, analysis.
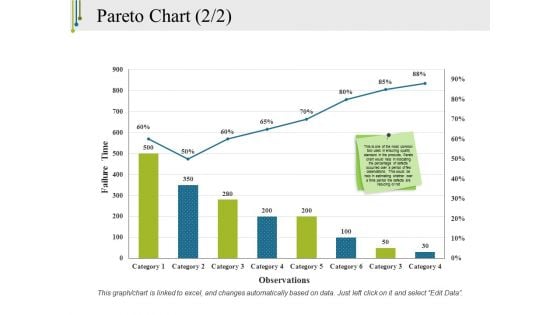
Pareto Chart Template 2 Ppt PowerPoint Presentation Outline Model
This is a pareto chart template 2 ppt powerpoint presentation outline model. This is a eight stage process. The stages in this process are pareto chart, finance, marketing, strategy, analysis.
Scatter Bubble Chart Ppt PowerPoint Presentation Model Icon
This is a scatter bubble chart ppt powerpoint presentation model icon. This is a three stage process. The stages in this process are finance, business, management, marketing, chart and graph.
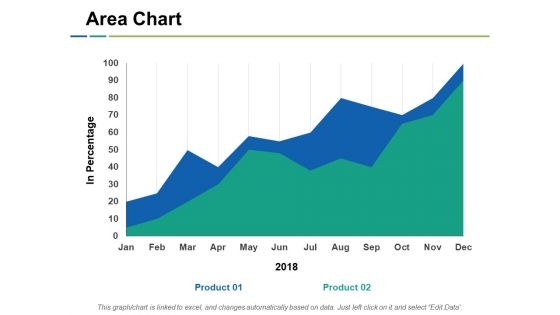
Area Chart Ppt PowerPoint Presentation Model Slide Portrait
This is a area chart ppt powerpoint presentation model slide portrait. This is a two stage process. The stages in this process are area chart, financial, business, marketing, planning, strategy.
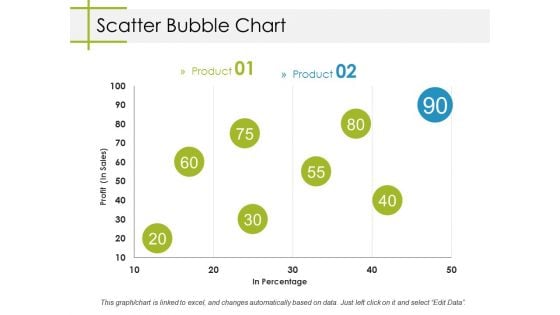
Scatter Bubble Chart Ppt PowerPoint Presentation Model Designs
This is a scatter bubble chart ppt powerpoint presentation model designs. This is a two stage process. The stages in this process are business, profit, in percentage, bubble chart, marketing.
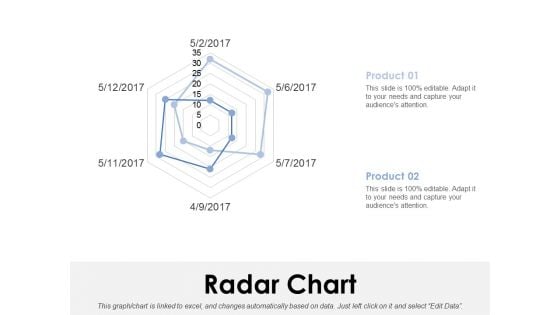
Radar Chart Ppt PowerPoint Presentation Model Clipart Images
This is a radar chart ppt powerpoint presentation model clipart images. This is a two stage process. The stages in this process are radar chart, finance, analysis, marketing, strategy, business.
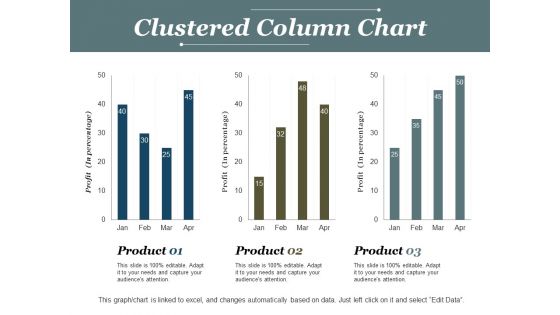
Clustered Column Chart Ppt PowerPoint Presentation Model Deck
This is a clustered column chart ppt powerpoint presentation model deck. This is a three stage process. The stages in this process are clustered column chart, product, finance, profit, business.
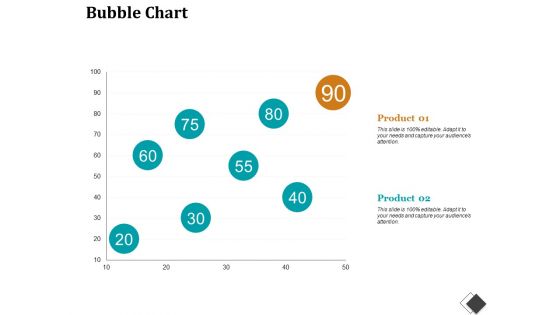
Bubble Chart Enterprise Model Canvas Ppt PowerPoint Presentation File Structure
This is a bubble chart enterprise model canvas ppt powerpoint presentation file structure. This is a two stage process. The stages in this process are bubble chart, finance, marketing, strategy, analysis, investment.
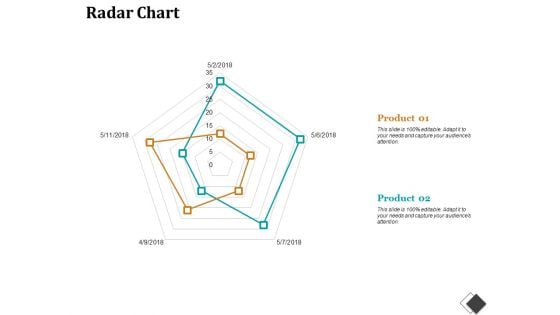
Radar Chart Enterprise Model Canvas Ppt PowerPoint Presentation File Slides
This is a radar chart enterprise model canvas ppt powerpoint presentation file slides. This is a two stage process. The stages in this process are radar chart, finance, marketing, strategy, business.
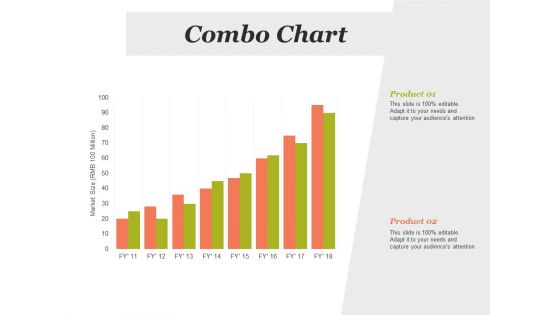
Combo Chart Process Ppt PowerPoint Presentation Model Clipart
This is a combo chart process ppt powerpoint presentation model clipart. This is a two stage process. The stages in this process are combo chart, finance, marketing, strategy, business.
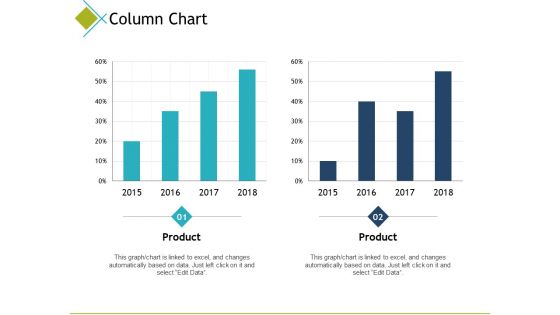
Column Chart Finance Ppt PowerPoint Presentation Model Examples
This is a column chart finance ppt powerpoint presentation model examples. This is a two stage process. The stages in this process are column chart, finance, marketing, analysis, investment.
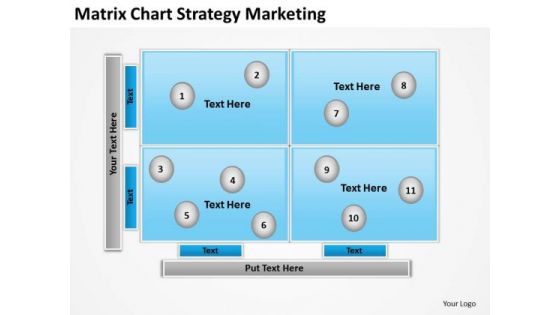
Matrix Chart Strategy Marketing Ppt Computer Business Plan PowerPoint Slides
Document the process on our matrix chart strategy marketing ppt computer business plan PowerPoint Slides. Make a record of every detail. Satiate desires with our Boxes Powerpoint templates. Give them all they want and more. Be the doer with our Spheres Powerpoint templates. Put your thoughts into practice. Experience bliss with our Matrix Chart Strategy Marketing Ppt Computer Business Plan PowerPoint Slides. They bring pure comfort with them.
Business PowerPoint Template Matrix Chart Ppt Templates Backgrounds For Slides
Create your domain with our Business powerpoint template matrix chart ppt templates backgrounds for slides. Rule minds with your thoughts. Get the domestics right with our Advertising PowerPoint Templates. Create the base for thoughts to grow. Do away with dogmatic approaches. Establish the value of reason with our Education PowerPoint Templates. Conceive plans with our Business PowerPoint Template Matrix Chart Ppt Templates Backgrounds For Slides. Download without worries with our money back guaranteee.
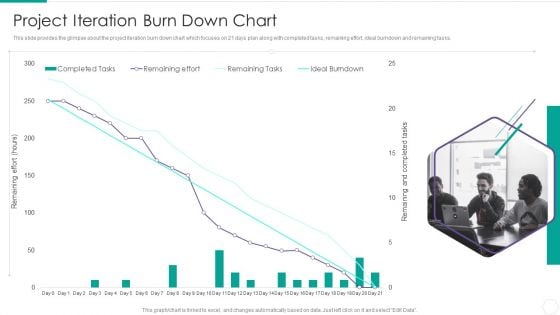
Quantitative Risk Assessment Project Iteration Burn Down Chart Sample PDF
This slide provides the glimpse about the project iteration burn down chart which focuses on 21 days plan along with completed tasks, remaining effort, ideal burndown and remaining tasks. Deliver an awe inspiring pitch with this creative Quantitative Risk Assessment Project Iteration Burn Down Chart Sample PDF bundle. Topics like Project Iteration Burn Down Chart can be discussed with this completely editable template. It is available for immediate download depending on the needs and requirements of the user.
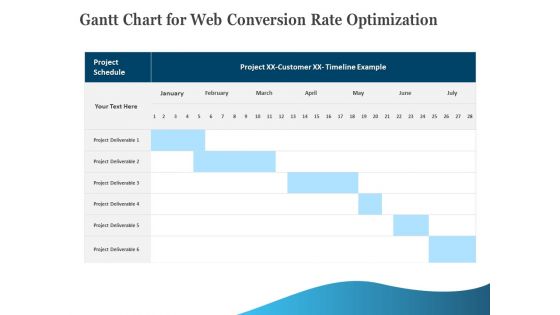
Gantt Chart For Web Conversion Rate Optimization Download PDF
Your complex projects can be managed and organized simultaneously using this detailed gantt chart for web conversion rate optimization download pdf template. Track the milestones, tasks, phases, activities, and subtasks to get an updated visual of your project. Share your planning horizon and release plan with this well-crafted presentation template. This exemplary template can be used to plot various dependencies to distinguish the tasks in the pipeline and their impact on the schedules and deadlines of the project. Apart from this, you can also share this visual presentation with your team members and stakeholders. It a resourceful tool that can be incorporated into your business structure. Therefore, download and edit it conveniently to add the data and statistics as per your requirement.
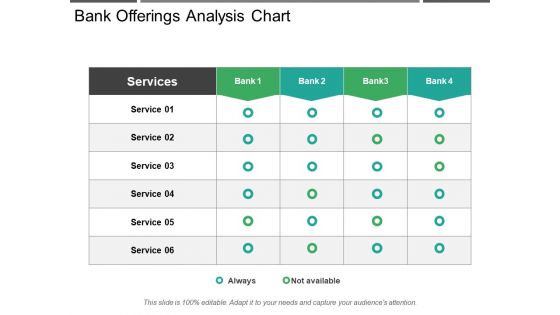
Bank Offerings Analysis Chart Ppt PowerPoint Presentation Slides Show
This is a bank offerings analysis chart ppt powerpoint presentation slides show. This is a five stage process. The stages in this process are comparison chart, comparison table, comparison matrix.
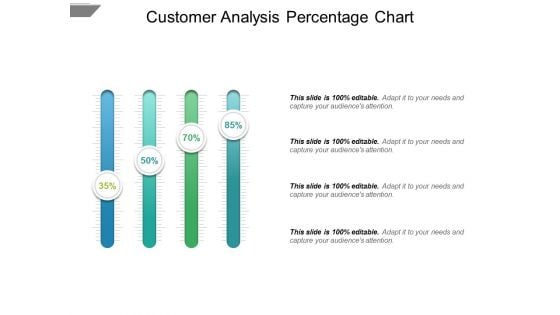
Customer Analysis Percentage Chart Ppt PowerPoint Presentation Infographics Master Slide
This is a customer analysis percentage chart ppt powerpoint presentation infographics master slide. This is a four stage process. The stages in this process are comparison chart, comparison table, comparison matrix.
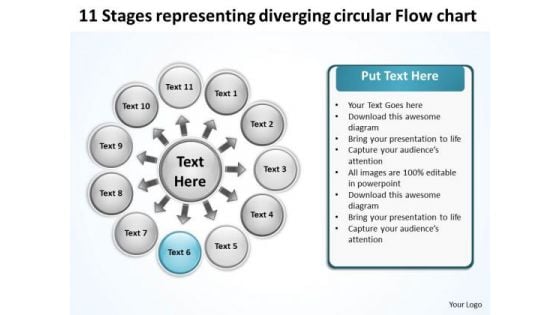
11 Stages Representing Diverging Circular Flow Chart Target PowerPoint Slides
We present our 11 stages representing diverging circular flow chart Target PowerPoint Slides.Download and present our Process and flows PowerPoint Templates because you have a handle on all the targets, a master of the game, the experienced and consummate juggler. Download and present our Flow charts PowerPoint Templates because you can outline your targets to your team. Present our Circle Charts PowerPoint Templates because you can Signpost your preferred roadmap to your eager co- travellers and demonstrate clearly how you intend to navigate them towards the desired corporate goal. Download and present our Ring Charts PowerPoint Templates because you have a good idea of the roadmap to your desired destination. Download and present our Business PowerPoint Templates because the great Bald headed Eagle embodies your personality. the eagle eye to seize upon the smallest of opportunities.Use these PowerPoint slides for presentations relating to Arrows, business, central, centralized, chart, circle, circular, circulation, concept, conceptual, converging, design, diagram, executive, icon, idea, illustration, management, mapping, model, numbers, organization, outwards, pointing, procedure, process, radial, radiating, relationship, resource, sequence, sequential, square. The prominent colors used in the PowerPoint template are Blue, White, Black. You can be sure our 11 stages representing diverging circular flow chart Target PowerPoint Slides are Playful. Presenters tell us our centralized PowerPoint templates and PPT Slides will make the presenter look like a pro even if they are not computer savvy. We assure you our 11 stages representing diverging circular flow chart Target PowerPoint Slides will generate and maintain the level of interest you desire. They will create the impression you want to imprint on your audience. Customers tell us our circulation PowerPoint templates and PPT Slides are Sparkling. Presenters tell us our 11 stages representing diverging circular flow chart Target PowerPoint Slides are Adorable. You can be sure our centralized PowerPoint templates and PPT Slides are Bright. Arouse the excitement with our 11 Stages Representing Diverging Circular Flow Chart Target PowerPoint Slides. Stir up the audience with your views.
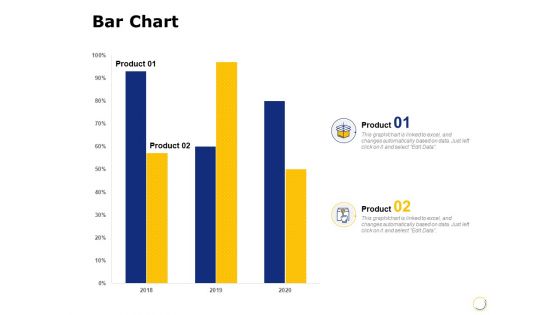
Bar Chart Finance Ppt PowerPoint Presentation Model Files
Presenting this set of slides with name bar chart finance ppt powerpoint presentation model files. The topics discussed in these slide is bar chart. This is a completely editable PowerPoint presentation and is available for immediate download. Download now and impress your audience.
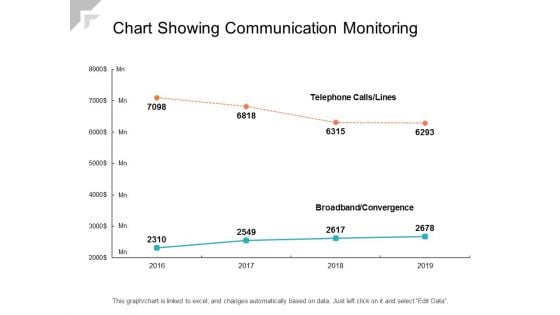
Chart Showing Communication Monitoring Ppt PowerPoint Presentation Model Slideshow
Presenting this set of slides with name chart showing communication monitoring ppt powerpoint presentation model slideshow. The topics discussed in these slides are revenue trend, bar chart, financial. This is a completely editable PowerPoint presentation and is available for immediate download. Download now and impress your audience.
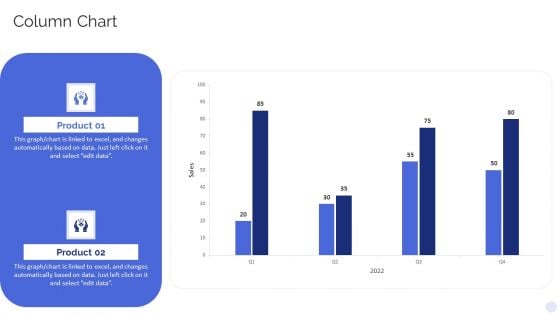
Banking Operations Model Revamp Plan Column Chart Slides PDF
Deliver an awe inspiring pitch with this creative Banking Operations Model Revamp Plan Column Chart Slides PDF bundle. Topics like Column Chart can be discussed with this completely editable template. It is available for immediate download depending on the needs and requirements of the user.
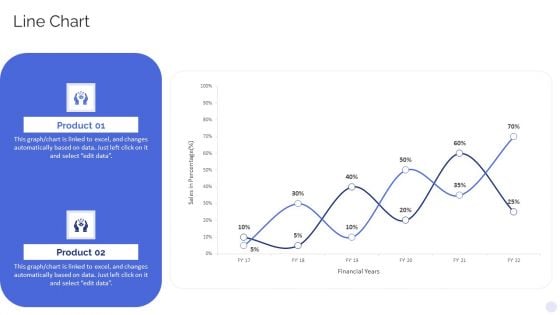
Banking Operations Model Revamp Plan Line Chart Background PDF
Deliver an awe inspiring pitch with this creative Banking Operations Model Revamp Plan Line Chart Background PDF bundle. Topics like Line Chart can be discussed with this completely editable template. It is available for immediate download depending on the needs and requirements of the user.
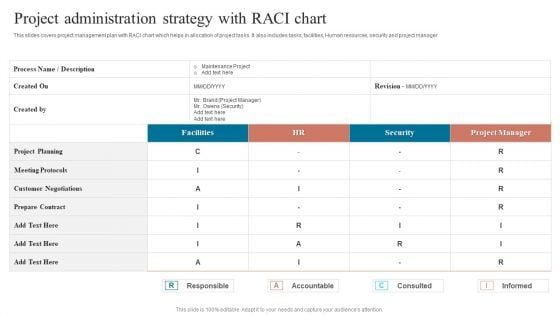
Project Administration Strategy With Raci Chart Rules PDF
This slides covers project management plan with RACI chart which helps in allocation of project tasks. It also includes tasks, facilities, Human resources, security and project manager. Showcasing this set of slides titled Project Administration Strategy With Raci Chart Rules PDF. The topics addressed in these templates are Meeting Protocols, Customer Negotiations, Meeting Protocols. All the content presented in this PPT design is completely editable. Download it and make adjustments in color, background, font etc. as per your unique business setting.
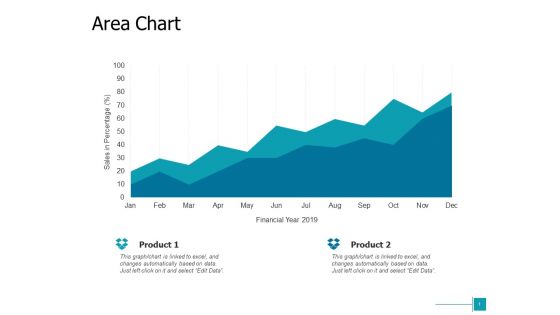
Area Chart Analysis Ppt Powerpoint Presentation Model Layout Ideas
Presenting this set of slides with name area chart analysis ppt powerpoint presentation model layout ideas. The topics discussed in these slides are area chart, finance, marketing, investment, analysis. This is a completely editable PowerPoint presentation and is available for immediate download. Download now and impress your audience.
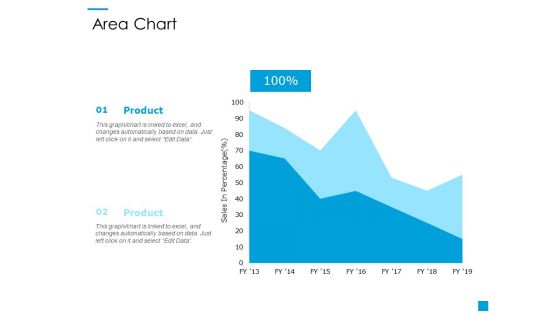
Area Chart Finance Ppt PowerPoint Presentation Model Shapes
Presenting this set of slides with name area chart finance ppt powerpoint presentation model shapes. The topics discussed in these slide is area chart. This is a completely editable PowerPoint presentation and is available for immediate download. Download now and impress your audience.
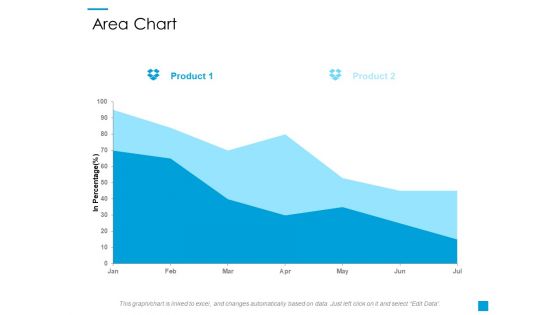
Area Chart Ppt PowerPoint Presentation Model Example Introduction
Presenting this set of slides with name area chart ppt powerpoint presentation model example introduction. The topics discussed in these slide is area chart. This is a completely editable PowerPoint presentation and is available for immediate download. Download now and impress your audience.
Scrum Kpis With Sprint Burndown Chart Ppt Icon Elements PDF
This slide illustrates scrum key performance indicators for individual sprints. It includes tasks, story points, bugs, burndown charts, statistics etc. Pitch your topic with ease and precision using this Scrum Kpis With Sprint Burndown Chart Ppt Icon Elements PDF. This layout presents information on Burndown Chart, Story Points, Cost, Bugs. It is also available for immediate download and adjustment. So, changes can be made in the color, design, graphics or any other component to create a unique layout.
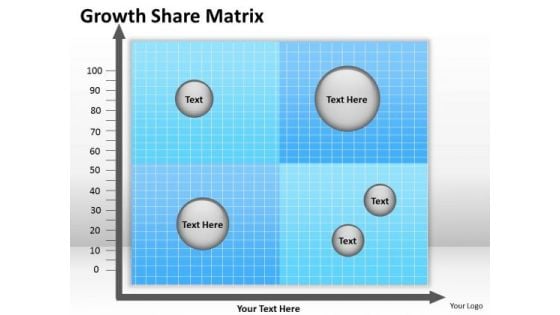
Consulting Diagram Matrix Patterning Chart Mba Models And Frameworks
Our Consulting Diagram Matrix Patterning Chart MBA Models And Frameworks Powerpoint Templates Abhor Doodling. They Never Let The Interest Flag.
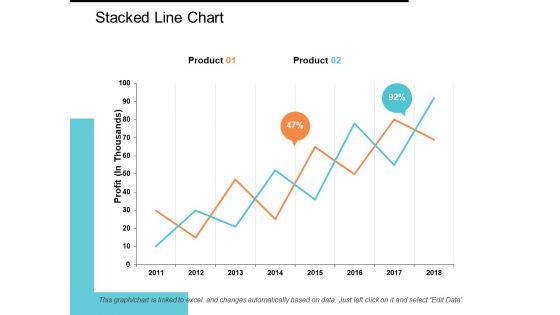
Stacked Line Chart Ppt PowerPoint Presentation Model Show
This is a stacked line chart ppt powerpoint presentation model show. This is a two stage process. The stages in this process are stacked line chart, product, profit, percentage, growth.

Donut Pie Chart Ppt PowerPoint Presentation Pictures Slideshow
This is a donut pie chart ppt powerpoint presentation pictures slideshow. This is a five stage process. The stages in this process are process, circle, charts, donut, business.
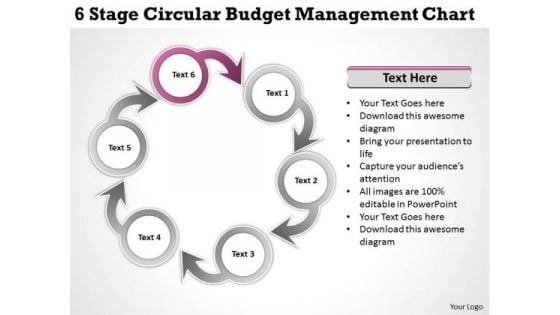
Business Strategy Development Stage Circular Budget Management Chart Ppt Model
We present our business strategy development stage circular budget management chart ppt model.Use our Flow Charts PowerPoint Templates because It will let you Set new benchmarks with our PowerPoint Templates and Slides. They will keep your prospects well above par. Present our Business PowerPoint Templates because You should Kick up a storm with our PowerPoint Templates and Slides. The heads of your listeners will swirl with your ideas. Download and present our Process and Flows PowerPoint Templates because It will Give impetus to the hopes of your colleagues. Our PowerPoint Templates and Slides will aid you in winning their trust. Download and present our Circle Charts PowerPoint Templates because Our PowerPoint Templates and Slides will weave a web of your great ideas. They are gauranteed to attract even the most critical of your colleagues. Present our Shapes PowerPoint Templates because you should once Tap the ingenuity of our PowerPoint Templates and Slides. They are programmed to succeed.Use these PowerPoint slides for presentations relating to Act, arrow, blue, business, chart, check, circle, concept, control, cycle, design, development, diagram, do, engineering, evaluate, flow, flow-chart, flowchart, graphic, green, idea, info graphic, iterative, life-cycle, lifecycle, management, method, model, process, quality, research, schema, software, spiral, step, strategy, success, system, vector, white, work, workflow. The prominent colors used in the PowerPoint template are Pink, Gray, White. Jump over obstacles with our Business Strategy Development Stage Circular Budget Management Chart Ppt Model. Make sure your presentation gets the attention it deserves.
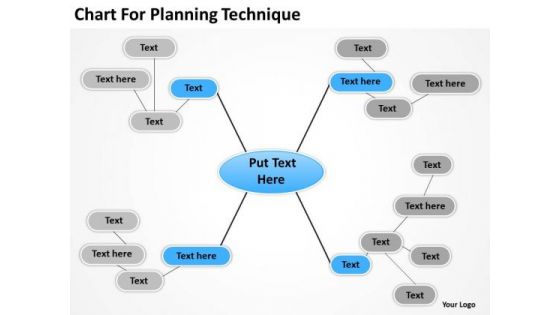
Chart For Planning Technique Ppt Business Model PowerPoint Slides
Establish the dominance of your ideas. Our chart for planning technique ppt business model PowerPoint Slides will put them on top. Your assessment will be the deciding factor. Help the audience figure it out with our Chart For Planning Technique Ppt Business Model PowerPoint Slides.
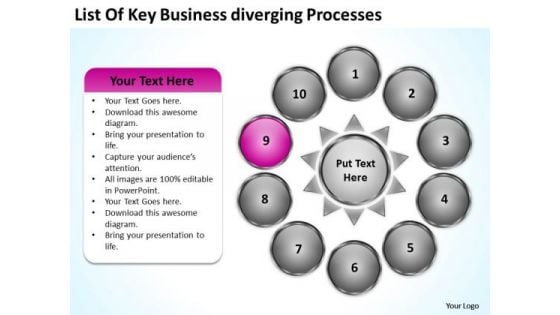
Nine Stages Diverging Factors Flow Chart Circular Diagram PowerPoint Templates
We present our nine stages diverging factors flow chart Circular Diagram PowerPoint templates.Download our Ring Charts PowerPoint Templates because the basic stages are in place, you need to build upon them with our PowerPoint templates. Download and present our Process and Flows PowerPoint Templates because brilliant ideas are your forte. Download and present our Circle charts PowerPoint Templates because you can Refine them all as you take them through the numerous filtering stages of the funnel of your quality control process. Download our Arrows PowerPoint Templates because this template contains the material to highlight the key issues of your presentation. Download our Success PowerPoint Templates because you have come up with a brilliant breakthrough idea. you can also visualise the interest it will generate.Use these PowerPoint slides for presentations relating to Arrow, blue, business, chart, check,circle, concept, control, creative, cycle,design, development, diagram, do,engineering, evaluate, flow, glossy,graphic, green, idea, infographic, life,lifecycle, management, marketing,method, model, pdca, plan, plan,docheckact, process, quality, red,research, software, spiral, step, strategy,success, system. The prominent colors used in the PowerPoint template are Pink, White, Gray. People tell us our nine stages diverging factors flow chart Circular Diagram PowerPoint templates look good visually. Customers tell us our chart PowerPoint templates and PPT Slides are Precious. Professionals tell us our nine stages diverging factors flow chart Circular Diagram PowerPoint templates are Beautiful. Presenters tell us our chart PowerPoint templates and PPT Slides will help you be quick off the draw. Just enter your specific text and see your points hit home. Use our nine stages diverging factors flow chart Circular Diagram PowerPoint templates are Spectacular. Presenters tell us our concept PowerPoint templates and PPT Slides are Second to none. Form plans with our Nine Stages Diverging Factors Flow Chart Circular Diagram PowerPoint Templates. Download without worries with our money back guaranteee.
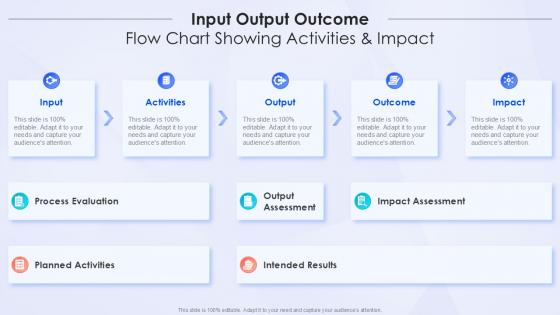
Input Output Outcome Flow Chart Showing Activities And Impact
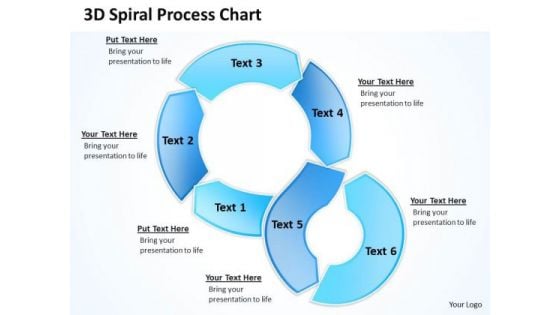
3d Spiral Process Chart Circular Flow Layout Network PowerPoint Templates
We present our 3d spiral process chart Circular Flow Layout Network PowerPoint templates.Download our Flow charts PowerPoint Templates because you are the Champion of your team shall anoint. Download our Circle Charts PowerPoint Templates because our helpful and interactive Diagram is a wonderful tool to serve your purpose. Make interaction between groups using this seamless system. Download our Arrows PowerPoint Templates because your foot is on the pedal and your company is purring along smoothly. Present our Business PowerPoint Templates because your fledgling career is in the chrysallis stage. Nurture it and watch it grow into a beautiful butterfly. Use our Process and Flows PowerPoint Templates because educate your staff on the means to provide the required support for speedy recovery.Use these PowerPoint slides for presentations relating to 3d, Act, Arrow, Blue, Business, Chart, Check, Circle, Concept, Control, Cycle, Design, Development, Diagram, Flow, Flow-Chart, Flowchart, Graphic, Green, Idea, Iterative, Life-Cycle, Lifecycle, Management, Marble, Method, Model, Process, Quality, Research, Schema, Software, Spiral, Step, Strategy, Success. The prominent colors used in the PowerPoint template are Blue, Blue light, White. We assure you our 3d spiral process chart Circular Flow Layout Network PowerPoint templates will make you look like a winner. Customers tell us our Check PowerPoint templates and PPT Slides are Appealing. The feedback we get is that our 3d spiral process chart Circular Flow Layout Network PowerPoint templates are Playful. We assure you our Concept PowerPoint templates and PPT Slides will make you look like a winner. People tell us our 3d spiral process chart Circular Flow Layout Network PowerPoint templates are Nice. We assure you our Chart PowerPoint templates and PPT Slides are Elegant. Be an outperforming global competititor with our 3d Spiral Process Chart Circular Flow Layout Network PowerPoint Templates. They will make you look good.
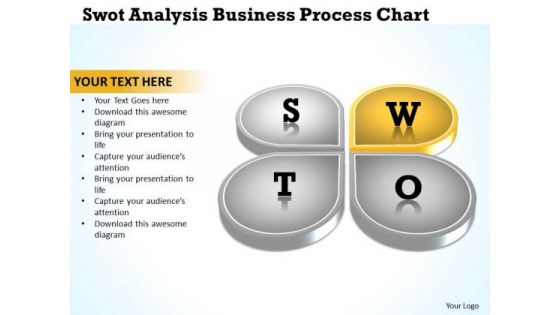
Business Process Diagram Examples Templates Download Chart PowerPoint Slides
We present our business process diagram examples templates download chart PowerPoint Slides.Use our Ring Charts PowerPoint Templates because Our PowerPoint Templates and Slides are a sure bet. Gauranteed to win against all odds. Download our Circle Charts PowerPoint Templates because our bewitching PowerPoint Templates and Slides will delight your audience with the magic of your words. Present our Process and Flows PowerPoint Templates because Our PowerPoint Templates and Slides has conjured up a web of all you need with the help of our great team. Use them to string together your glistening ideas. Use our Business PowerPoint Templates because You can Be the star of the show with our PowerPoint Templates and Slides. Rock the stage with your ideas. Present our Flow Charts PowerPoint Templates because You can Connect the dots. Fan expectations as the whole picture emerges.Use these PowerPoint slides for presentations relating to Analysis, business, change, chart, concept, development, elements, hard, management, model, organization, organization, process, seven, shared, sharedvalues, skills, soft, staff, strategic, strategy, structure, style, system. The prominent colors used in the PowerPoint template are Yellow, Gray, Black. People tell us our business process diagram examples templates download chart PowerPoint Slides effectively help you save your valuable time. PowerPoint presentation experts tell us our concept PowerPoint templates and PPT Slides effectively help you save your valuable time. Presenters tell us our business process diagram examples templates download chart PowerPoint Slides will help you be quick off the draw. Just enter your specific text and see your points hit home. Use our chart PowerPoint templates and PPT Slides will generate and maintain the level of interest you desire. They will create the impression you want to imprint on your audience. Customers tell us our business process diagram examples templates download chart PowerPoint Slides effectively help you save your valuable time. People tell us our change PowerPoint templates and PPT Slides are readymade to fit into any presentation structure. Change behavior with our Business Process Diagram Examples Templates Download Chart PowerPoint Slides. Just download, type and present.
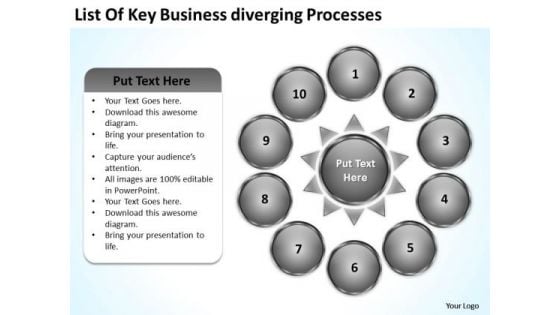
List Of Key Business Diverging Processes Gear Chart PowerPoint Slides
We present our list of key business diverging processes Gear Chart PowerPoint Slides.Use our Ring Charts PowerPoint Templates because you should Lay down the fundamentals to build upon. Download and present our Signs PowerPoint Templates because your ideas are fundamentally stable with a broad base of workable possibilities. Present our Circle charts PowerPoint Templates because they will Amplify your basic corporate concept and forefront the benefits of overlapping processes to arrive at common goals. Use our Process and Flows PowerPoint Templates because You have found the one missing link in the picture. That one strand that will bring together the entire edifice. Put it out there for all to see. Emphasise the value of its contribution in propelling the venture forward. Download our Shapes PowerPoint Templates because infrastructure growth is an obvious requirement of today.inform your group on how exactly this potential is tailor made for you.Use these PowerPoint slides for presentations relating to Arrow, blue, business, chart, check,circle, concept, control, creative, cycle,design, development, diagram, do,engineering, evaluate, flow, glossy,graphic, green, idea, infographic, life,lifecycle, management, marketing,method, model, pdca, plan, plan,docheckact, process, quality, red,research, software, spiral, step, strategy,success, system. The prominent colors used in the PowerPoint template are Gray, Black, White. People tell us our list of key business diverging processes Gear Chart PowerPoint Slides are One-of-a-kind. Customers tell us our circle PowerPoint templates and PPT Slides are Handsome. Professionals tell us our list of key business diverging processes Gear Chart PowerPoint Slides are Beautiful. Presenters tell us our circle PowerPoint templates and PPT Slides are Elevated. Use our list of key business diverging processes Gear Chart PowerPoint Slides are Flirty. Presenters tell us our chart PowerPoint templates and PPT Slides are Tranquil. Do not fall for any popular fallacy. Ascertain the facts with our List Of Key Business Diverging Processes Gear Chart PowerPoint Slides.
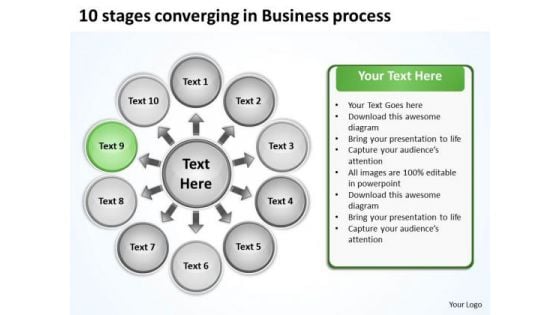
10 Stages Converging Business PowerPoint Theme Process Radial Chart Slides
We present our 10 stages converging business powerpoint theme process Radial Chart Slides.Use our Arrows PowerPoint Templates because they help to lay the base of your trend of thought. Use our Flow charts PowerPoint Templates because this template with an image of helps you chart the course of your presentation. Download and present our Business PowerPoint Templates because the majestic tiger lord of all it surveys.It exudes power even when it is in repose. Present our Process and Flows PowerPoint Templates because you can Take your team along by explaining your plans. Present our Circle charts PowerPoint Templates because it is the time to bond with family, friends, colleagues and any other group of your choice.Use these PowerPoint slides for presentations relating to Business, chart, circle, colors, concept, corporate, cycle, data, design, detail, development, diagram, engineering, graphic, ideas, illustration, image, implement, implementation, life, lifecycle, management, model, objects, organization, plan, process, product, professional, project, quality, schema, shape, stack, stage, steps, strategy, structure, success, symbol. The prominent colors used in the PowerPoint template are Yellow, Black, Gray. You can be sure our 10 stages converging business powerpoint theme process Radial Chart Slides are Luxuriant. Presenters tell us our corporate PowerPoint templates and PPT Slides are effectively colour coded to prioritise your plans They automatically highlight the sequence of events you desire. We assure you our 10 stages converging business powerpoint theme process Radial Chart Slides are Efficient. Customers tell us our data PowerPoint templates and PPT Slides are One-of-a-kind. Presenters tell us our 10 stages converging business powerpoint theme process Radial Chart Slides are Stunning. You can be sure our cycle PowerPoint templates and PPT Slides are Lush. Get rid of the blues with our 10 Stages Converging Business PowerPoint Theme Process Radial Chart Slides. Let hope and happiness flow into your mind.
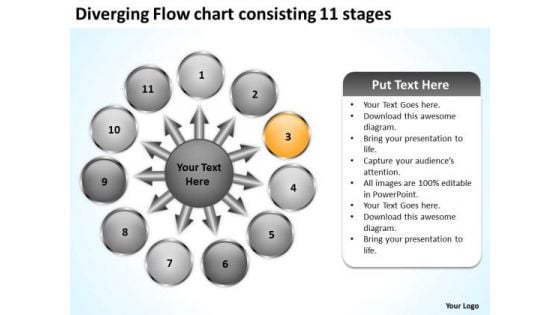
Diverging Flow Chart Consisting 11 Stages Cycle Layout PowerPoint Templates
We present our diverging flow chart consisting 11 stages Cycle Layout PowerPoint templates.Use our Business PowerPoint Templates because this is the unerring accuracy in reaching the target. the effortless ability to launch into flight. Download our Circle Charts PowerPoint Templates because this is an excellent slide to detail and highlight your thought process, your views and your positive expectations.. Present our Arrows PowerPoint Templates because spreading the light of knowledge around you will clear the doubts and enlighten the questioning minds with your brilliance and ability. Use our Shapes PowerPoint Templates because you have the product you need. Use our Flow charts PowerPoint Templates because you can Place them where they need to be.Use these PowerPoint slides for presentations relating to Arrows, blank, business, central, centralized, chart, circle, circular, circulation concept, conceptual, converging, design, diagram, empty, executive, icon, idea illustration, management, map, mapping, moa, model, numbers, organization outwards, pointing, procedure, process, radial, radiating, relationship, resource sequence, sequential, seven, square, strategy, template. The prominent colors used in the PowerPoint template are Yellow, Gray, White. Presenters tell us our diverging flow chart consisting 11 stages Cycle Layout PowerPoint templates are Charming. Presenters tell us our circle PowerPoint templates and PPT Slides are Zippy. PowerPoint presentation experts tell us our diverging flow chart consisting 11 stages Cycle Layout PowerPoint templates are Breathtaking. We assure you our circle PowerPoint templates and PPT Slides are Functional. Customers tell us our diverging flow chart consisting 11 stages Cycle Layout PowerPoint templates help you meet deadlines which are an element of today's workplace. Just browse and pick the slides that appeal to your intuitive senses. People tell us our circulation PowerPoint templates and PPT Slides are Colorful. Step on it with our Diverging Flow Chart Consisting 11 Stages Cycle Layout PowerPoint Templates. Escalate the process with our Diverging Flow Chart Consisting 11 Stages Cycle Layout PowerPoint Templates.
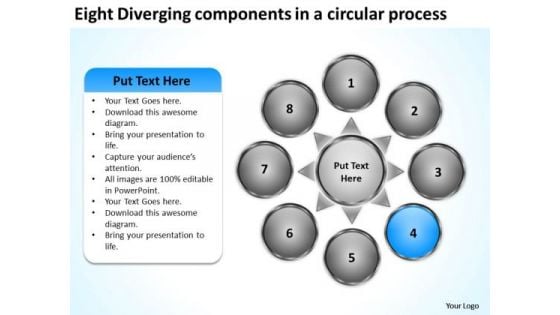
Eight Diverging Components A Circular Process Pie Chart PowerPoint Slides
We present our eight diverging components a circular process Pie Chart PowerPoint Slides.Download our Business PowerPoint Templates because this is the unerring accuracy in reaching the target. the effortless ability to launch into flight. Present our Circle Charts PowerPoint Templates because you have the entire picture in mind. Use our Arrows PowerPoint Templates because this template helps you to put your finger on the pulse of your business and sense the need to re-align a bit. Use our Shapes PowerPoint Templates because this can explain the various related aspects of these varied tracks and how they will, on hitting their own targets, cumulatively contribute to hitting GOLD. Download our Flow charts PowerPoint Templates because this is an appropriate layout to convince your team that they have the ability to score a tEN every time.Use these PowerPoint slides for presentations relating to Arrows, blank, business, central, centralized, chart, circle, circular, circulation concept, conceptual, converging, design, diagram, empty, executive, icon, idea illustration, management, map, mapping, moa, model, numbers, organization outwards, pointing, procedure, process, radial, radiating, relationship, resource sequence, sequential, seven, square, strategy, template. The prominent colors used in the PowerPoint template are Blue, Gray, White. Presenters tell us our eight diverging components a circular process Pie Chart PowerPoint Slides will save the presenter time. Presenters tell us our business PowerPoint templates and PPT Slides are Zippy. PowerPoint presentation experts tell us our eight diverging components a circular process Pie Chart PowerPoint Slides are Appealing. We assure you our chart PowerPoint templates and PPT Slides are Pleasant. Customers tell us our eight diverging components a circular process Pie Chart PowerPoint Slides are Gorgeous. People tell us our business PowerPoint templates and PPT Slides are the best it can get when it comes to presenting. Discover new faith with our Eight Diverging Components A Circular Process Pie Chart PowerPoint Slides. Let extra dimensions in you emerge.
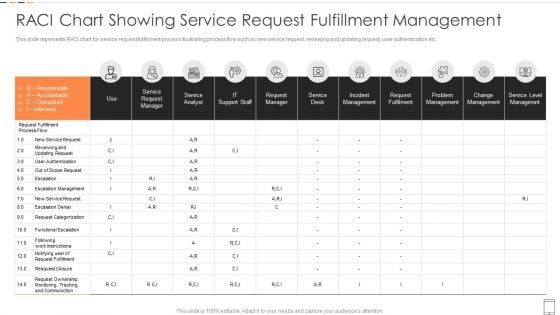
RACI Chart Showing Service Request Fulfillment Management Introduction PDF
This slide represents RACI chart for service request fulfillment process illustrating process flow such as new service request, reviewing and updating request, user authentication etc.Pitch your topic with ease and precision using this RACI Chart Showing Service Request Fulfillment Management Introduction PDF This layout presents information on Incident Management, Request Fulfilment, Problem Management It is also available for immediate download and adjustment. So, changes can be made in the color, design, graphics or any other component to create a unique layout.
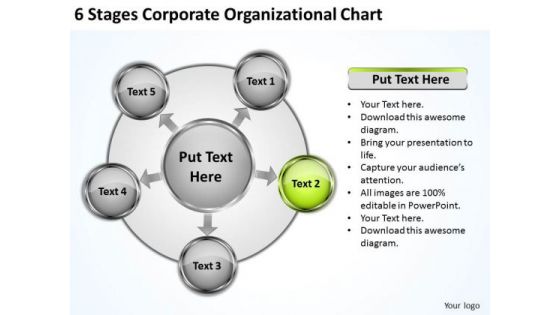
Business Strategy Consultant 6 Stages Corporate Organizational Chart Level
We present our business strategy consultant 6 stages corporate organizational chart level.Use our Process and Flows PowerPoint Templates because Our PowerPoint Templates and Slides help you pinpoint your timelines. Highlight the reasons for your deadlines with their use. Use our Arrows PowerPoint Templates because Our PowerPoint Templates and Slides are topically designed to provide an attractive backdrop to any subject. Download our Business PowerPoint Templates because Your success is our commitment. Our PowerPoint Templates and Slides will ensure you reach your goal. Present our Flow Charts PowerPoint Templates because Our PowerPoint Templates and Slides are specially created by a professional team with vast experience. They diligently strive to come up with the right vehicle for your brilliant Ideas. Present our Circle Charts PowerPoint Templates because Watching this your Audience will Grab their eyeballs, they wont even blink.Use these PowerPoint slides for presentations relating to Abstract, arrows, background, blue, business, button, chart, circle, clipart, concept, cycle, diagram, element, green, guide, icon, isolated, leader, management, marketing, model, organization, plans, presentation, purple, red, report, representation, stakeholder, team, text, tool, vector, white . The prominent colors used in the PowerPoint template are Green, Gray, White. Increase efficiency with our Business Strategy Consultant 6 Stages Corporate Organizational Chart Level. Download without worries with our money back guaranteee.
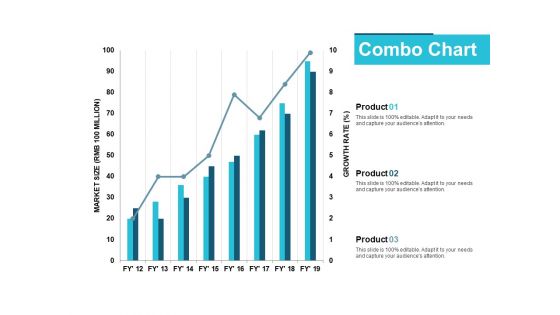
Combo Chart Finance Ppt PowerPoint Presentation Infographic Template Model
This is a combo chart finance ppt powerpoint presentation infographic template model. The topics discussed in this diagram are finance, marketing, management, investment, analysis. This is a completely editable PowerPoint presentation, and is available for immediate download.
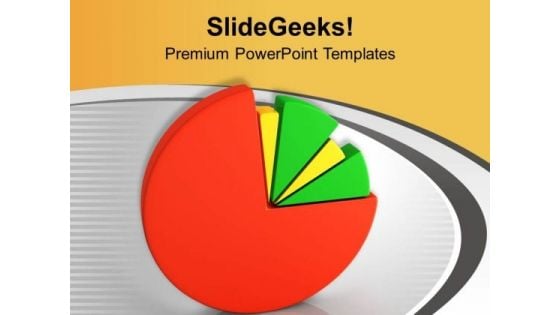
Financial Chart Representation PowerPoint Templates Ppt Backgrounds For Slides 0513
Our Financial Chart Representation PowerPoint Templates PPT Backgrounds For Slides will will follow the drill. They accomplish the task assigned to them. Do the drill with our Pie charts PowerPoint Templates. Your ideas will march ahead. Place the orders with your thoughts. Our Business PowerPoint Templates know the drill. Empowerment is the aim of our Financial Chart Representation PowerPoint Templates Ppt Backgrounds For Slides 0513. They put their all behind your thoughts.
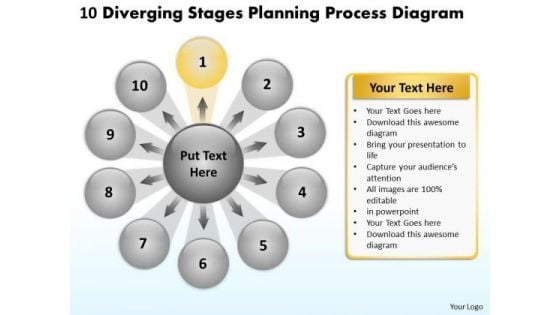
10 Diverging Stages Planning Process Diagram Radial Chart PowerPoint Templates
We present our 10 diverging stages planning process diagram Radial Chart PowerPoint templates.Present our Arrows PowerPoint Templates because you can Show them how to churn out fresh ideas. Present our Flow charts PowerPoint Templates because you can see In any endeavour people matter most. Download our Business PowerPoint Templates because this template helps you to grab the attention of your listeners. Use our Process and Flows PowerPoint Templates because you can enlighten your skills with the help of our topical templates. Download and present our Circle charts PowerPoint Templates because you have the plans ready for them to absorb and understand.Use these PowerPoint slides for presentations relating to Business, chart, circle, colors, concept, corporate, cycle, data, design, detail, development, diagram, engineering, graphic, ideas, illustration, image, implement, implementation, life, lifecycle, management, model, objects, organization, plan, process, product, professional, project, quality, schema, shape, stack, stage, steps, strategy, structure, success, symbol. The prominent colors used in the PowerPoint template are Purple, Black, Gray. You can be sure our 10 diverging stages planning process diagram Radial Chart PowerPoint templates are Efficacious. Presenters tell us our corporate PowerPoint templates and PPT Slides are Dazzling. We assure you our 10 diverging stages planning process diagram Radial Chart PowerPoint templates help you meet deadlines which are an element of today's workplace. Just browse and pick the slides that appeal to your intuitive senses. Customers tell us our circle PowerPoint templates and PPT Slides are Nifty. Presenters tell us our 10 diverging stages planning process diagram Radial Chart PowerPoint templates are Beautiful. You can be sure our corporate PowerPoint templates and PPT Slides are Attractive. Conduct meetings with our 10 Diverging Stages Planning Process Diagram Radial Chart PowerPoint Templates. Download without worries with our money back guaranteee.
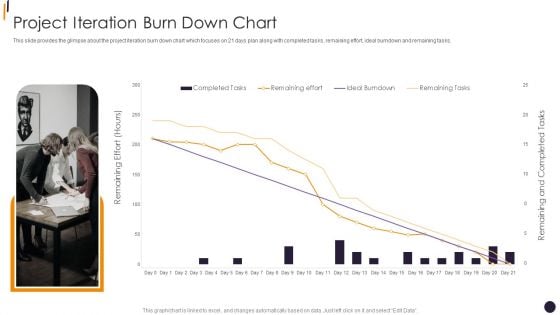
PMP Tools Project Iteration Burn Down Chart Slides PDF
This slide provides the glimpse about the project iteration burn down chart which focuses on 21 days plan along with completed tasks, remaining effort, ideal burndown and remaining tasks.Deliver an awe inspiring pitch with this creative PMP Tools Project Iteration Burn Down Chart Slides PDF bundle. Topics like Remaining Effort, Remaining Tasks, Completed Tasks can be discussed with this completely editable template. It is available for immediate download depending on the needs and requirements of the user.
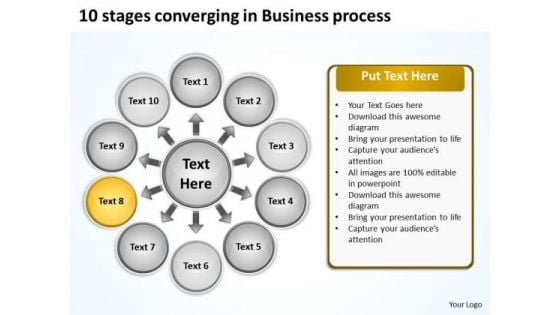
10 Stages Converging Business Process Cycle Chart PowerPoint Slides
We present our 10 stages converging business process Cycle Chart PowerPoint Slides.Use our Arrows PowerPoint Templates because there are various viable propositions available to further your commercial interests. Download our Flow charts PowerPoint Templates because you have developed a vision of where you want to be a few years from now. Download our Business PowerPoint Templates because you are ready to flap your wings and launch off. All poised are you to touch the sky with glory. Present our Process and Flows PowerPoint Templates because this is An innovative slide design depicting driving home the relevance of a steady rhythm. Present our Circle charts PowerPoint Templates because you watch them slowly start to savour the flavour you have served them.Use these PowerPoint slides for presentations relating to Business, chart, circle, colors, concept, corporate, cycle, data, design, detail, development, diagram, engineering, graphic, ideas, illustration, image, implement, implementation, life, lifecycle, management, model, objects, organization, plan, process, product, professional, project, quality, schema, shape, stack, stage, steps, strategy, structure, success, symbol. The prominent colors used in the PowerPoint template are Yellow, White, Gray. You can be sure our 10 stages converging business process Cycle Chart PowerPoint Slides are Swanky. Presenters tell us our corporate PowerPoint templates and PPT Slides are Classic. We assure you our 10 stages converging business process Cycle Chart PowerPoint Slides are One-of-a-kind. Customers tell us our data PowerPoint templates and PPT Slides are Bold. Presenters tell us our 10 stages converging business process Cycle Chart PowerPoint Slides are Handsome. You can be sure our circle PowerPoint templates and PPT Slides are Festive. Collect the facts together on our 10 Stages Converging Business Process Cycle Chart PowerPoint Slides. Draw your conclusions with comparative ease.
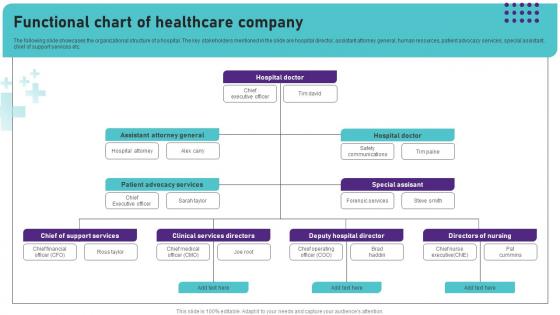
Functional Chart Of Healthcare Company Operational Areas Healthcare Introduction PDF
Make sure to capture your audiences attention in your business displays with our gratis customizable Functional Chart Of Healthcare Company Operational Areas Healthcare Introduction PDF. These are great for business strategies, office conferences, capital raising or task suggestions. If you desire to acquire more customers for your tech business and ensure they stay satisfied, create your own sales presentation with these plain slides. The following slide showcases the organizational structure of a hospital. The key stakeholders mentioned in the slide are hospital director, assistant attorney general, human resources, patient advocacy services, special assistant, chief of support services etc.
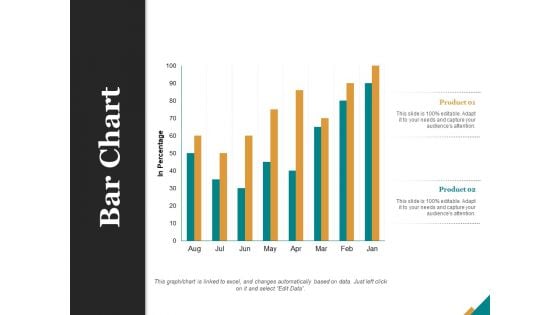
Bar Chart Finance Ppt PowerPoint Presentation Portfolio Model
This is a bar chart finance ppt powerpoint presentation portfolio model. This is a two stage process. The stages in this process are finance, marketing, management, investment, analysis.
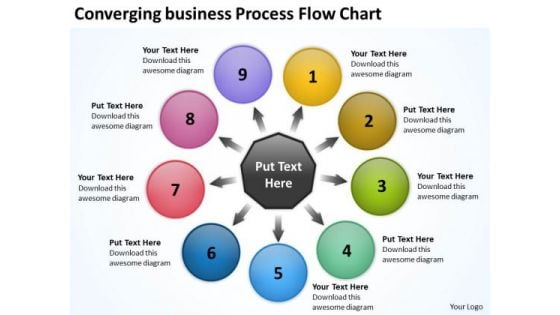
Templates Download Process Flow Chart Circular Layout Diagram PowerPoint Slides
We present our templates download process flow chart Circular Layout Diagram PowerPoint Slides.Download and present our Circle Charts PowerPoint Templates because you have the right arrows in your quiver. Present our Arrows PowerPoint Templates because with the help of our Slides you can Illustrate your ideas one by one and demonstrate how each is an important cog in running the entire wheel. Use our Business PowerPoint Templates because your fledgling career is in the chrysallis stage. Nurture it and watch it grow into a beautiful butterfly. Use our Shapes PowerPoint Templates because with the help of our Slides you can Illustrate your plans on using the many social media modes available to inform soceity at large of the benefits of your product. Use our Flow Charts PowerPoint Templates because with the help of our Slides you can Illustrate your plans to your listeners with the same accuracy.Use these PowerPoint slides for presentations relating to abstract, arrows, blank, business, central, centralized, chart, circle, circular, circulation, concept, conceptual, converging, design, diagram, empty, executive, icon, idea, illustration, management, map, mapping, mba, model, numbers, organization, outwards, pointing, procedure, process, radial, radiating, relationship, resource, sequence, sequential, seven, square, strategy, template. The prominent colors used in the PowerPoint template are Red, Purple, Pink. Customers tell us our templates download process flow chart Circular Layout Diagram PowerPoint Slides are Elevated. PowerPoint presentation experts tell us our central PowerPoint templates and PPT Slides are Tasteful. People tell us our templates download process flow chart Circular Layout Diagram PowerPoint Slides are Second to none. People tell us our circle PowerPoint templates and PPT Slides are Handsome. Customers tell us our templates download process flow chart Circular Layout Diagram PowerPoint Slides are Whimsical. People tell us our central PowerPoint templates and PPT Slides are Splendid. Become an expert presenter with our Templates Download Process Flow Chart Circular Layout Diagram PowerPoint Slides. Dont waste time struggling with PowerPoint. Let us do it for you.

Column Chart Ppt PowerPoint Presentation Model Design Inspiration
This is a column chart ppt powerpoint presentation model design inspiration. This is a three stage process. The stages in this process are business, marketing, bar, graph, plan.
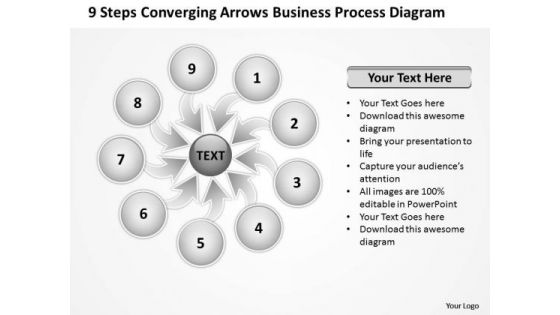
PowerPoint Templates Process Diagram Ppt Circular Flow Chart
We present our powerpoint templates process diagram ppt Circular Flow Chart.Present our Circle Charts PowerPoint Templates because Watching this your Audience will Grab their eyeballs, they wont even blink. Download our Arrows PowerPoint Templates because you have analysed the illness and know the need. Use our Shapes PowerPoint Templates because You can Zap them with our PowerPoint Templates and Slides. See them reel under the impact. Download and present our Business PowerPoint Templates because the basic stages are in place, you need to build upon them with our PowerPoint templates. Download and present our Flow Charts PowerPoint Templates because it illustrates the symbols of human growth.Use these PowerPoint slides for presentations relating to 9, abstract, arrows, blank, business, central, centralized, chart, circle, circular, circulation, concept, conceptual, converging, design, diagram, empty, executive, icon, idea, illustration, management, map, mapping, mba, model, numbers, organization, outwards, pointing, procedure, process, radial, radiating, relationship, resource, sequence, sequential, seven, square, strategy, template. The prominent colors used in the PowerPoint template are White, Gray, Black. Presenters tell us our powerpoint templates process diagram ppt Circular Flow Chart will make you look like a winner. The feedback we get is that our central PowerPoint templates and PPT Slides are Glamorous. Presenters tell us our powerpoint templates process diagram ppt Circular Flow Chart are Pleasant. You can be sure our centralized PowerPoint templates and PPT Slides are Perfect. People tell us our powerpoint templates process diagram ppt Circular Flow Chart will generate and maintain the level of interest you desire. They will create the impression you want to imprint on your audience. PowerPoint presentation experts tell us our centralized PowerPoint templates and PPT Slides are Detailed. Our PowerPoint Templates Process Diagram Ppt Circular Flow Chart can be very entertaining. Your audience will willingly lend you a ear.
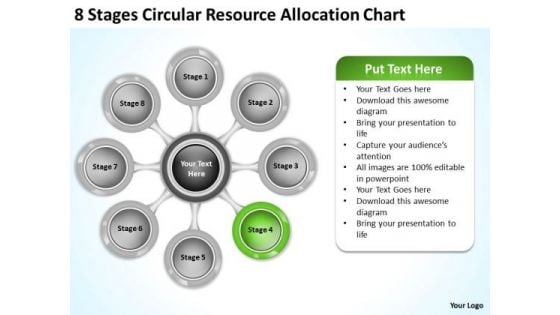
Business Planning Strategy Resource Allocation Chart Level Definition
We present our business planning strategy resource allocation chart level definition.Download and present our Process and Flows PowerPoint Templates because Our PowerPoint Templates and Slides will let you Leave a lasting impression to your audiences. They possess an inherent longstanding recall factor. Use our Circle Charts PowerPoint Templates because Our PowerPoint Templates and Slides are endowed to endure. Ideas conveyed through them will pass the test of time. Download our Ring Charts PowerPoint Templates because Our PowerPoint Templates and Slides has conjured up a web of all you need with the help of our great team. Use them to string together your glistening ideas. Download our Flow Charts PowerPoint Templates because Our PowerPoint Templates and Slides will let your words and thoughts hit bullseye everytime. Use our Marketing PowerPoint Templates because Our PowerPoint Templates and Slides are aesthetically designed to attract attention. We gaurantee that they will grab all the eyeballs you need.Use these PowerPoint slides for presentations relating to Abstract, arrows, business, central, centralized, chart, circle, circular,circulation, concept, conceptual, converging, design, diagram, eight, executive,icon, idea, illustration, management, map, mapping, mba, model, numbers,organization, outwards, pointing, procedure, process, radial, radiating,relationship, resource, sequence, sequential, square, strategy. The prominent colors used in the PowerPoint template are Green lime, Gray, White. Stop your audience's blank gaze. Get them interestedwith our Business Planning Strategy Resource Allocation Chart Level Definition. You'll deliver your best presentation yet.


 Continue with Email

 Home
Home


