Rollout Strategy
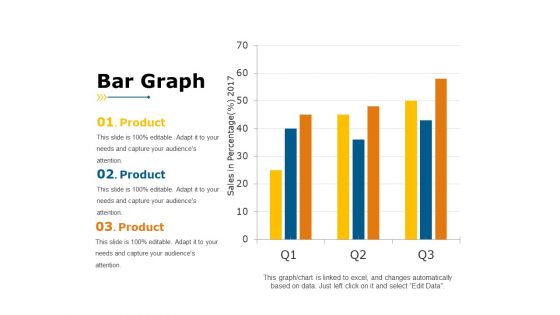
Bar Graph Ppt PowerPoint Presentation Portfolio Example
This is a bar graph ppt powerpoint presentation portfolio example. This is a three stage process. The stages in this process are sales in percentage, year, business, product, business, graph.
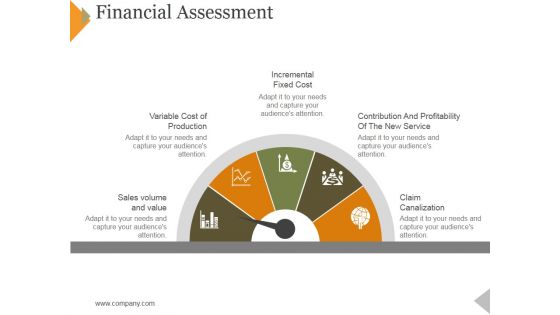
Financial Assessment Ppt PowerPoint Presentation Infographic Template Graphics Pictures
This is a financial assessment ppt powerpoint presentation infographic template graphics pictures. This is a five stage process. The stages in this process are incremental fixed cost, variable cost of production, volume and value, claim canalization.
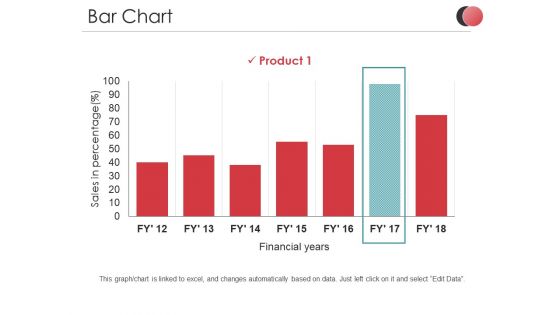
Bar Chart Ppt PowerPoint Presentation Outline Introduction
This is a bar chart ppt powerpoint presentation outline introduction. This is a one stage process. The stages in this process are sales in percentage, product, business, financial years, graph.
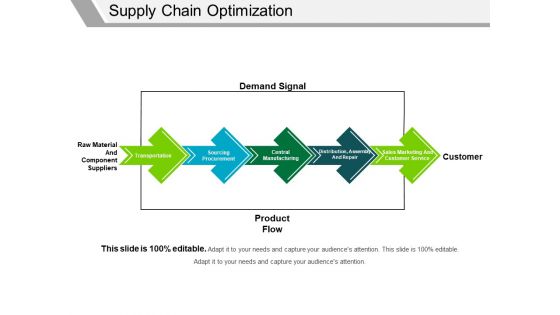
Supply Chain Optimization Template 1 Ppt PowerPoint Presentation Ideas Topics
This is a supply chain optimization template 1 ppt powerpoint presentation ideas topics. This is a five stage process. The stages in this process are demand signal, product flow, customer, transportation, sourcing procurement.
Area Chart Ppt PowerPoint Presentation Gallery Icons
This is a area chart ppt powerpoint presentation gallery icons. This is a two stage process. The stages in this process are financial year, sales in percentage, product, finance, graph.
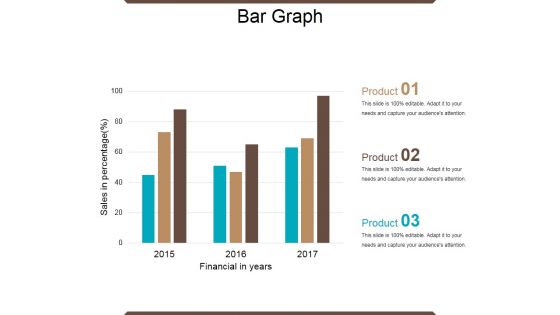
Bar Graph Ppt PowerPoint Presentation Ideas Graphic Tips
This is a bar graph ppt powerpoint presentation ideas graphic tips. This is a three stage process. The stages in this process are financial year, sales in percentage, product, bar graph, growth.
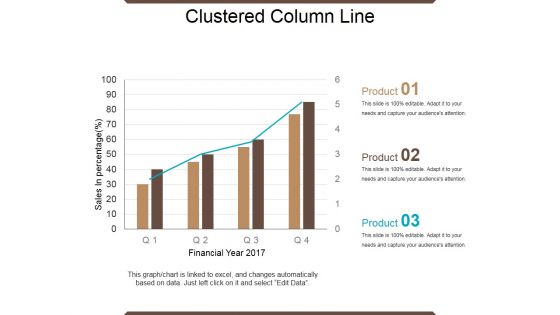
Clustered Column Line Ppt PowerPoint Presentation Show Influencers
This is a clustered column line ppt powerpoint presentation show influencers. This is a four stage process. The stages in this process are financial year, sales in percentage, product, growth, success.
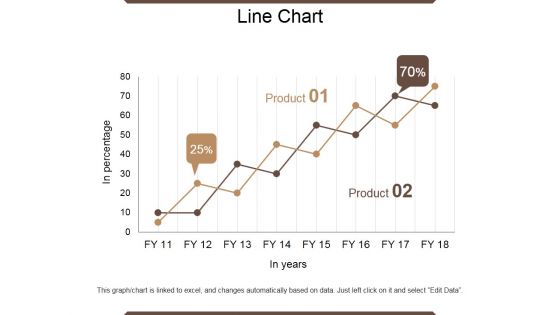
Line Chart Ppt PowerPoint Presentation Outline Infographic Template
This is a line chart ppt powerpoint presentation outline infographic template. This is a two stage process. The stages in this process are in percentage, product, in year, growth, success.
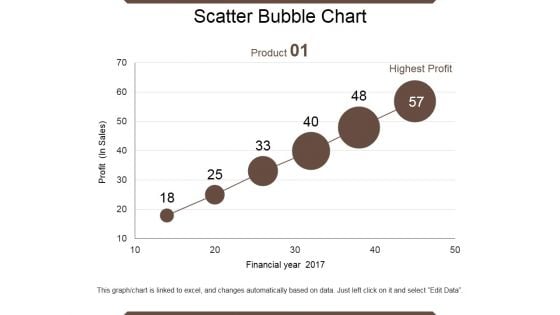
Scatter Bubble Chart Ppt PowerPoint Presentation Summary Files
This is a scatter bubble chart ppt powerpoint presentation summary files. This is a six stage process. The stages in this process are product, financial year, profit, highest profit.
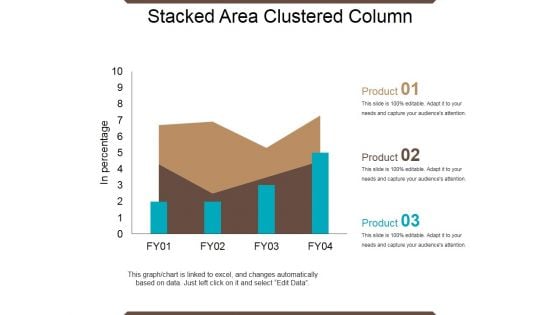
Stacked Area Clustered Column Ppt PowerPoint Presentation Show Guidelines
This is a stacked area clustered column ppt powerpoint presentation show guidelines. This is a four stage process. The stages in this process are in percentage, product, bar graph, growth, success.
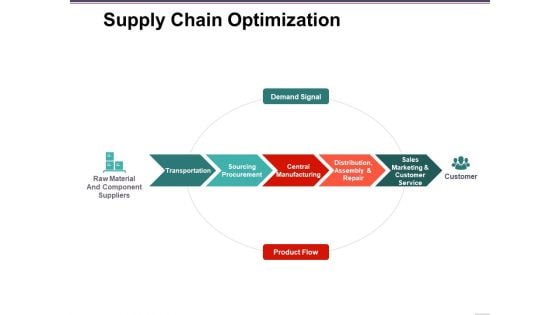
Supply Chain Optimization Template 1 Ppt PowerPoint Presentation Ideas Smartart
This is a supply chain optimization template 1 ppt powerpoint presentation ideas smartart. This is a five stage process. The stages in this process are demand signal, transportation, sourcing procurement, central manufacturing, product flow.
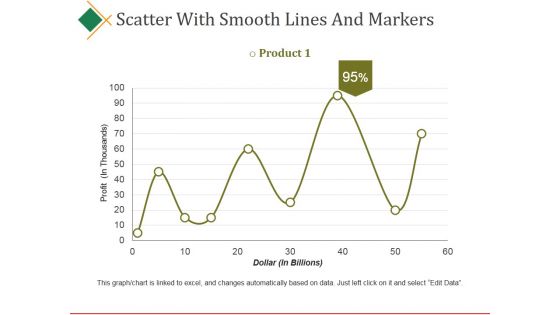
Scatter With Smooth Lines And Markers Ppt PowerPoint Presentation Visual Aids Ideas
This is a scatter with smooth lines and markers ppt powerpoint presentation visual aids ideas. This is a nine stage process. The stages in this process are product, profit, dollar, business, finance.
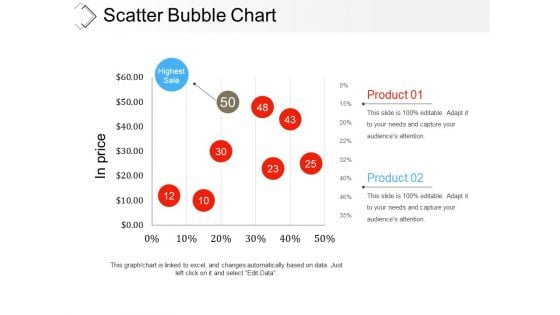
Scatter Bubble Chart Ppt PowerPoint Presentation Infographic Template Examples
This is a scatter bubble chart ppt powerpoint presentation infographic template examples. This is a two stage process. The stages in this process are highest sale, product, in price, finance, business.
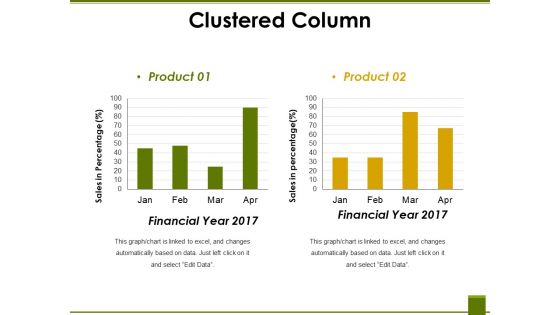
Clustered Column Ppt PowerPoint Presentation Ideas Graphic Tips
This is a clustered column ppt powerpoint presentation ideas graphic tips. This is a two stage process. The stages in this process are financial year, sales in percentage, product, graph, business.
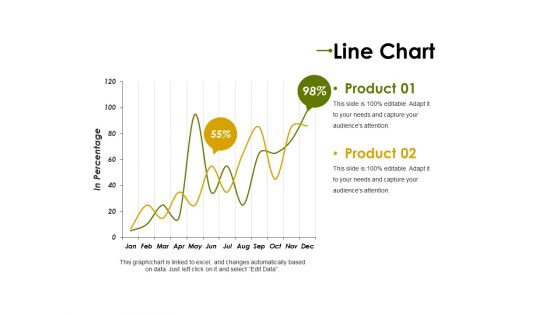
Line Chart Ppt PowerPoint Presentation Professional Clipart Images
This is a line chart ppt powerpoint presentation professional clipart images. This is a two stage process. The stages in this process are product, in percentage, graph, percentage, finance, business.
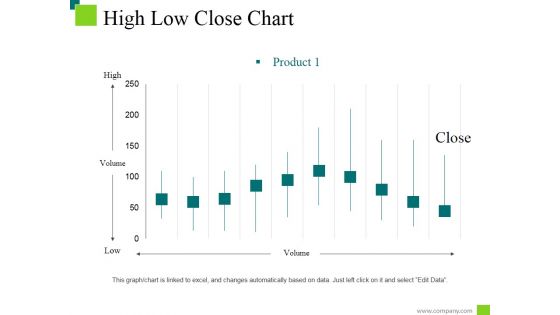
High Low Close Chart Ppt PowerPoint Presentation Styles Information
This is a high low close chart ppt powerpoint presentation styles information. This is a ten stage process. The stages in this process are low, high, product, volume, close.
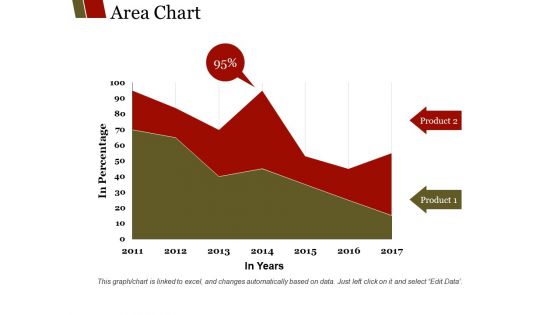
Area Chart Ppt PowerPoint Presentation Show Templates
This is a area chart ppt powerpoint presentation show templates. This is a two stage process. The stages in this process are product, in percentage, in years, finance, graph.
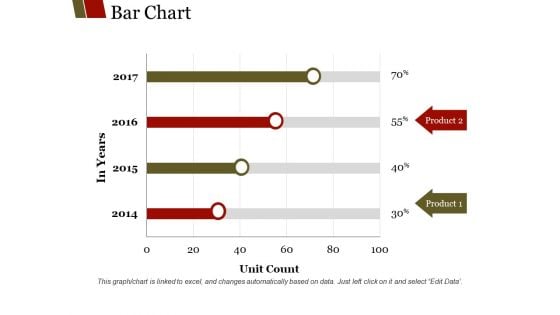
Bar Chart Ppt PowerPoint Presentation Outline Guidelines
This is a bar chart ppt powerpoint presentation outline guidelines. This is a four stage process. The stages in this process are product, unit count, in years, graph, finance, business.
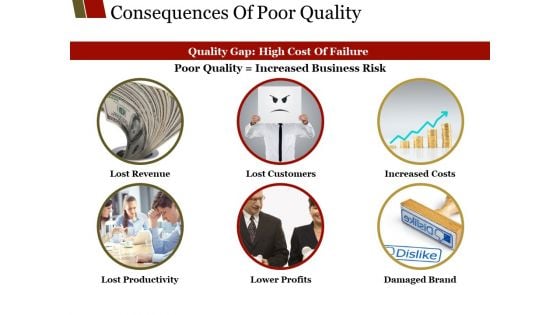
Consequences Of Poor Quality Ppt PowerPoint Presentation Portfolio Graphics Tutorials
This is a consequences of poor quality ppt powerpoint presentation portfolio graphics tutorials. This is a six stage process. The stages in this process are lost revenue, lost customers, increased costs, lower profits, lost productivity.
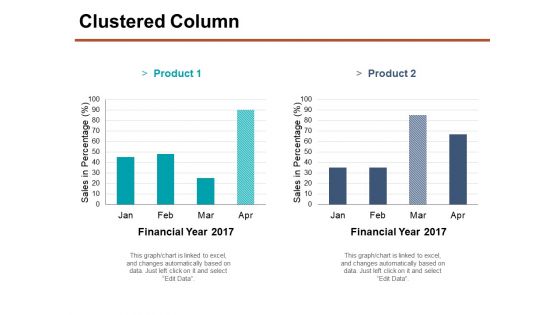
Clustered Column Ppt PowerPoint Presentation Portfolio Smartart
This is a clustered column ppt powerpoint presentation portfolio smartart. This is a two stage process. The stages in this process are financial year, product, sales in percentage, finance, business, graph.
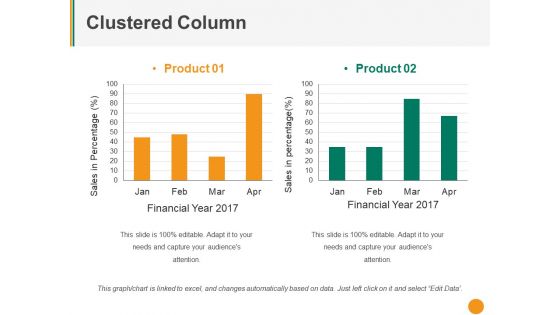
Clustered Column Ppt PowerPoint Presentation Pictures Mockup
This is a clustered column ppt powerpoint presentation pictures mockup. This is a two stage process. The stages in this process are product, sales in percentage, financial year, graph, business.
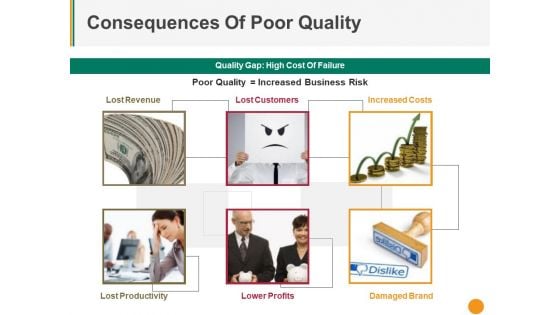
Consequences Of Poor Quality Ppt PowerPoint Presentation Gallery Layout Ideas
This is a consequences of poor quality ppt powerpoint presentation gallery layout ideas. This is a six stage process. The stages in this process are lost revenue, lost productivity, lower profits, lost customers, increased costs.
Open High Low Close Ppt PowerPoint Presentation Icon Model
This is a open high low close ppt powerpoint presentation icon model. This is a five stage process. The stages in this process are high, low, product, business, finance.
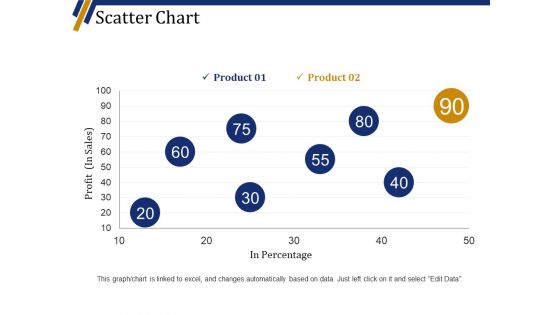
Scatter Chart Ppt PowerPoint Presentation Summary Visuals
This is a scatter chart ppt powerpoint presentation summary visuals. This is a eight stage process. The stages in this process are product, profit in sales, in percentage, finance, business.
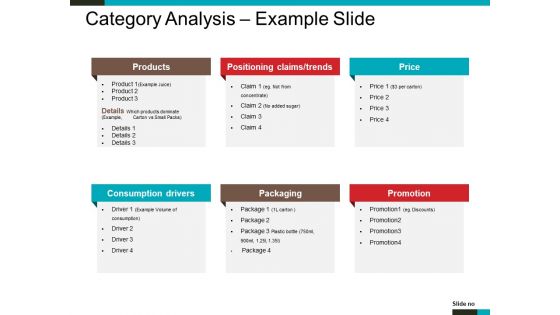
Category Analysis Example Slide Ppt PowerPoint Presentation Portfolio Slides
This is a category analysis example slide ppt powerpoint presentation portfolio slides. This is a six stage process. The stages in this process are products, consumption drivers, packaging, promotion, price.
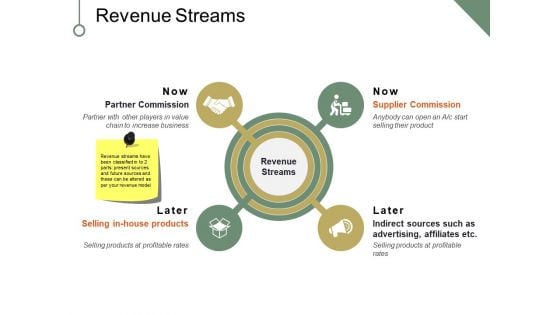
Revenue Streams Ppt PowerPoint Presentation Portfolio Maker
This is a revenue streams ppt powerpoint presentation portfolio maker. This is a four stage process. The stages in this process are partner commission, selling in house products, supplier commission, indirect sources such as advertising affiliates etc, business, icons.
Donut Pie Chart Ppt PowerPoint Presentation Icon Background Designs
This is a donut pie chart ppt powerpoint presentation icon background designs. This is a four stage process. The stages in this process are product, percentage, finance, donut, business.

Sales Kpi Performance Summary Ppt PowerPoint Presentation Ideas Graphics Template
This is a sales kpi performance summary ppt powerpoint presentation ideas graphics template. This is a seven stage process. The stages in this process are revenue comparison, quantity comparison, product sales mix, regional sales mix.
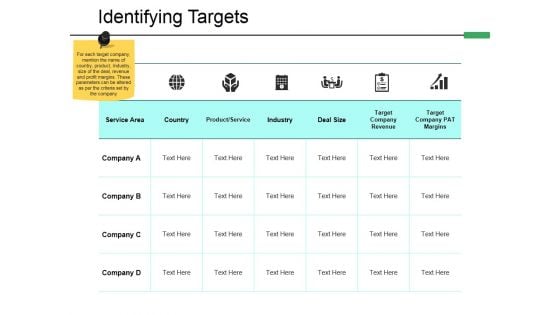
Identifying Targets Ppt PowerPoint Presentation File Templates
This is a identifying targets ppt powerpoint presentation file templates. This is a six stage process. The stages in this process are country, industry, deal size, target company revenue, product service.
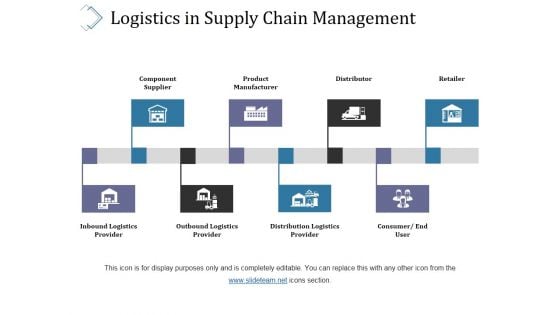
Logistics In Supply Chain Management Ppt PowerPoint Presentation Professional Information
This is a logistics in supply chain management ppt powerpoint presentation professional information. This is a eight stage process. The stages in this process are component supplier, product manufacturer, distributor, retailer.
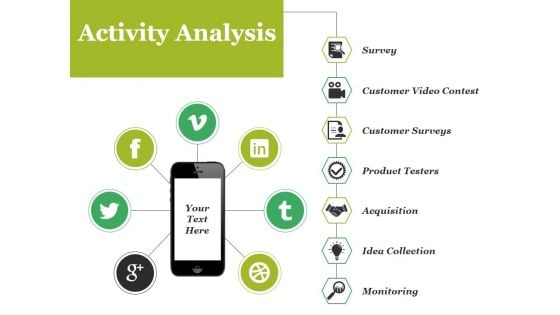
Activity Analysis Ppt PowerPoint Presentation File Design Inspiration
This is a activity analysis ppt powerpoint presentation file design inspiration. This is a seven stage process. The stages in this process are survey, customer surveys, product testers, acquisition, idea collection.
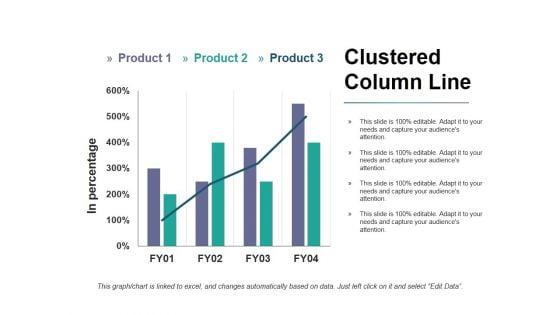
Clustered Column Line Ppt PowerPoint Presentation Infographic Template Pictures
This is a clustered column line ppt powerpoint presentation infographic template pictures. This is a three stage process. The stages in this process are product, in percentage, bar graph, growth, success.
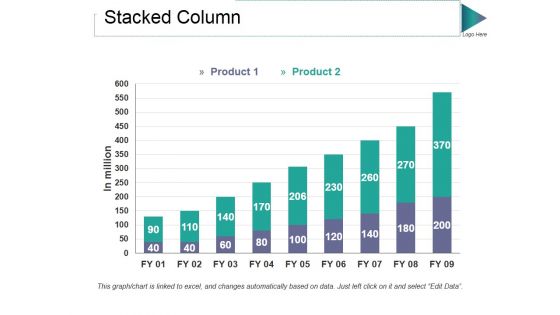
Stacked Column Ppt PowerPoint Presentation Styles Graphic Tips
This is a stacked column ppt powerpoint presentation styles graphic tips. This is a two stage process. The stages in this process are product, in million, bar graph, growth, success.
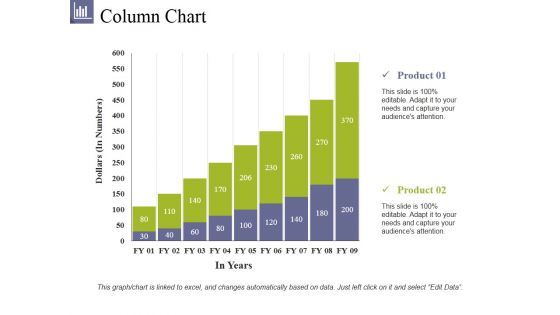
Column Chart Ppt PowerPoint Presentation File Summary
This is a column chart ppt powerpoint presentation file summary. This is a two stage process. The stages in this process are product, dollars, in years, bar graph, growth.
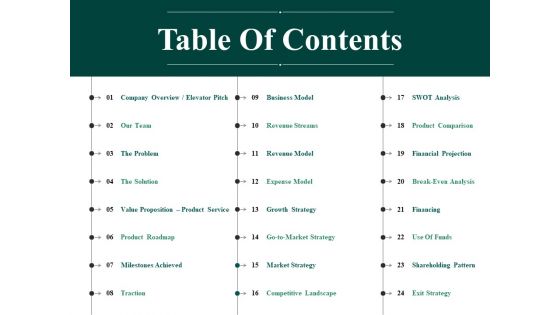
Table Of Contents Ppt PowerPoint Presentation Portfolio Graphics Pictures
This is a table of contents ppt powerpoint presentation portfolio graphics pictures. This is a three stage process. The stages in this process are our team, the problem, the solution, product roadmap, milestones achieved.
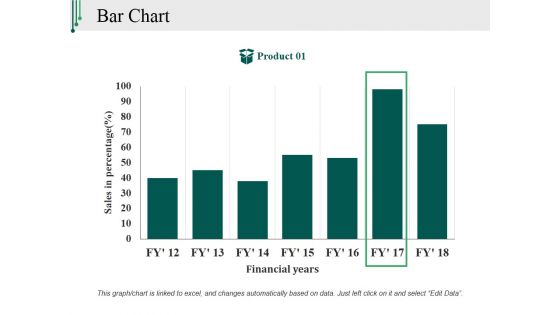
Bar Chart Ppt PowerPoint Presentation Outline Backgrounds
This is a bar chart ppt powerpoint presentation outline backgrounds. This is a one stage process. The stages in this process are sales in percentage, financial years, product, bar graph, finance.
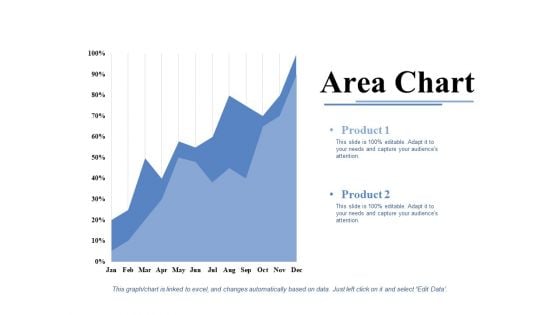
Area Chart Ppt PowerPoint Presentation Infographic Template Model
This is a area chart ppt powerpoint presentation infographic template model. This is a two stage process. The stages in this process are product, area chart, growth, percentage, success.
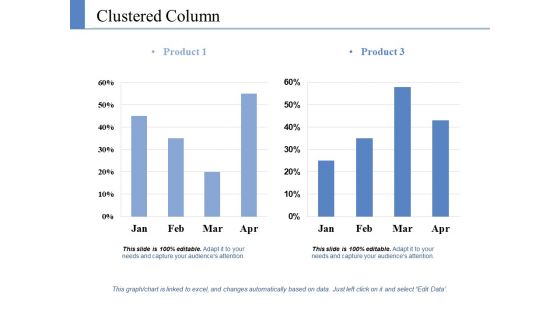
Clustered Column Ppt PowerPoint Presentation Pictures Graphics Template
This is a clustered column ppt powerpoint presentation pictures graphics template. This is a two stage process. The stages in this process are product, growth, success, business, bar graph.
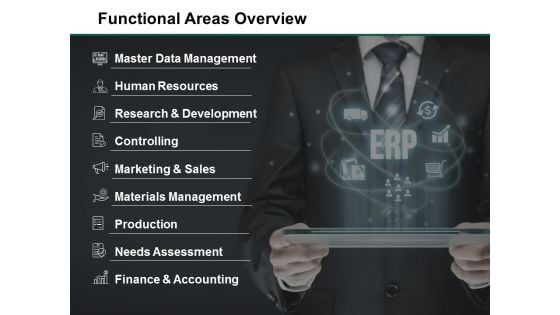
Functional Areas Overview Ppt PowerPoint Presentation Portfolio
This is a functional areas overview ppt powerpoint presentation portfolio. This is a nine stage process. The stages in this process are master data management, human resources, controlling, materials management, production.
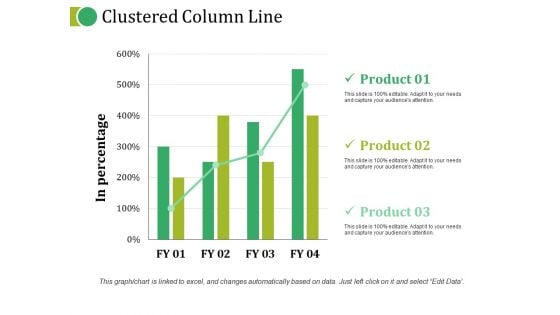
Clustered Column Line Ppt PowerPoint Presentation Topics
This is a clustered column line ppt powerpoint presentation topics. This is a three stage process. The stages in this process are product, in percentage, growth, bar graph, business.
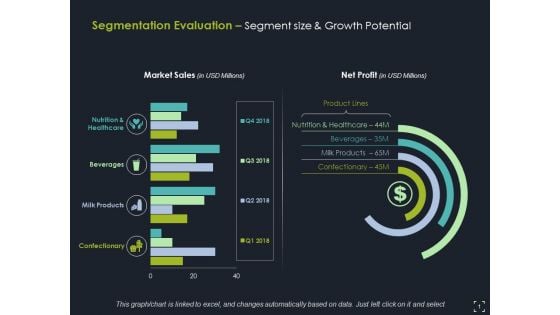
Segmentation Evaluation Segment Size And Growth Potential Ppt PowerPoint Presentation Pictures Microsoft
This is a segmentation evaluation segment size and growth potential ppt powerpoint presentation pictures microsoft. This is a four stage process. The stages in this process are nutrition and healthcare, beverages, milk products, confectionary.
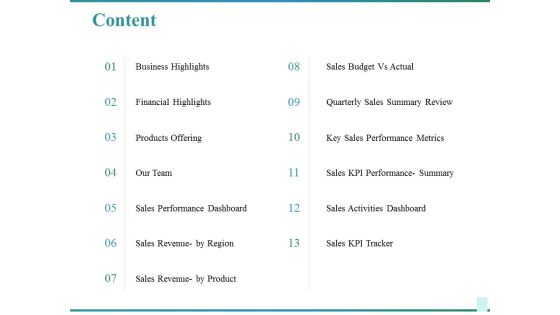
Content Ppt PowerPoint Presentation Infographics Diagrams
This is a content ppt powerpoint presentation infographics diagrams. This is a thirteen stage process. The stages in this process are business highlights, financial highlights, products offering, sales performance dashboard, sales revenue by region.
Sales Kpi Tracker Ppt PowerPoint Presentation Pictures Layout Ideas
This is a sales kpi tracker ppt powerpoint presentation pictures layout ideas. This is a four stage process. The stages in this process are opportunities won, top products in revenue, leads created, win ratio vs last yr, open deals vs.
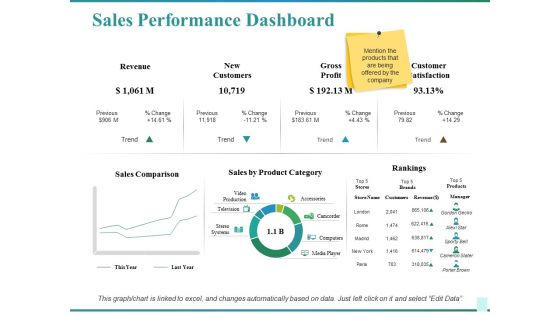
Sales Performance Dashboard Ppt PowerPoint Presentation Show Graphics Design
This is a sales performance dashboard ppt powerpoint presentation show graphics design. This is a two stage process. The stages in this process are sales comparison, sales by product category, rankings, customer satisfaction, revenue.
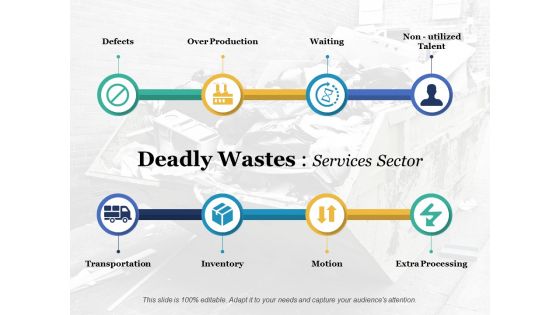
Deadly Wastes Services Sector Ppt PowerPoint Presentation Gallery Ideas
This is a deadly wastes services sector ppt powerpoint presentation gallery ideas. This is a eight stage process. The stages in this process are defects, over production, waiting, non utilized talent, transportation, inventory, motion, extra processing.
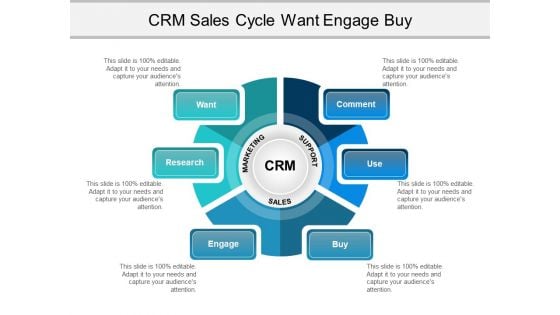
Crm Sales Cycle Want Engage Buy Ppt PowerPoint Presentation Styles Guidelines
This is a crm sales cycle want engage buy ppt powerpoint presentation styles guidelines. This is a six stage process. The stages in this process are product lifecycle, management cycle, project cycle.
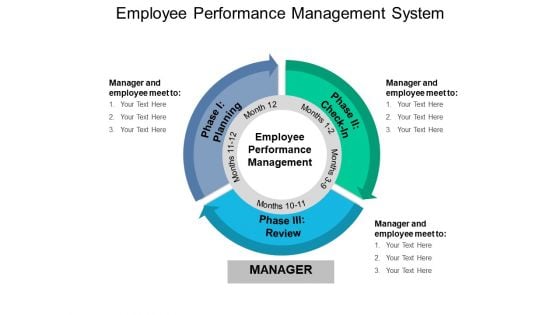
Employee Performance Management System Ppt PowerPoint Presentation Slides Images
This is a employee performance management system ppt powerpoint presentation slides images. This is a three stage process. The stages in this process are product lifecycle, management cycle, project cycle.
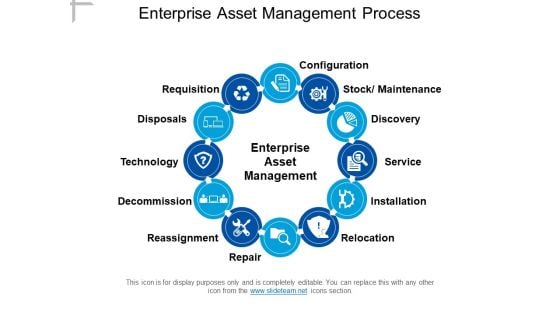
Enterprise Asset Management Process Ppt PowerPoint Presentation Gallery Themes
This is a enterprise asset management process ppt powerpoint presentation gallery themes. This is a twelve stage process. The stages in this process are product lifecycle, management cycle, project cycle.
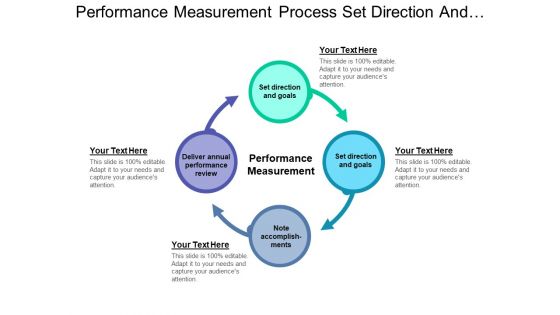
Performance Measurement Process Set Direction And Goals Ppt PowerPoint Presentation Ideas Master Slide
This is a performance measurement process set direction and goals ppt powerpoint presentation ideas master slide. This is a four stage process. The stages in this process are product lifecycle, management cycle, project cycle.
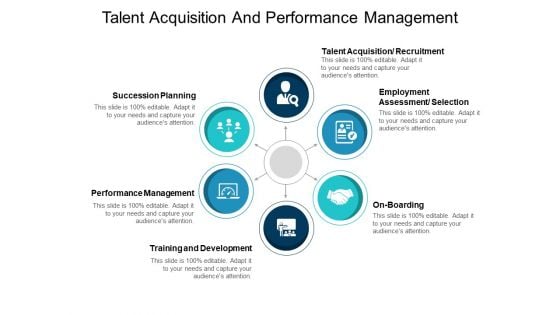
Talent Acquisition And Performance Management Ppt PowerPoint Presentation Introduction
This is a talent acquisition and performance management ppt powerpoint presentation introduction. This is a six stage process. The stages in this process are product lifecycle, management cycle, project cycle.
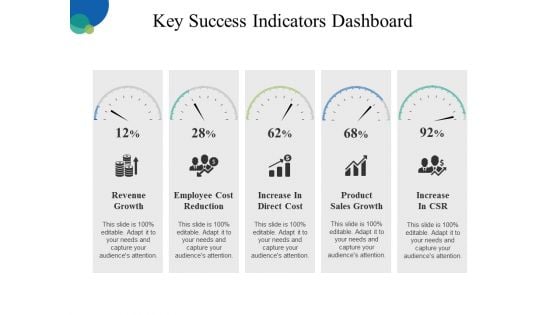
Key Success Indicators Dashboard Ppt PowerPoint Presentation Outline Slideshow
This is a key success indicators dashboard ppt powerpoint presentation outline slideshow. This is a five stage process. The stages in this process are revenue growth, employee cost reduction, increase in direct cost, product sales growth, increase in csr.
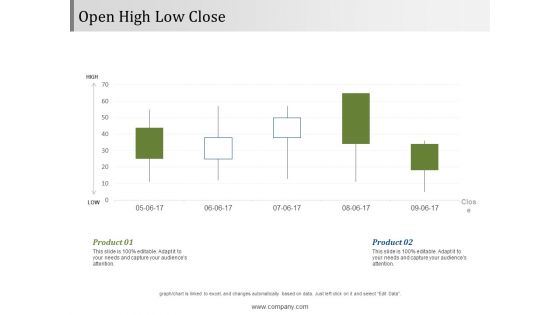
Open High Low Close Ppt PowerPoint Presentation Layouts Summary
This is a open high low close ppt powerpoint presentation layouts summary. This is a two stage process. The stages in this process are high, low, close, product, open.
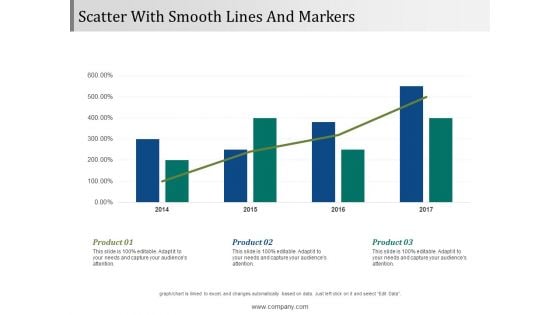
Scatter With Smooth Lines And Markers Ppt PowerPoint Presentation Pictures Deck
This is a scatter with smooth lines and markers ppt powerpoint presentation pictures deck. This is a three stage process. The stages in this process are product, finance, management, business, growth.
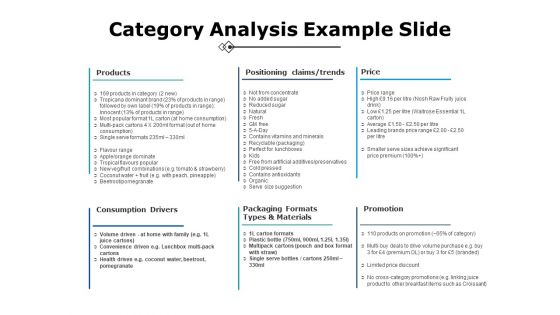
Category Analysis Example Slide Ppt PowerPoint Presentation File Infographics
This is a category analysis example slide ppt powerpoint presentation file infographics. This is a six stage process. The stages in this process are products, price, promotion, consumption drivers, positioning claims.
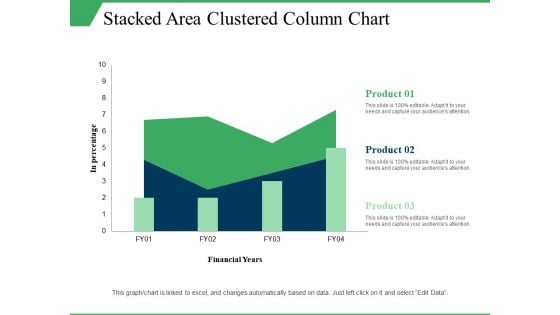
Stacked Area Clustered Column Chart Ppt PowerPoint Presentation Visual Aids Model
This is a stacked area clustered column chart ppt powerpoint presentation visual aids model. This is a three stage process. The stages in this process are in percentage, product, financial years, growth, column chart.
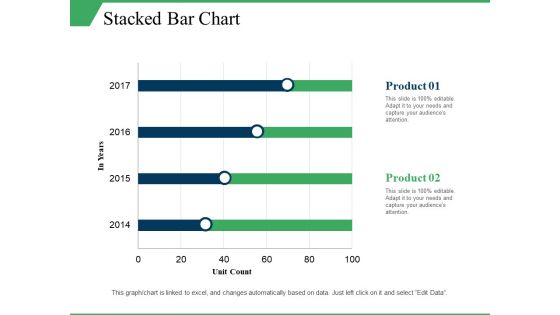
Stacked Bar Chart Ppt PowerPoint Presentation Infographics Elements
This is a stacked bar chart ppt powerpoint presentation infographics elements. This is a two stage process. The stages in this process are stacked bar chart, product, unit count, in year.
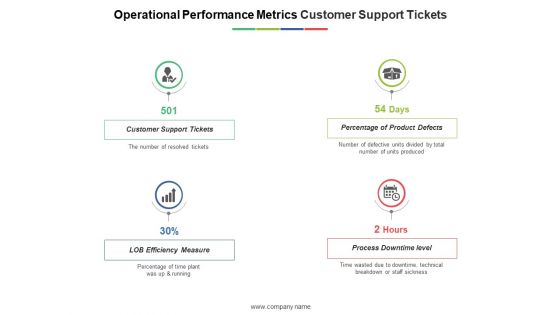
Operational Performance Metrics Customer Support Tickets Ppt PowerPoint Presentation Outline Graphics Design
This is a operational performance metrics customer support tickets ppt powerpoint presentation outline graphics design. This is a four stage process. The stages in this process are customer support tickets, percentage of product defects, lob efficiency measure, process downtime level.
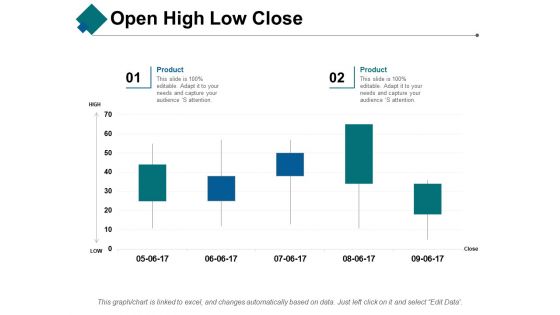
Open High Low Close Ppt PowerPoint Presentation Show Aids
This is a open high low close ppt powerpoint presentation show aids. This is a two stage process. The stages in this process are open, high, low, close, product.
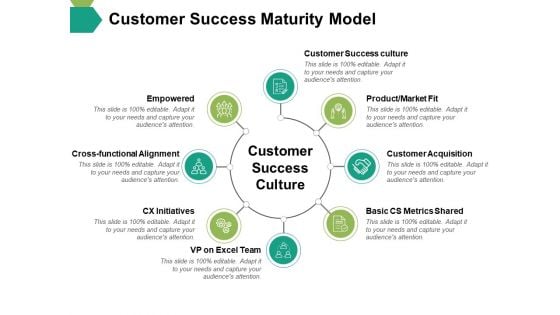
Customer Success Maturity Model Ppt PowerPoint Presentation Slides Objects
This is a customer success maturity model ppt powerpoint presentation slides objects. This is a eight stage process. The stages in this process are empowered, customer success culture, customer acquisition, product, cross functional alignment.
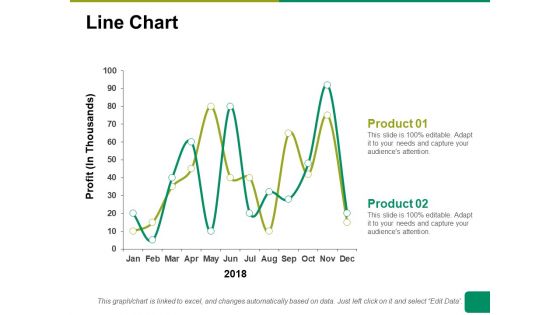
Line Chart Ppt PowerPoint Presentation Summary Ideas
This is a line chart ppt powerpoint presentation summary ideas. This is a two stage process. The stages in this process are line chart, profit, product, financial years, business.


 Continue with Email

 Home
Home


