Sales Achievement
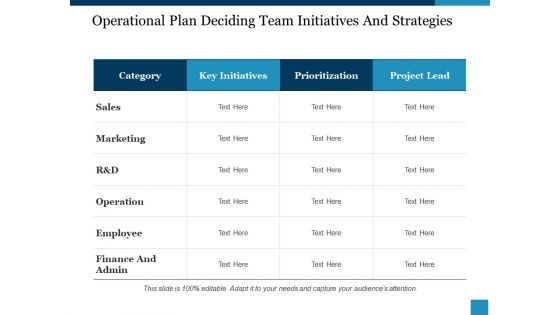
Operational Plan Deciding Team Initiatives And Strategies Ppt PowerPoint Presentation Slides Graphics Example
This is a operational plan deciding team initiatives and strategies ppt powerpoint presentation slides graphics example. This is a four stage process. The stages in this process are key initiatives, category, sales, marketing, employee.
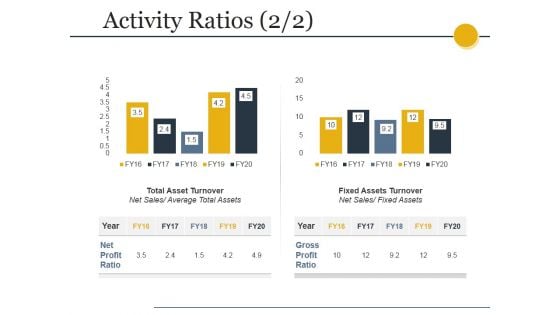
Activity Ratios Template 3 Ppt PowerPoint Presentation Professional Example
This is a activity ratios template 3 ppt powerpoint presentation professional example. This is a two stage process. The stages in this process are total asset turnover, net sales, fixed assets turnover, fixed assets.
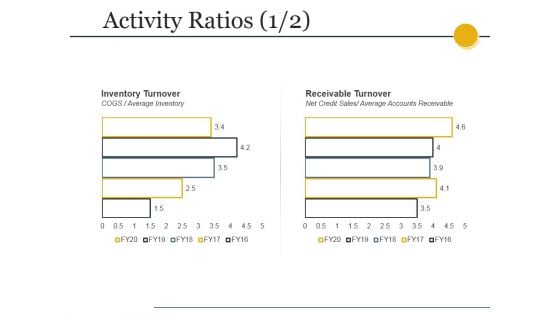
Activity Ratios Template Ppt PowerPoint Presentation Summary Slides
This is a activity ratios template ppt powerpoint presentation summary slides. This is a two stage process. The stages in this process are total asset turnover, net sales, fixed assets turnover, fixed assets.
Activity Ratios Ppt PowerPoint Presentation Icon Themes
This is a activity ratios ppt powerpoint presentation icon themes. This is a two stage process. The stages in this process are inventory turnover, cogs, average inventory, receivable turnover, net credit sales, average accounts receivable .

P And L Kpis Ppt PowerPoint Presentation Portfolio Slide
This is a p and l kpis ppt powerpoint presentation portfolio slide. This is a four stage process. The stages in this process are ebitda, profit before tax, profit after tax, expenses, net sales.
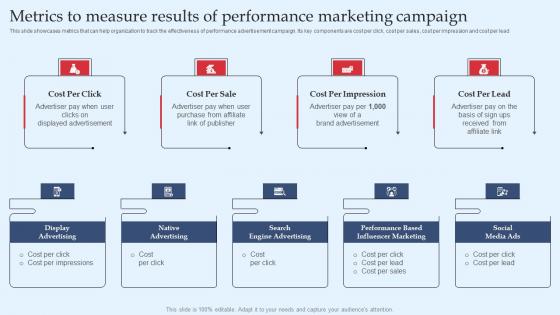
Strategic Performance Marketing Campaign Metrics To Measure Results Of Performance Themes Pdf
This slide showcases metrics that can help organization to track the effectiveness of performance advertisement campaign. Its key components are cost per click, cost per sales, cost per impression and cost per lead. Retrieve professionally designed Strategic Performance Marketing Campaign Metrics To Measure Results Of Performance Themes Pdf to effectively convey your message and captivate your listeners. Save time by selecting pre-made slideshows that are appropriate for various topics, from business to educational purposes. These themes come in many different styles, from creative to corporate, and all of them are easily adjustable and can be edited quickly. Access them as PowerPoint templates or as Google Slides themes. You do not have to go on a hunt for the perfect presentation because Slidegeeks got you covered from everywhere. This slide showcases metrics that can help organization to track the effectiveness of performance advertisement campaign. Its key components are cost per click, cost per sales, cost per impression and cost per lead.
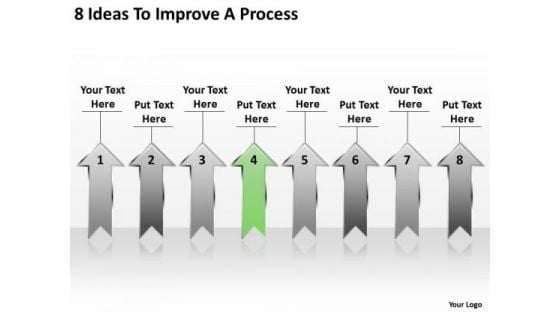
Define Parallel Processing 8 Ideas To Improve PowerPoint Templates
We present our define parallel processing 8 ideas to improve PowerPoint templates.Download our Business PowerPoint Templates because Our PowerPoint Templates and Slides will let your words and thoughts hit bullseye everytime. Use our Arrows PowerPoint Templates because It can Bubble and burst with your ideas. Present our Shapes PowerPoint Templates because Timeline crunches are a fact of life. Meet all deadlines using our PowerPoint Templates and Slides. Download and present our Success PowerPoint Templates because You can Raise a toast with our PowerPoint Templates and Slides. Spread good cheer amongst your audience. Present our Signs PowerPoint Templates because Our PowerPoint Templates and Slides help you meet the demand of the Market. Just browse and pick the slides that appeal to your intuitive senses.Use these PowerPoint slides for presentations relating to 3d, achievement, aim, arrows, business, career, chart, competition,development, direction, education, financial, forecast, forward, glossy, graph,group, growth, higher, icon, increase, investment, leader, leadership, moving,onwards, outlook, path, plan, prediction, price, profit, progress, property, race,sales, series, success, target, team, teamwork, turn, up, upwards, vector, win,winner. The prominent colors used in the PowerPoint template are Green, Gray, Black. We assure you our define parallel processing 8 ideas to improve PowerPoint templates will make the presenter successul in his career/life. PowerPoint presentation experts tell us our career PowerPoint templates and PPT Slides look good visually. The feedback we get is that our define parallel processing 8 ideas to improve PowerPoint templates are visually appealing. We assure you our development PowerPoint templates and PPT Slides will generate and maintain the level of interest you desire. They will create the impression you want to imprint on your audience. PowerPoint presentation experts tell us our define parallel processing 8 ideas to improve PowerPoint templates provide you with a vast range of viable options. Select the appropriate ones and just fill in your text. We assure you our competition PowerPoint templates and PPT Slides will generate and maintain the level of interest you desire. They will create the impression you want to imprint on your audience. Unmathed quality and quantity. Stay ahead of the game with our Define Parallel Processing 8 Ideas To Improve PowerPoint Templates. You'll always stay ahead of the game.
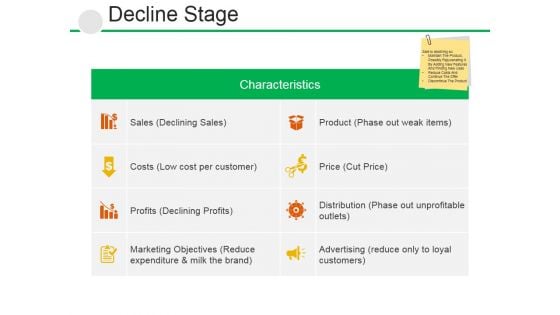
Decline Stage Ppt PowerPoint Presentation File Template
This is a decline stage ppt powerpoint presentation file template. This is a eight stage process. The stages in this process are costs, sales, profits, product, price, distribution, marketing objectives.
Short Term And Long Term Planning Icons Ppt PowerPoint Presentation Portfolio Icons
This is a short term and long term planning icons ppt powerpoint presentation portfolio icons. This is a two stage process. The stages in this process are business, management, strategy, marketing, sales.
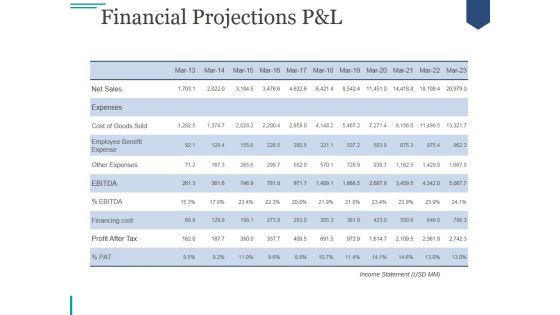
Financial Projections Pand L Ppt PowerPoint Presentation Template
This is a financial projections pand l ppt powerpoint presentation template. This is a eleven stage process. The stages in this process are net sales, expenses, cost of goods sold, employee benefit expense, other expenses, financing cost.
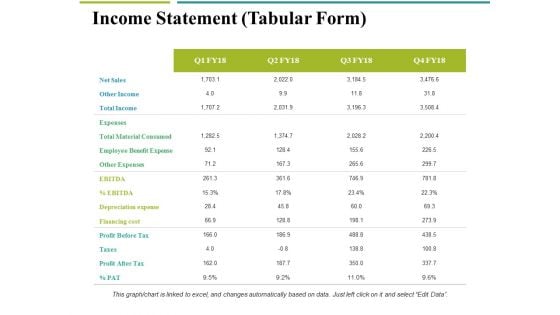
Income Statement Tabular Form Ppt PowerPoint Presentation Inspiration Examples
This is a income statement tabular form ppt powerpoint presentation inspiration examples. This is a four stage process. The stages in this process are net sales, other income, total income, expenses, total material consumed.
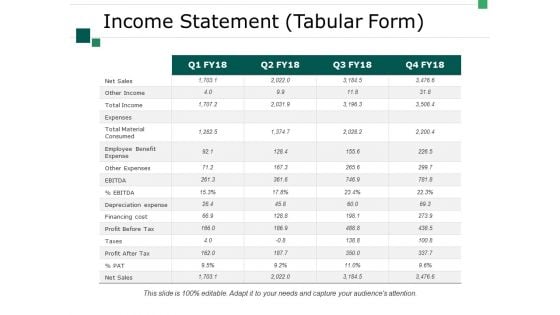
Income Statement Tabular Form Ppt PowerPoint Presentation Model Show
This is a income statement tabular form ppt powerpoint presentation model show. This is a four stage process. The stages in this process are business, marketing, net sales, other income, total income.
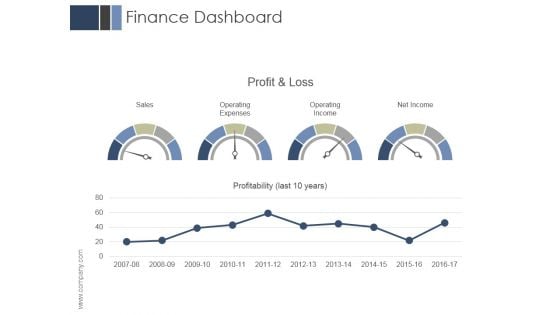
Finance Dashboard Ppt PowerPoint Presentation Design Ideas
This is a finance dashboard ppt powerpoint presentation design ideas. This is a two stage process. The stages in this process are sales, operating expenses, operating income, net income.
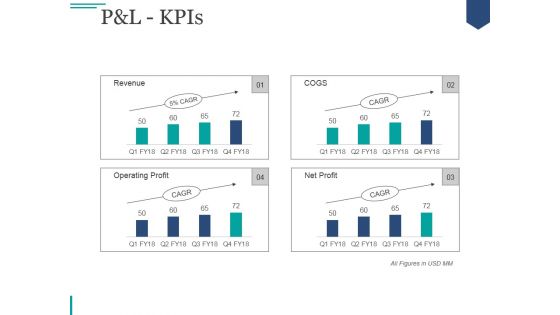
Pandl Kpis Ppt PowerPoint Presentation Deck
This is a pandl kpis ppt powerpoint presentation deck. This is a four stage process. The stages in this process are net sales, other income, total income, expenses, total material consumed.
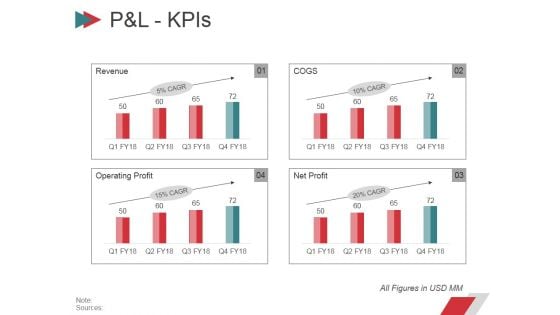
Pandl Kpis Ppt PowerPoint Presentation Gallery Slides
This is a pandl kpis ppt powerpoint presentation gallery slides. This is a four stage process. The stages in this process are net sales, other income, total income, expenses, total material consumed.
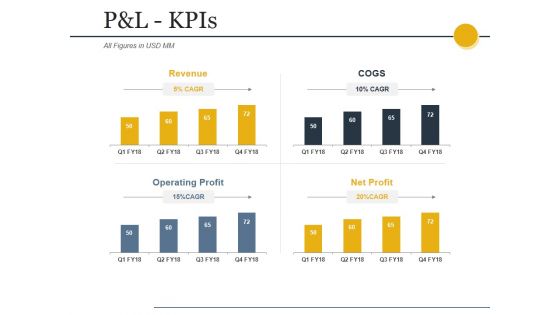
Pandl Kpis Ppt PowerPoint Presentation Infographic Template Layout
This is a pandl kpis ppt powerpoint presentation infographic template layout. This is a four stage process. The stages in this process are net sales, other income, total income, expenses, total material consumed.
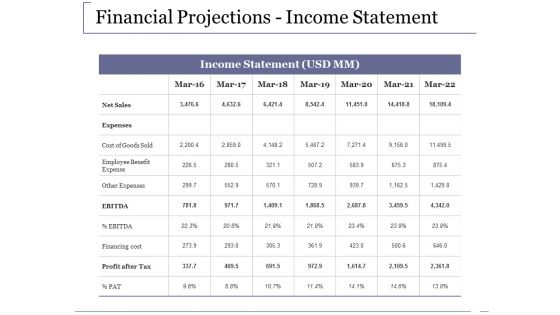
Financial Projections Income Statement Ppt PowerPoint Presentation Inspiration Design Templates
This is a financial projections income statement ppt powerpoint presentation inspiration design templates. This is a seven stage process. The stages in this process are net sales, expenses, cost of goods sold, employee benefit expense, other expenses.

Financial Projections Income Statement Ppt PowerPoint Presentation Pictures Design Inspiration
This is a financial projections income statement ppt powerpoint presentation pictures design inspiration. This is a one stage process. The stages in this process are business, net sales, expenses, cost of goods sold, employee benefit expense, other expenses, financing cost.
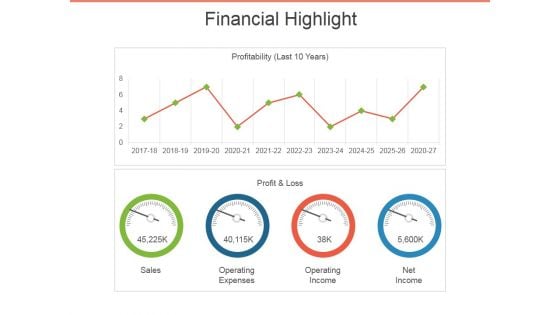
Financial Highlight Template 2 Ppt PowerPoint Presentation Outline Visuals
This is a financial highlight template 2 ppt powerpoint presentation outline visuals. This is a two stage process. The stages in this process are sales, profit and loss, operating expenses, operating income, net income.
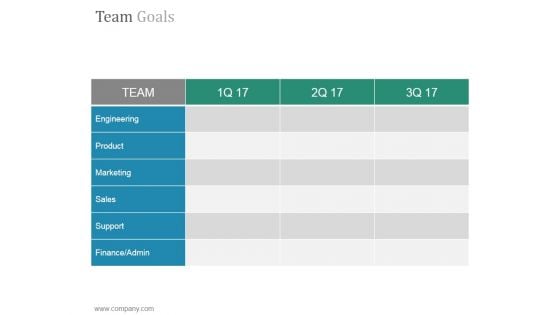
Team Goals Slide Ppt PowerPoint Presentation Tips
This is a team goals slide ppt powerpoint presentation tips. This is a six stage process. The stages in this process are engineering, product, marketing, sales, support, finance admin.
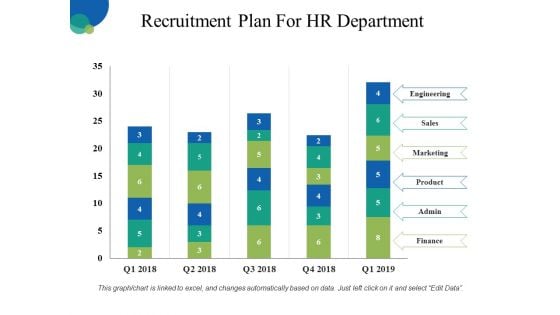
Recruitment Plan For HR Department Ppt PowerPoint Presentation Inspiration Layout Ideas
This is a recruitment plan for hr department ppt powerpoint presentation inspiration layout ideas. This is a five stage process. The stages in this process are engineering, sales, marketing, product, finance.
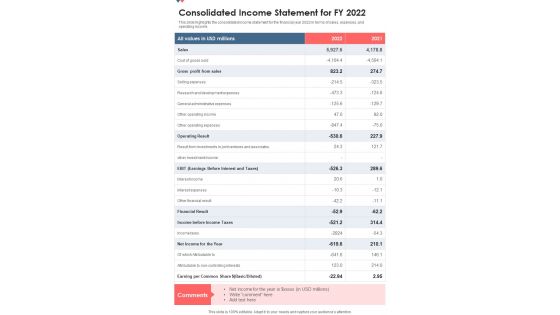
Consolidated Income Statement For FY 2022 Template 214 One Pager Documents
This slide highlights the consolidated income statement for the financial year 2022 in terms of sales, expenses, and operating income. Presenting you a fantastic Consolidated Income Statement For FY 2022 Template 214 One Pager Documents. This piece is crafted on hours of research and professional design efforts to ensure you have the best resource. It is completely editable and its design allow you to rehash its elements to suit your needs. Get this Consolidated Income Statement For FY 2022 Template 214 One Pager Documents A4 One-pager now.
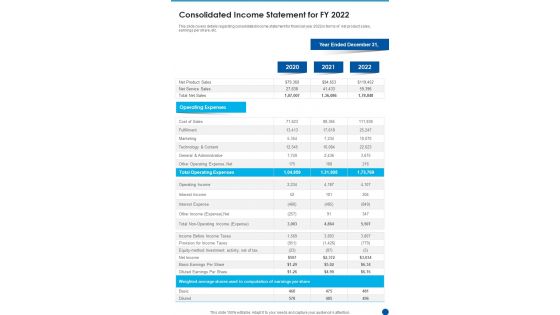
Consolidated Income Statement For FY 2022 Template 155 One Pager Documents
This slide covers details regarding consolidated income statement for financial year 2022 in terms of net product sales, earnings per share, etc. Presenting you an exemplary Consolidated Income Statement For FY 2022 Template 155 One Pager Documents. Our one-pager comprises all the must-have essentials of an inclusive document. You can edit it with ease, as its layout is completely editable. With such freedom, you can tweak its design and other elements to your requirements. Download this Consolidated Income Statement For FY 2022 Template 155 One Pager Documents brilliant piece now.
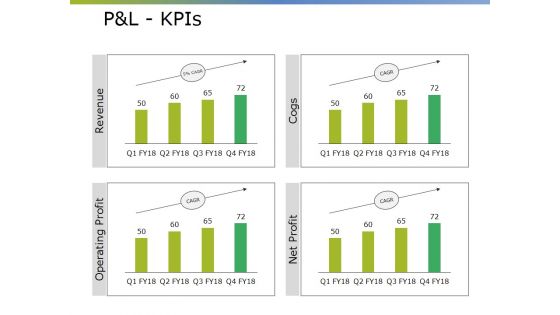
Pandl Kpis Ppt PowerPoint Presentation Gallery Display
This is a pandl kpis ppt powerpoint presentation gallery display. This is a four stage process. The stages in this process are net sales, total income, expenses, ebitda, profit after tax.
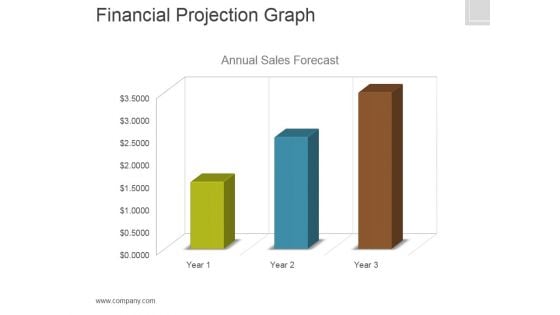
Financial Projection Graph Template 1 Ppt PowerPoint Presentation Clipart
This is a financial projection graph template 1 ppt powerpoint presentation clipart. This is a three stage process. The stages in this process are annual, sales, forecast, finance, marketing.
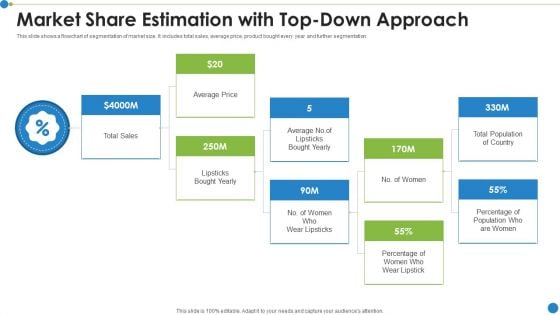
Market Share Estimation With Top Down Approach Ppt PowerPoint Presentation Gallery Design Templates PDF
This slide shows a flowchart of segmentation of market size. It includes total sales, average price, product bought every year and further segmentation. Showcasing this set of slides titled market share estimation with top down approach ppt powerpoint presentation gallery design templates pdf. The topics addressed in these templates are average price, sales. All the content presented in this PPT design is completely editable. Download it and make adjustments in color, background, font etc. as per your unique business setting.
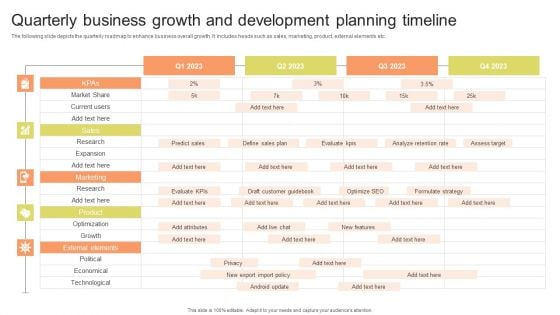
Quarterly Business Growth And Development Planning Timeline Background PDF
The following slide depicts the quarterly roadmap to enhance business overall growth. It includes heads such as sales, marketing, product, external elements etc. Pitch your topic with ease and precision using this Quarterly Business Growth And Development Planning Timeline Background PDF. This layout presents information on Predict Sales, Assess Target, Formulate Strategy. It is also available for immediate download and adjustment. So, changes can be made in the color, design, graphics or any other component to create a unique layout.

Integrate Search Engine Optimization Objectives And Key Result Methodology For Business
The following slide represents search engine optimization SEO plan to enhance website visibility and optimize ranking. It includes elements such as increasing brand awareness, optimizing user engagement, improving sales, tactics, impact etc. Formulating a presentation can take up a lot of effort and time, so the content and message should always be the primary focus. The visuals of the PowerPoint can enhance the presenters message, so our Integrate Search Engine Optimization Objectives And Key Result Methodology For Business was created to help save time. Instead of worrying about the design, the presenter can concentrate on the message while our designers work on creating the ideal templates for whatever situation is needed. Slidegeeks has experts for everything from amazing designs to valuable content, we have put everything into Integrate Search Engine Optimization Objectives And Key Result Methodology For Business The following slide represents search engine optimization SEO plan to enhance website visibility and optimize ranking. It includes elements such as increasing brand awareness, optimizing user engagement, improving sales, tactics, impact etc.
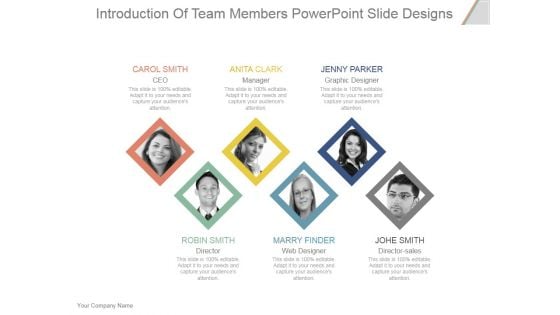
Introduction Of Team Members Ppt PowerPoint Presentation Show
This is a introduction of team members ppt powerpoint presentation show. This is a six stage process. The stages in this process are ceo, manager, graphic designer, director, web designer, director sales.
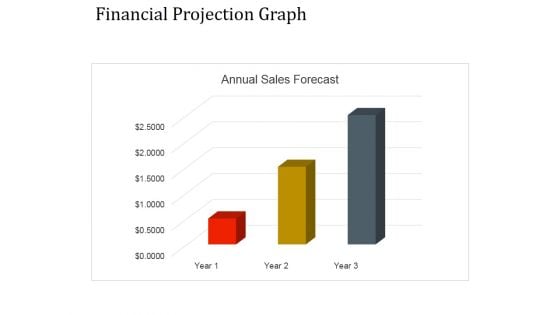
Financial Projection Graph Template 1 Ppt PowerPoint Presentation Graphics
This is a financial projection graph template 1 ppt powerpoint presentation graphics. This is a three stage process. The stages in this process are annual sales, business, management, marketing, strategy.
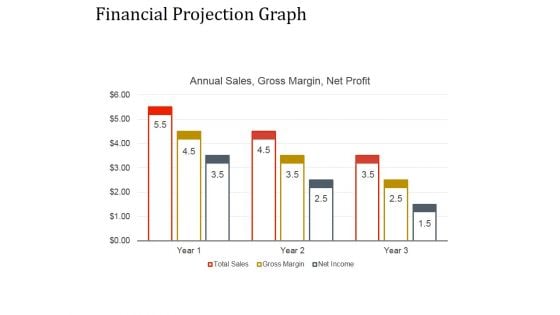
Financial Projection Graph Template 2 Ppt PowerPoint Presentation Ideas
This is a financial projection graph template 2 ppt powerpoint presentation ideas. This is a nine stage process. The stages in this process are annual sales, business, management, marketing, strategy.
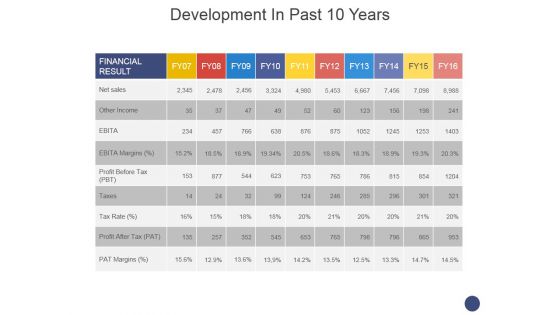
Development In Past 10 Years Template 2 Ppt PowerPoint Presentation Professional Topics
This is a development in past 10 years template 2 ppt powerpoint presentation professional topics. This is a ten stage process. The stages in this process are net sales, other income, ebita, ebita margins, profit before tax, taxes.

About Us Ppt PowerPoint Presentation Outline Design Ideas
This is a about us ppt powerpoint presentation outline design ideas. This is a four stage process. The stages in this process are ceo and founder, director of sales, managing director, assistant.
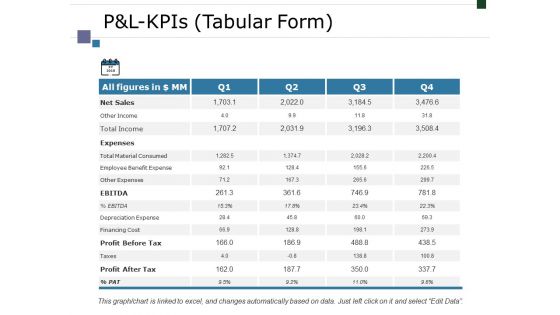
Pandl Kpis Tabular Form Ppt PowerPoint Presentation Outline Background
This is a pandl kpis tabular form ppt powerpoint presentation outline background. This is a four stage process. The stages in this process are net sales, expenses, ebitda, profit before tax, profit after tax.
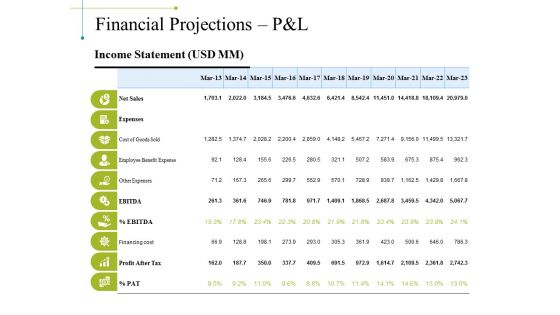
Financial Projections Pandl Ppt PowerPoint Presentation Outline Grid
This is a financial projections pandl ppt powerpoint presentation outline grid. This is a ten stage process. The stages in this process are net sales, expenses, cost of goods sold, other expenses, financing cost.
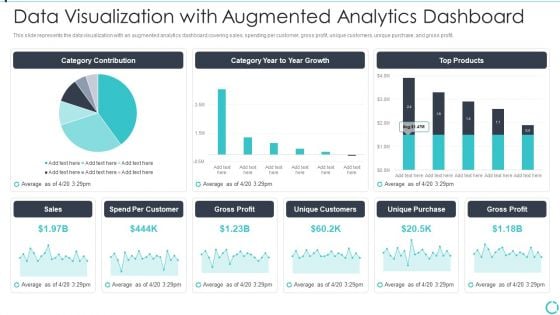
Augmented Analytics Implementation IT Data Visualization With Augmented Analytics Microsoft PDF
This slide represents the data visualization with an augmented analytics dashboard covering sales, spending per customer, gross profit, unique customers, unique purchase, and gross profit. Deliver an awe inspiring pitch with this creative Augmented Analytics Implementation IT Data Visualization With Augmented Analytics Microsoft PDF bundle. Topics like Category Contribution, Category Year To Year Growth, Top Products, Sales, Gross Profit can be discussed with this completely editable template. It is available for immediate download depending on the needs and requirements of the user.
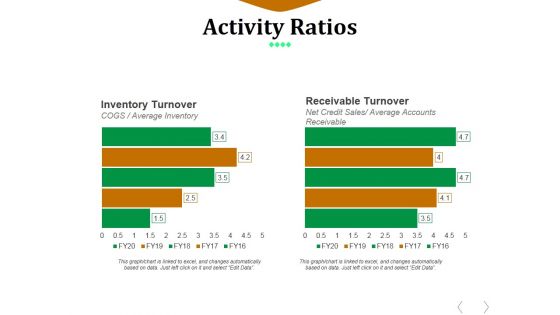
Activity Ratios Template 2 Ppt PowerPoint Presentation Summary Display
This is a activity ratios template 2 ppt powerpoint presentation summary display. This is a two stage process. The stages in this process are inventory turnover, receivable turnover, net credit sales, average accounts receivable.
Activity Ratios Template 3 Ppt PowerPoint Presentation Icon Demonstration
This is a activity ratios template 3 ppt powerpoint presentation icon demonstration. This is a two stage process. The stages in this process are total asset turnover, fixed assets turnover, net sales, fixed assets.

Activity Ratios Template 4 Ppt PowerPoint Presentation Pictures Example File
This is a activity ratios template 4 ppt powerpoint presentation pictures example file. This is a two stage process. The stages in this process are total asset turnover, fixed assets turnover, net sales, fixed assets.
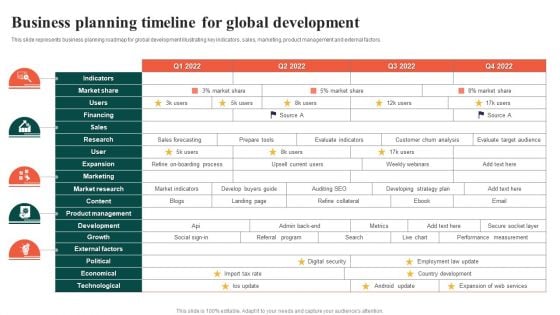
Business Planning Timeline For Global Development Ppt Layouts Introduction PDF
This slide represents business planning roadmap for global development illustrating key indicators, sales, marketing, product management and external factors. Showcasing this set of slides titled Business Planning Timeline For Global Development Ppt Layouts Introduction PDF. The topics addressed in these templates are Market Share, Research, Sales. All the content presented in this PPT design is completely editable. Download it and make adjustments in color, background, font etc. as per your unique business setting.
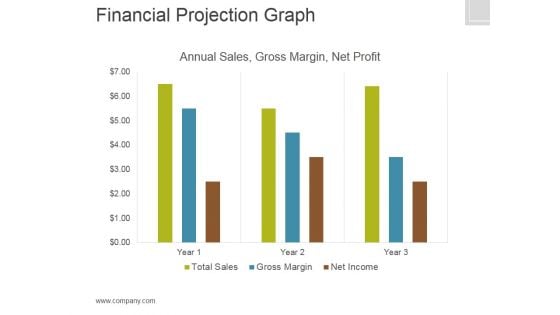
Financial Projection Graph Template 2 Ppt PowerPoint Presentation Graphics
This is a financial projection graph template 2 ppt powerpoint presentation graphics. This is a three stage process. The stages in this process are annual sales, gross margin, net profit, finance.
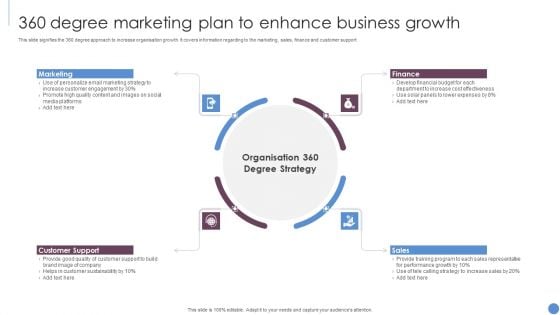
360 Degree Marketing Plan To Enhance Business Growth Guidelines PDF
This slide signifies the 360 degree approach to increase organisation growth. It covers information regarding to the marketing, sales, finance and customer support. Presenting 360 Degree Marketing Plan To Enhance Business Growth Guidelines PDF to dispense important information. This template comprises four stages. It also presents valuable insights into the topics including Marketing, Finance, Sales, Customer Support. This is a completely customizable PowerPoint theme that can be put to use immediately. So, download it and address the topic impactfully.

About Us Ppt PowerPoint Presentation Background Image
This is a about us ppt powerpoint presentation background image. This is a three stage process. The stages in this process are product manager, finance manager, director of sales.
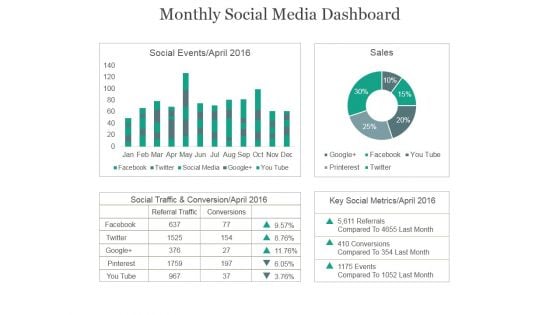
Monthly Social Media Dashboard Ppt PowerPoint Presentation Example 2015
This is a monthly social media dashboard ppt powerpoint presentation example 2015. This is a four stage process. The stages in this process are social events, sales, social traffic, conservation, key social metrics.
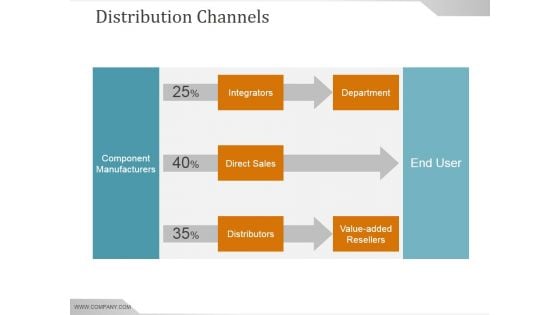
Distribution Channels Ppt PowerPoint Presentation Graphics
This is a distribution channels ppt powerpoint presentation graphics. This is a three stage process. The stages in this process are integrators, direct sales, distributors, value added, resellers, department, component manufacturers, end user.

Financial Projection Graph Template 1 Ppt PowerPoint Presentation Guide
This is a financial projection graph template 1 ppt powerpoint presentation guide. This is a three stage process. The stages in this process are annual sales, gross margin, net profit.
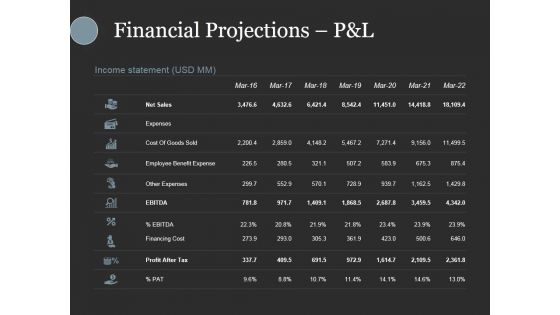
Financial Projections Pandl Ppt PowerPoint Presentation Slides Show
This is a financial projections pandl ppt powerpoint presentation slides show. This is a seven stage process. The stages in this process are net sales, expenses, cost of goods sold, employee benefit expense, other expenses.
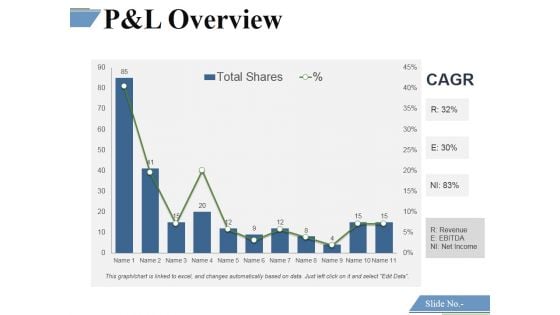
P And L Overview Template 3 Ppt PowerPoint Presentation Model Gridlines
This is a p and l overview template 3 ppt powerpoint presentation model gridlines. This is a eleven stage process. The stages in this process are financing cost, net sales, profit before tax, profit after tax.
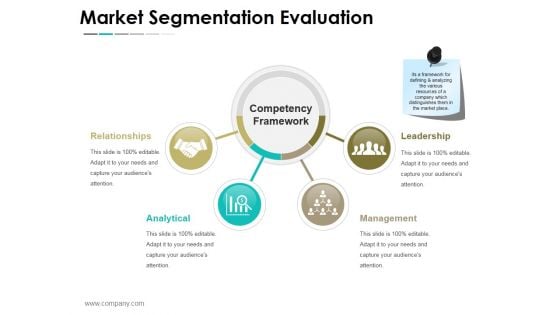
Market Segmentation Evaluation Ppt PowerPoint Presentation Layouts Images
This is a market segmentation evaluation ppt powerpoint presentation layouts images. This is a two stage process. The stages in this process are market sales, net profit, confectionary, milk products, beverages, nutrition and health care.
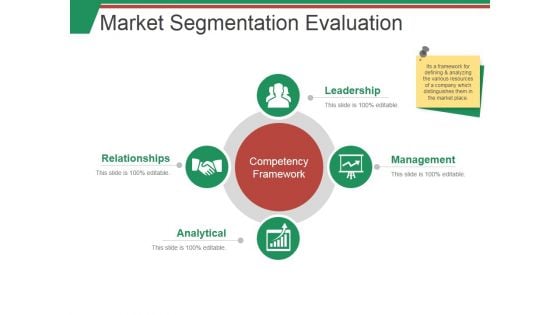
Market Segmentation Evaluation Template 1 Ppt PowerPoint Presentation Summary Smartart
This is a market segmentation evaluation template 1 ppt powerpoint presentation summary smartart. This is a two stage process. The stages in this process are market sales, net profit, beverages, milk product, nutrition.
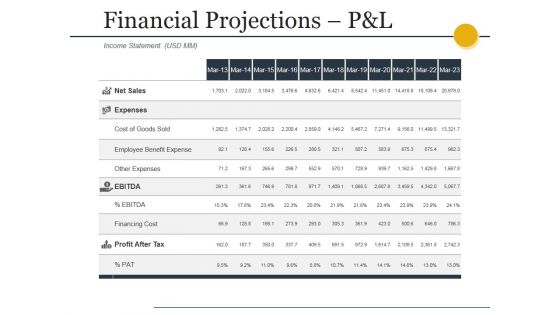
Financial Projections Pandl Ppt PowerPoint Presentation Styles Gallery
This is a financial projections pandl ppt powerpoint presentation styles gallery. This is a eleven stage process. The stages in this process are net sales, expenses, cost of goods sold, employee benefit expense, other expenses.
Financial Summary Ppt PowerPoint Presentation Icon Pictures
This is a financial summary ppt powerpoint presentation icon pictures. This is a seven stage process. The stages in this process are net sales, expenses, ebitda, profit after tax.
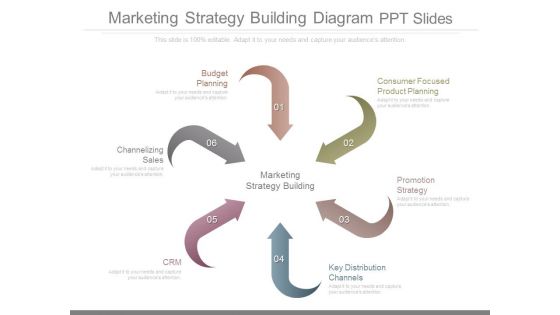
Marketing Strategy Building Diagram Ppt Slides
This is a marketing strategy building diagram ppt slides. This is a six stage process. The stages in this process are budget planning, consumer focused product planning, promotion strategy, key distribution channels, crm, channelizing sales.
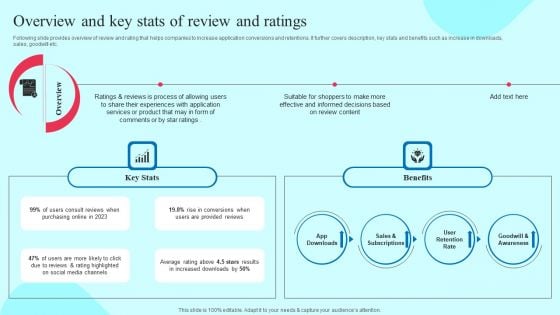
Smartphone Application User Acquisition Techniques Overview And Key Stats Of Review And Ratings Template PDF
Following slide provides overview of review and rating that helps companies to increase application conversions and retentions. It further covers description, key stats and benefits such as increase in downloads, sales, goodwill etc. Explore a selection of the finest Smartphone Application User Acquisition Techniques Overview And Key Stats Of Review And Ratings Template PDF here. With a plethora of professionally designed and pre made slide templates, you can quickly and easily find the right one for your upcoming presentation. You can use our Smartphone Application User Acquisition Techniques Overview And Key Stats Of Review And Ratings Template PDF to effectively convey your message to a wider audience. Slidegeeks has done a lot of research before preparing these presentation templates. The content can be personalized and the slides are highly editable. Grab templates today from Slidegeeks.

The Core Team Ppt PowerPoint Presentation Visual Aids
This is a the core team ppt powerpoint presentation visual aids. This is a four stage process. The stages in this process are ceo, director of sales, director, managing director.

Our Team Ppt PowerPoint Presentation Deck
This is a our team ppt powerpoint presentation deck. This is a four stage process. The stages in this process are director of sales, ceo and founder, production manager, finance manager .
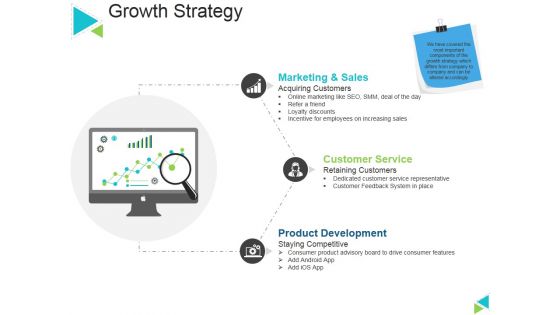
Growth Strategy Ppt PowerPoint Presentation Ideas Graphic Images
This is a growth strategy ppt powerpoint presentation ideas graphic images. This is a three stage process. The stages in this process are marketing and sales, customer service, product development, acquiring customers, staying competitive.
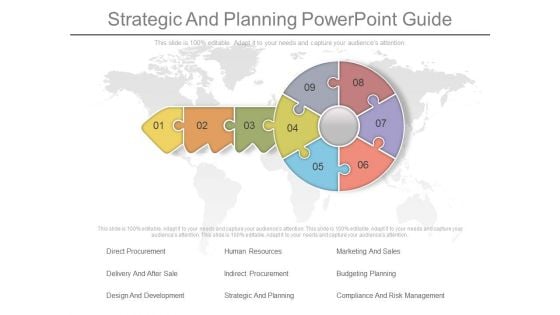
Strategic And Planning Powerpoint Guide
This is a strategic and planning powerpoint guide. This is a nine stage process. The stages in this process are direct procurement, human resources, marketing and sales, delivery and after sale, indirect procurement, budgeting planning, design and development, strategic and planning, compliance and risk management.
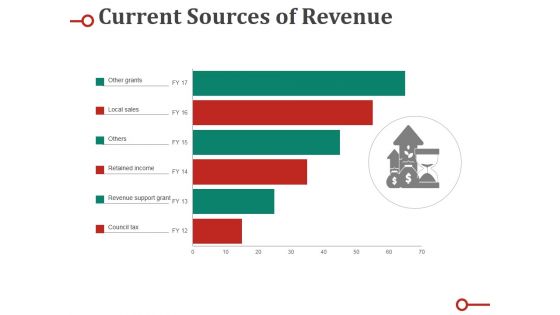
Current Sources Of Revenue Ppt PowerPoint Presentation Pictures Skills
This is a current sources of revenue ppt powerpoint presentation pictures skills. This is a six stage process. The stages in this process are other grants, local sales, others, retained income, revenue support grant.
Pandl Kpis Tabular Form Ppt PowerPoint Presentation Icon
This is a pandl kpis tabular form ppt powerpoint presentation icon. This is a four stage process. The stages in this process are business, net sales, total income, expenses, profit before tax, profit after tax.


 Continue with Email

 Home
Home


