Sales Budget
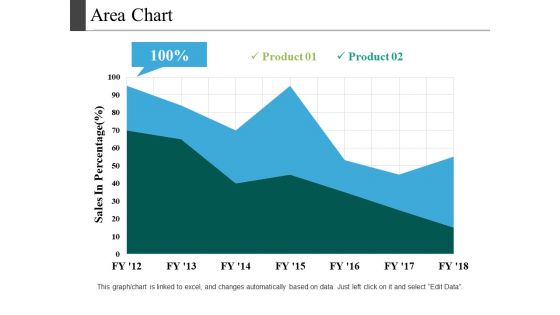
Area Chart Ppt PowerPoint Presentation Pictures Template
This is a area chart ppt powerpoint presentation pictures template. This is a two stage process. The stages in this process are sales in percentage, chart, business, marketing, strategy.
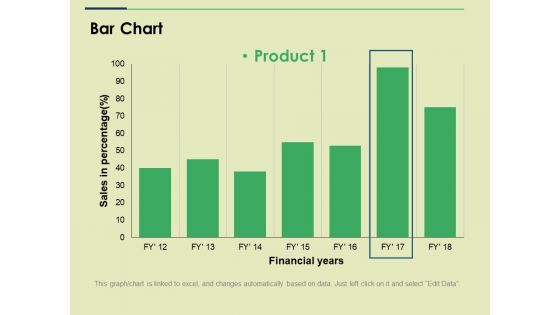
Bar Chart Ppt PowerPoint Presentation File Slide
This is a bar chart ppt powerpoint presentation file slide. This is a one stage process. The stages in this process are sales in percentage financial years, business, marketing, strategy, graph.
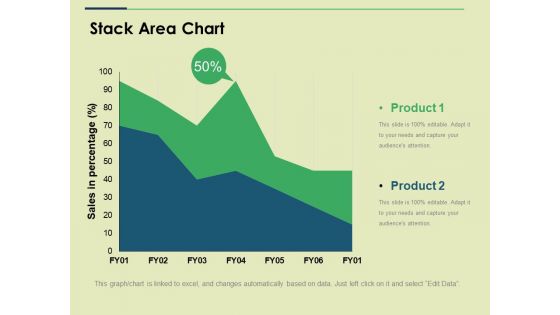
Stack Area Chart Ppt PowerPoint Presentation Show Slide
This is a stack area chart ppt powerpoint presentation show slide. This is a two stage process. The stages in this process are sales in percentage, business, marketing, strategy, graph.
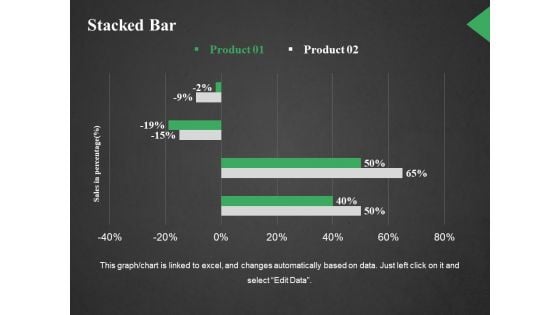
Stacked Bar Ppt PowerPoint Presentation Portfolio Background Image
This is a two stacked bar ppt powerpoint presentation portfolio background image. This is a two stage process. The stages in this process are sales in percentage, graph, business, marketing, strategy.
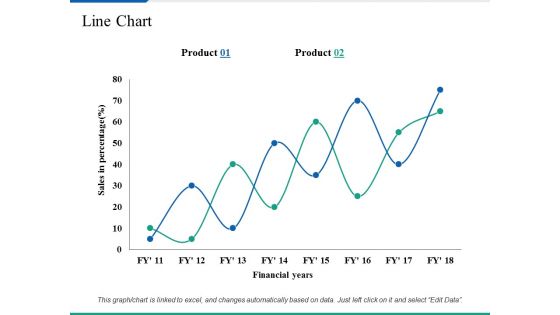
Line Chart Ppt PowerPoint Presentation Summary Clipart Images
This is a line chart ppt powerpoint presentation summary clipart images. This is a two stage process. The stages in this process are business, marketing, sales in percentage, financial years, strategy.
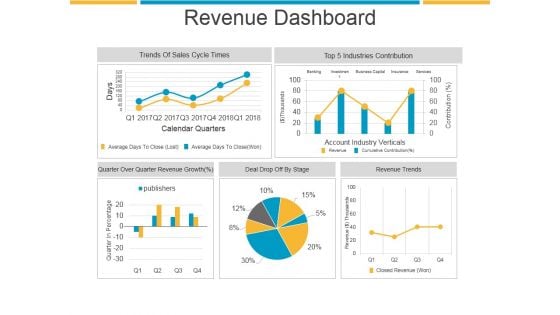
Revenue Dashboard Ppt PowerPoint Presentation Sample
This is a revenue dashboard ppt powerpoint presentation sample. This is a five stage process. The stages in this process are trends of sales cycle times, industries contribution, revenue trends, deal drop off by stage.
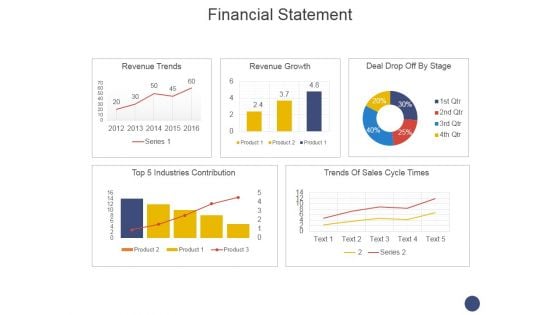
Financial Statement Ppt PowerPoint Presentation Professional Clipart
This is a financial statement ppt powerpoint presentation professional clipart. This is a five stage process. The stages in this process are revenue trends, revenue growth, deal drop off by stage, trends of sales cycle times.

Back To School Banner Educational Theme Image Ppt PowerPoint Presentation Slides File Formats
This is a back to school banner educational theme image ppt powerpoint presentation slides file formats. This is a four stage process. The stages in this process are sales process school banner project, school poster project.
Back To School Classroom Welcome Banner Ppt PowerPoint Presentation Gallery Icons
This is a back to school classroom welcome banner ppt powerpoint presentation gallery icons. This is a four stage process. The stages in this process are sales process school banner project, school poster project.

Back To School Poster With Stationery Items Ppt PowerPoint Presentation Show Influencers
This is a back to school poster with stationery items ppt powerpoint presentation show influencers. This is a one stage process. The stages in this process are sales process school banner project, school poster project.

Back To School Theme For Kids Poster Image Ppt PowerPoint Presentation Professional Introduction
This is a back to school theme for kids poster image ppt powerpoint presentation professional introduction. This is a three stage process. The stages in this process are sales process school banner project, school poster project.

I Love School Drawing Banner With Books And Color Pens Ppt PowerPoint Presentation Inspiration Visual Aids
This is a i love school drawing banner with books and color pens ppt powerpoint presentation inspiration visual aids. This is a five stage process. The stages in this process are sales process school banner project, school poster project.

I Love School Kids Poster Ppt PowerPoint Presentation Layouts Slides
This is a i love school kids poster ppt powerpoint presentation layouts slides. This is a four stage process. The stages in this process are sales process school banner project, school poster project.

Kids Standing Together Holding Hands School Banner Ppt PowerPoint Presentation Layouts Pictures
This is a kids standing together holding hands school banner ppt powerpoint presentation layouts pictures. This is a six stage process. The stages in this process are sales process school banner project, school poster project.
School Banner Image For Back To School Theme Ppt PowerPoint Presentation Icon Display
This is a school banner image for back to school theme ppt powerpoint presentation icon display. This is a six stage process. The stages in this process are sales process school banner project, school poster project.
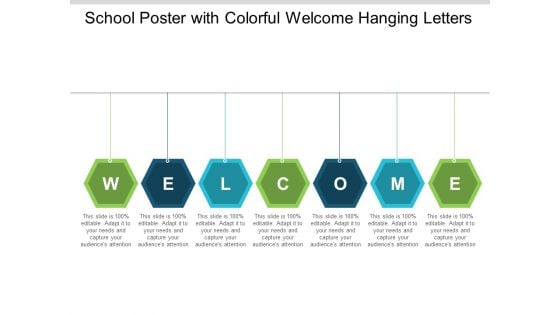
School Poster With Colorful Welcome Hanging Letters Ppt PowerPoint Presentation Inspiration Slides
This is a school poster with colorful welcome hanging letters ppt powerpoint presentation inspiration slides. This is a seven stage process. The stages in this process are sales process school banner project, school poster project.
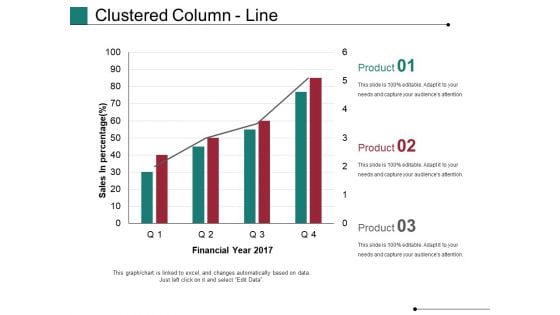
Clustered Column Line Ppt PowerPoint Presentation Model Rules
This is a clustered column line ppt powerpoint presentation model rules. This is a four stage process. The stages in this process are financial year, sales in percentage, business, marketing, growth, graph.
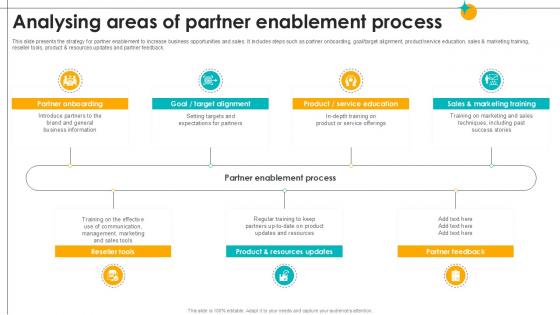
Analysing Areas Of Partner Enablement Process Partner Relationship Ppt Example
This slide presents the strategy for partner enablement to increase business opportunities and sales. It includes steps such as partner onboarding, goal target alignment, product service education, sales and marketing training, reseller tools, product and resources updates and partner feedback. Slidegeeks is one of the best resources for PowerPoint templates. You can download easily and regulate Analysing Areas Of Partner Enablement Process Partner Relationship Ppt Example for your personal presentations from our wonderful collection. A few clicks is all it takes to discover and get the most relevant and appropriate templates. Use our Templates to add a unique zing and appeal to your presentation and meetings. All the slides are easy to edit and you can use them even for advertisement purposes. This slide presents the strategy for partner enablement to increase business opportunities and sales. It includes steps such as partner onboarding, goal target alignment, product service education, sales and marketing training, reseller tools, product and resources updates and partner feedback.
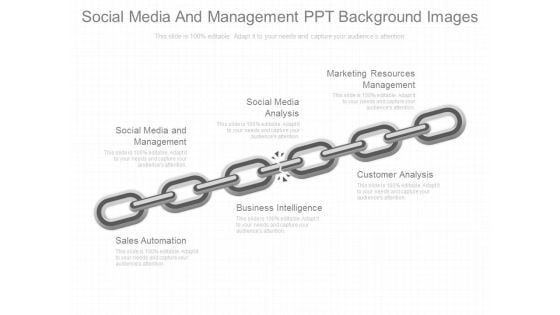
Social Media And Management Ppt Background Images
This is a social media and management ppt background images. This is a six stage process. The stages in this process are social media and management, social media analysis, marketing resources management, sales automation, business intelligence, customer analysis.
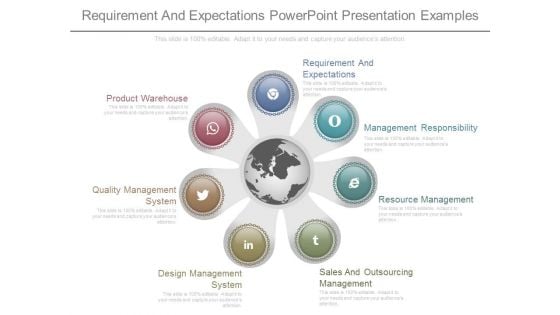
Requirement And Expectations Powerpoint Presentation Examples
This is a requirement and expectations powerpoint presentation examples. This is a seven stage process. The stages in this process are requirement and expectations, management responsibility, resource management, sales and outsourcing management, design management system, quality management system, product warehouse.
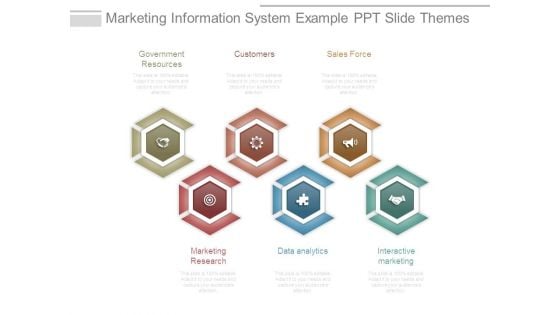
Marketing Information System Example Ppt Slide Themes
This is a marketing information system example ppt slide themes. This is a six stage process. The stages in this process are government resources, customers, sales force, marketing research, data analytics, interactive marketing.
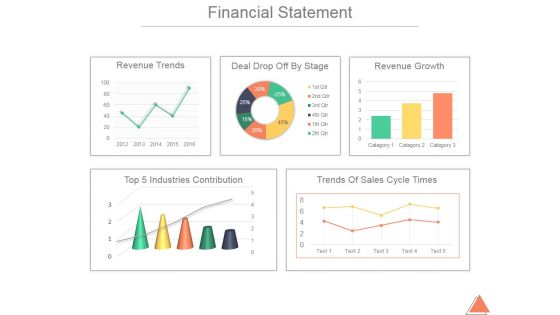
Financial Statement Ppt PowerPoint Presentation Guide
This is a financial statement ppt powerpoint presentation guide. This is a five stage process. The stages in this process are top 5 industries contribution, trends of sales cycle times, revenue trends, deal drop off by stage, revenue growth.
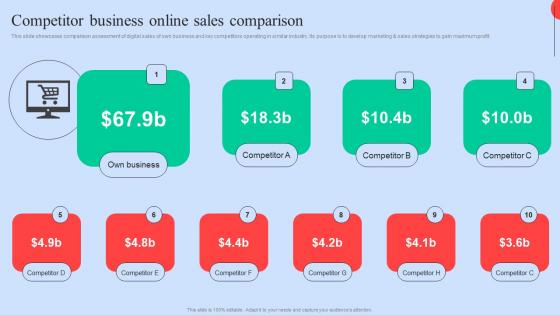
Competitor Business Online Executing Competitors Strategies To Assess Organizational Performance Clipart Pdf
This slide showcases comparison assessment of digital sales of own business and key competitors operating in similar industry. Its purpose is to develop marketing and sales strategies to gain maximum profit. The best PPT templates are a great way to save time, energy, and resources. Slidegeeks have 100 percent editable powerpoint slides making them incredibly versatile. With these quality presentation templates, you can create a captivating and memorable presentation by combining visually appealing slides and effectively communicating your message. Download Competitor Business Online Executing Competitors Strategies To Assess Organizational Performance Clipart Pdf from Slidegeeks and deliver a wonderful presentation. This slide showcases comparison assessment of digital sales of own business and key competitors operating in similar industry. Its purpose is to develop marketing and sales strategies to gain maximum profit.
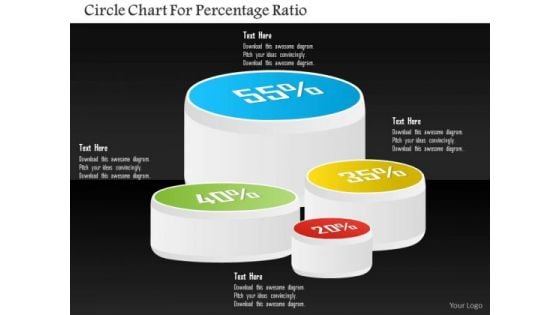
Business Diagram Circle Chart For Percentage Ratio Presentation Template
Four staged circular chart has been used to craft this PPT diagram. This PPT contains the concept of result analysis. Use this PPT in your business and sales presentation and display any kind of result analysis in a graphical way.
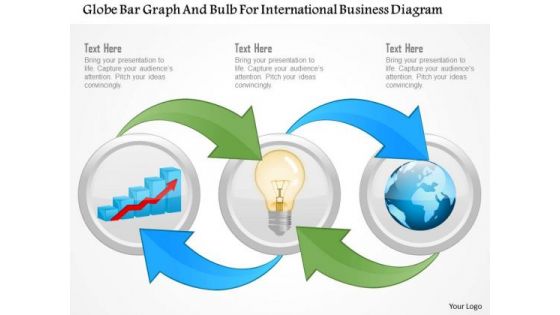
Business Diagram Globe Bar Graph And Bulb For International Business Diagram Presentation Template
Graphic of globe and bar graph with bulb has been used to craft this power point template diagram. This PPT diagram contains the concept of international business growth analysis. Use this PPT for global business and sales related presentations.
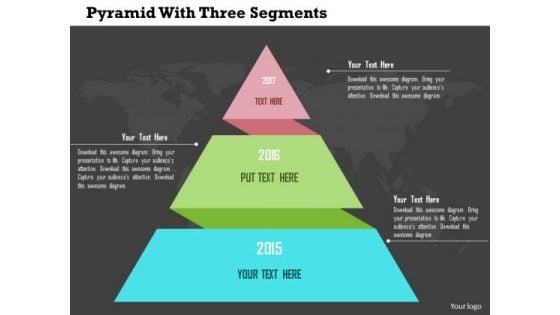
Business Diagram Pyramid With Three Segments Presentation Template
Sales process can be explained with this pyramid diagram. This diagram contains the graphic of pyramid chart with three segments. This diagram provides an effective way of displaying information.
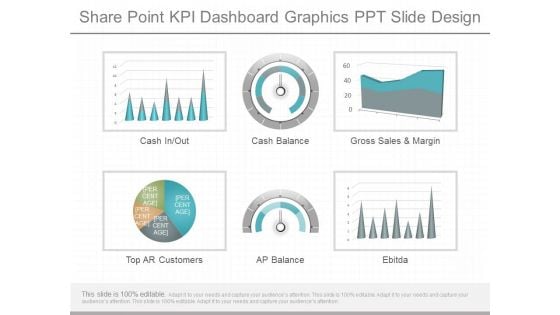
Share Point Kpi Dashboard Graphics Ppt Slide Design
This is a share point kpi dashboard graphics ppt slide design. This is a six stage process. The stages in this process are cash in out, cash balance, gross sales and margin, top ar customers, ap balance, ebitda.
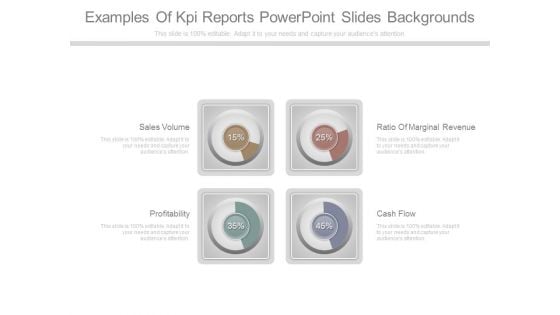
Examples Of Kpi Reports Powerpoint Slides Backgrounds
This is a examples of kpi reports powerpoint slides backgrounds. This is a four stage process. The stages in this process are sales volume, profitability, ratio of marginal revenue, cash flow.
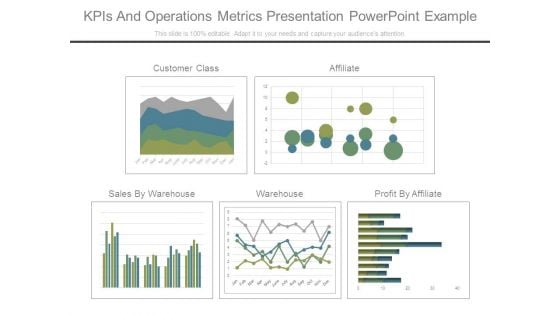
Kpis And Operations Metrics Presentation Powerpoint Example
This is a kpis and operations metrics presentation powerpoint example. This is a five stage process. The stages in this process are customer class, affiliate, sales by warehouse, warehouse, profit by affiliate.
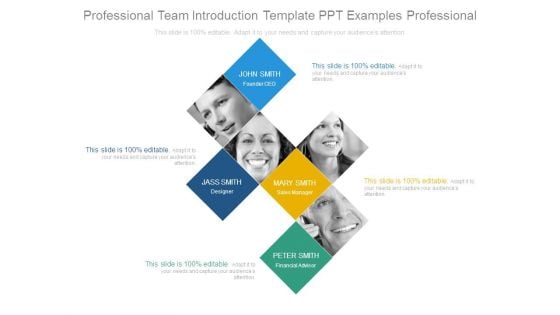
Professional Team Introduction Template Ppt Examples Professional
This is a professional team introduction template ppt examples professional. This is a four stage process. The stages in this process are founder ceo, designer, sales manager, financial advisor.

Measuring Content Marketing Performance Ppt PowerPoint Presentation Design Ideas
This is a measuring content marketing performance ppt powerpoint presentation design ideas. This is a eight stage process. The stages in this process are conversion rate, quality of leads, website traffic, number of leads, sales revenue, subscriber list growth.
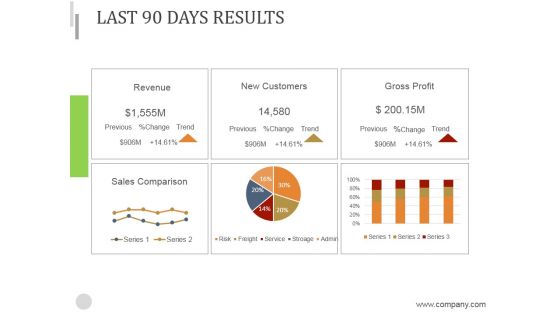
Last 90 Days Results Ppt PowerPoint Presentation Introduction
This is a last 90 days results ppt powerpoint presentation introduction. This is a six stage process. The stages in this process are revenue, new customers, gross profit, sales comparison.
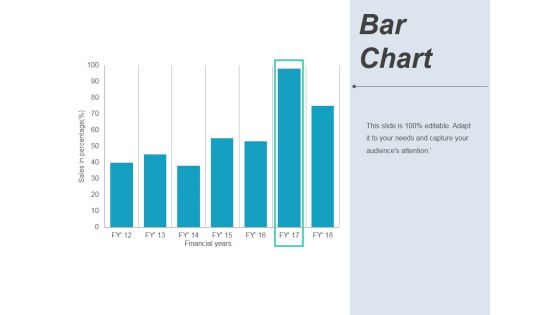
Bar Chart Ppt PowerPoint Presentation Pictures Background Image
This is a bar chart ppt powerpoint presentation pictures background image. This is a seven stage process. The stages in this process are financial years, sales in percentage, graph, business.
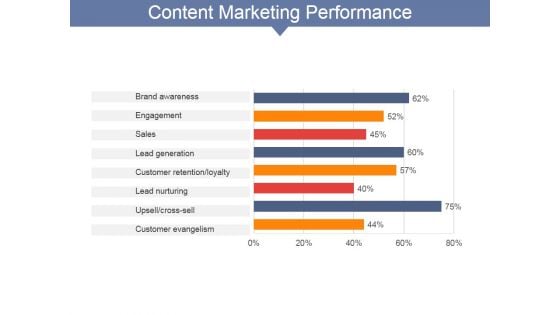
Content Marketing Performance Ppt PowerPoint Presentation Slides Model
This is a content marketing performance ppt powerpoint presentation slides model. This is a eight stage process. The stages in this process are conversion rate, quality of leads, number of leads, sales revenue, website traffic.
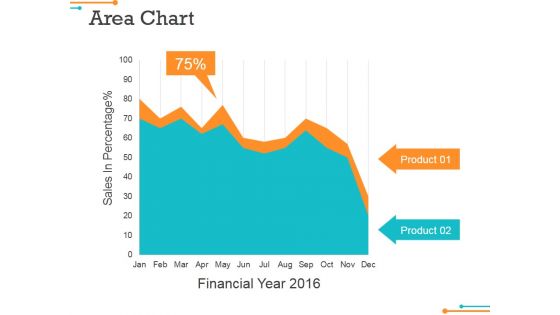
Area Chart Ppt Powerpoint Presentation File Show
This is a area chart ppt powerpoint presentation file show. This is a two stage process. The stages in this process are sales in percentage, financial year, product, financial, business.
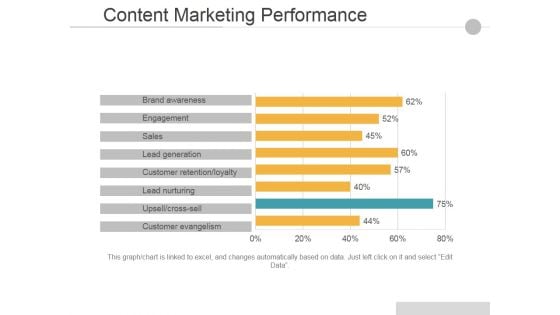
Content Marketing Performance Ppt PowerPoint Presentation Guidelines
This is a content marketing performance ppt powerpoint presentation guidelines. This is a eight stage process. The stages in this process are conversion rate, quality of leads, number of leads, sales revenue, website traffic.
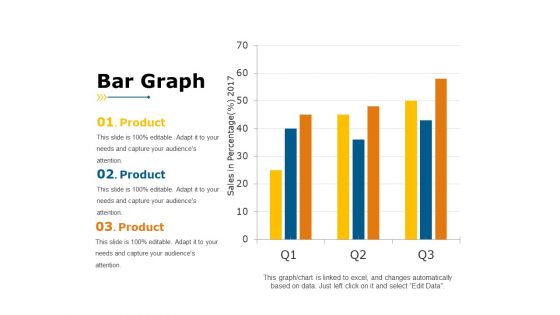
Bar Graph Ppt PowerPoint Presentation Portfolio Example
This is a bar graph ppt powerpoint presentation portfolio example. This is a three stage process. The stages in this process are sales in percentage, year, business, product, business, graph.
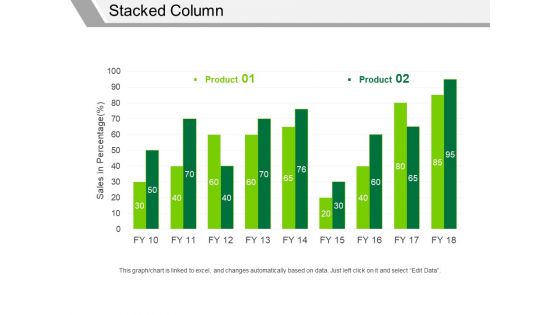
Stacked Column Ppt PowerPoint Presentation Infographics Samples
This is a stacked column ppt powerpoint presentation infographics samples. This is a two stage process. The stages in this process are product, sales in percentage, business, marketing, graph.
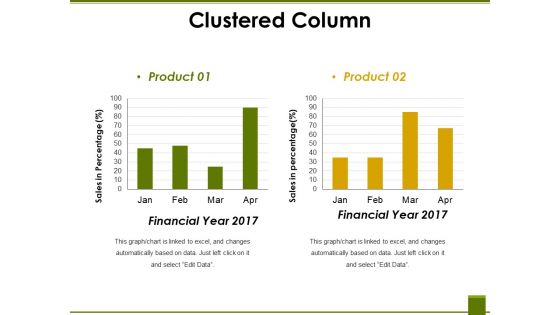
Clustered Column Ppt PowerPoint Presentation Ideas Graphic Tips
This is a clustered column ppt powerpoint presentation ideas graphic tips. This is a two stage process. The stages in this process are financial year, sales in percentage, product, graph, business.
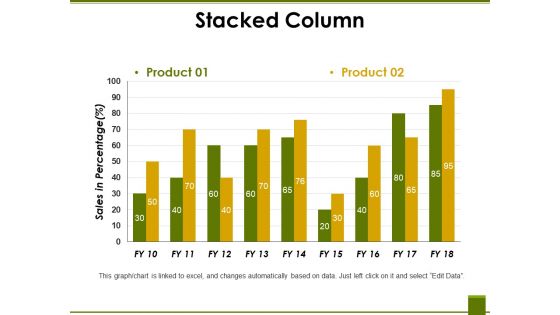
Stacked Column Ppt PowerPoint Presentation Professional Vector
This is a stacked column ppt powerpoint presentation professional vector. This is a two stage process. The stages in this process are product, sales in percentage, business, marketing, graph.
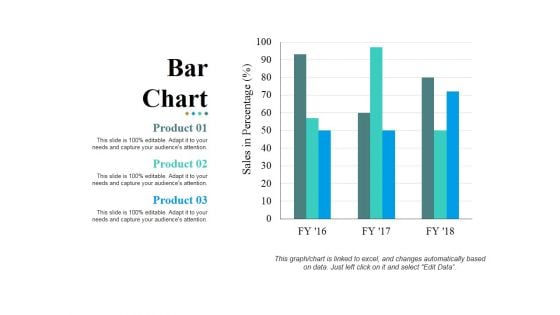
Bar Chart Ppt PowerPoint Presentation Layouts Pictures
This is a bar chart ppt powerpoint presentation layouts pictures. This is a three stage process. The stages in this process are bar graph, product, sales in percentage, business, marketing.
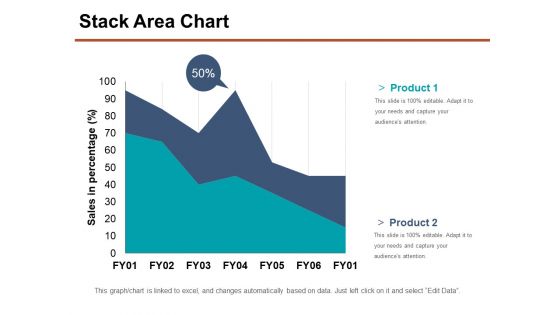
Stack Area Chart Ppt PowerPoint Presentation Show Samples
This is a stack area chart ppt powerpoint presentation show samples. This is a two stage process. The stages in this process are product, sales in percentage, business, marketing, percentage.
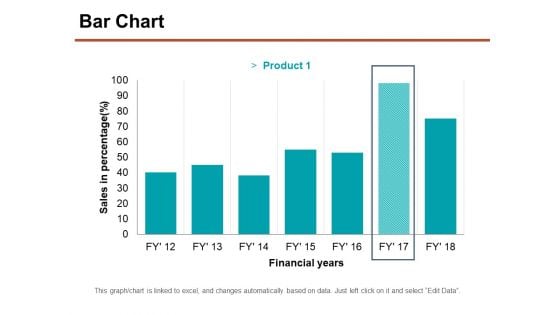
Bar Chart Ppt PowerPoint Presentation Professional Graphics Download
This is a bar chart ppt powerpoint presentation professional graphics download. This is a seven stage process. The stages in this process are sales in percentage, financial years, chart, business.
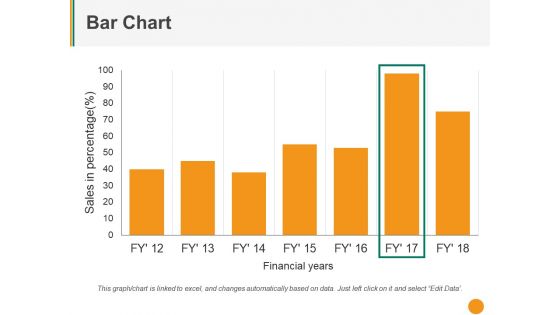
Bar Chart Ppt PowerPoint Presentation Styles Outfit
This is a bar chart ppt powerpoint presentation styles outfit. This is a Seven stage process. The stages in this process are sales in percentage, financial years, graph, business.
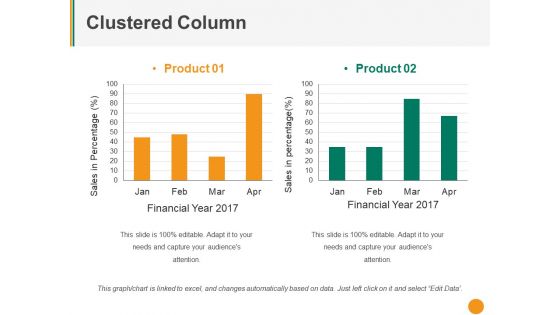
Clustered Column Ppt PowerPoint Presentation Pictures Mockup
This is a clustered column ppt powerpoint presentation pictures mockup. This is a two stage process. The stages in this process are product, sales in percentage, financial year, graph, business.
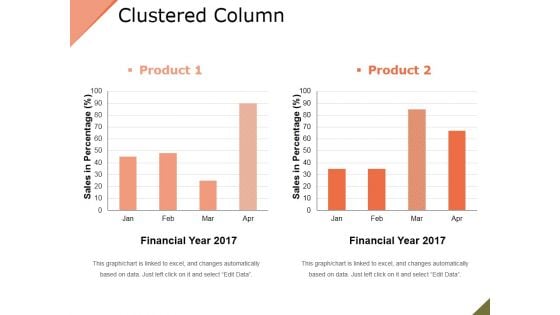
Clustered Column Ppt PowerPoint Presentation File Slide
This is a clustered column ppt powerpoint presentation file slide. This is a two stage process. The stages in this process are product, financial year, sales in percentage, bar graph.
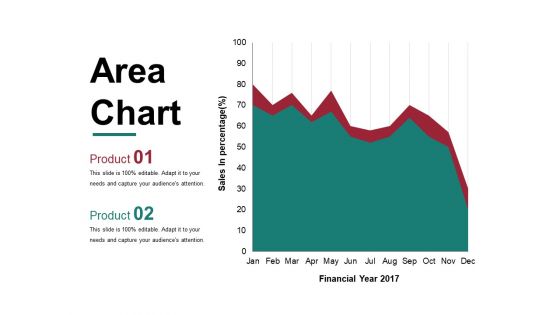
Area Chart Ppt PowerPoint Presentation Layouts Maker
This is a area chart ppt powerpoint presentation layouts maker. This is a two stage process. The stages in this process are financial year, sales in percentage, graph, business, marketing.
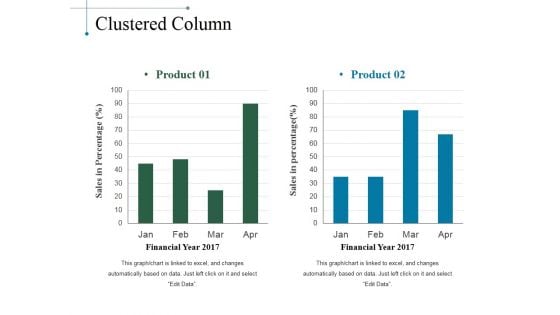
Clustered Column Ppt PowerPoint Presentation Slides Smartart
This is a clustered column ppt powerpoint presentation slides smartart. This is a two stage process. The stages in this process are product, sales in percentage, financial year, bar graph.
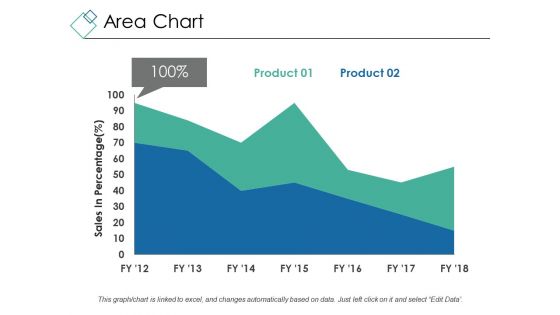
Area Chart Ppt PowerPoint Presentation Inspiration Demonstration
This is a area chart ppt powerpoint presentation inspiration demonstration. This is a two stage process. The stages in this process are sales in percentage, chart, percentage, business, marketing.
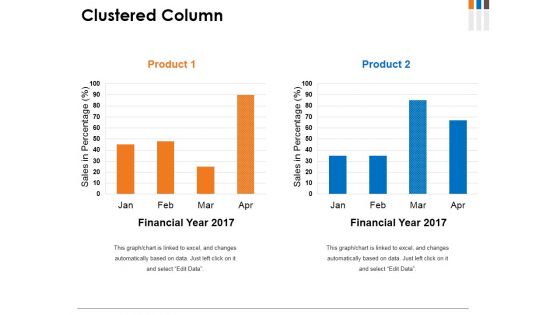
Clustered Column Ppt PowerPoint Presentation File Graphics
This is a clustered column ppt powerpoint presentation file graphics. This is a two stage process. The stages in this process are product, financial year, sales in percentage, graph, growth.
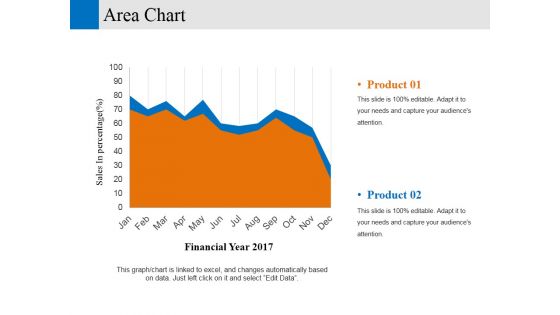
area chart ppt powerpoint presentation professional elements
This is a area chart ppt powerpoint presentation professional elements. This is a two stage process. The stages in this process are financial year sales in percentage, business, marketing, graph.
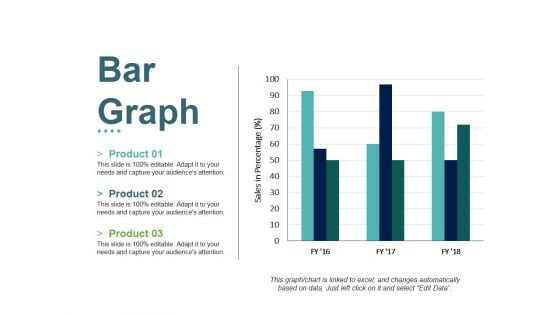
Bar Graph Ppt PowerPoint Presentation File Slides
This is a bar graph ppt powerpoint presentation file slides. This is a three stage process. The stages in this process are product, sales in percentage, bar graph, growth, success.
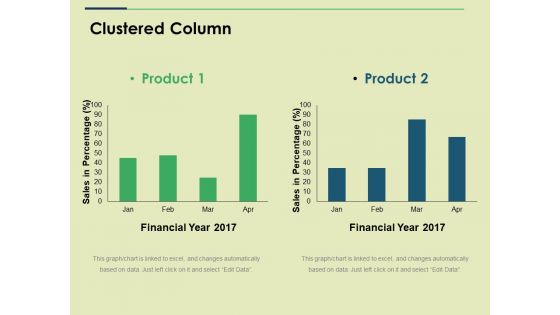
Clustered Column Ppt PowerPoint Presentation Show Graphics
This is a clustered column ppt powerpoint presentation show graphics. This is a two stage process. The stages in this process are financial year, sales in percentage, business, marketing, graph.
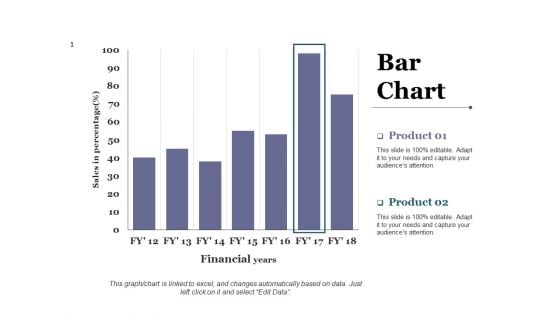
Bar Chart Ppt PowerPoint Presentation Diagram Lists
This is a bar chart ppt powerpoint presentation diagram lists. This is a two stage process. The stages in this process are business, marketing, financial years, sales in percentage, graph.
Column Chart Ppt PowerPoint Presentation Icon Guide
This is a column chart ppt powerpoint presentation icon guide. This is a two stage process. The stages in this process are business, year, sales in percentage, marketing, graph.
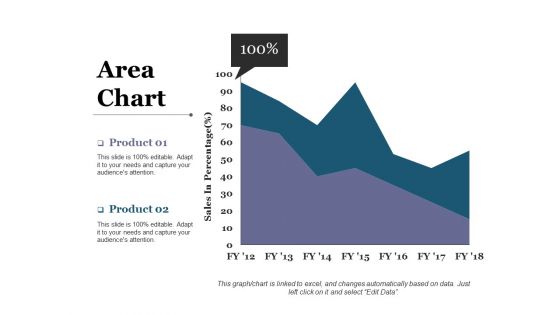
Area Chart Ppt PowerPoint Presentation Model Introduction
This is a area chart ppt powerpoint presentation model introduction. This is a two stage process. The stages in this process are sales in percentage, area chart, percentage, business, marketing.
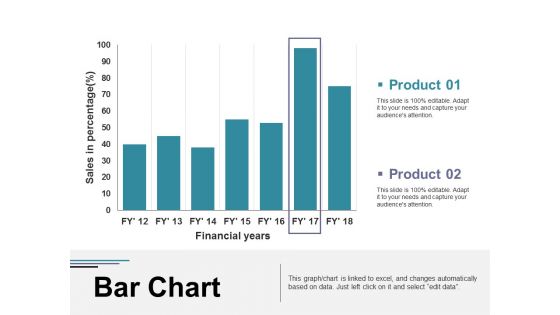
Bar Chart Ppt PowerPoint Presentation Visual Aids Diagrams
This is a bar chart ppt powerpoint presentation visual aids diagrams. This is a two stage process. The stages in this process are business, marketing, financial years, sales in percentage, graph.
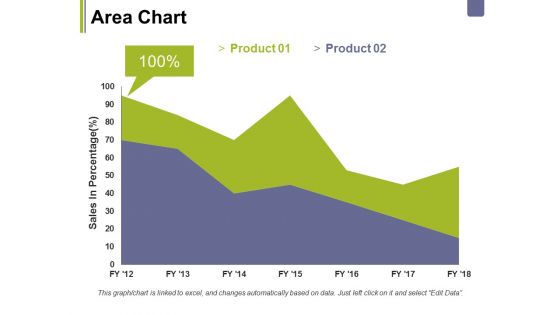
Area Chart Ppt PowerPoint Presentation Styles Show
This is a area chart ppt powerpoint presentation styles show. This is a two stage process. The stages in this process are business, marketing, area chart, sales in percentage, percentage.
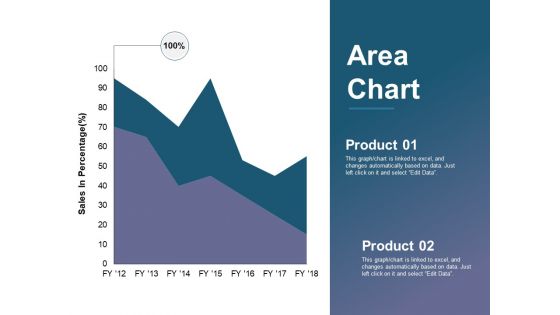
Area Chart Ppt PowerPoint Presentation Summary Information
This is a area chart ppt powerpoint presentation summary information. This is a two stage process. The stages in this process are business, sales in percentage, percentage, marketing, graph.
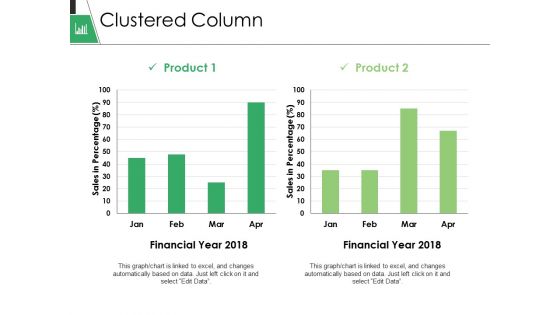
Clustered Column Ppt PowerPoint Presentation Gallery Format
This is a clustered column ppt powerpoint presentation gallery format. This is a two stage process. The stages in this process are business, marketing, graph, financial year, sales in percentage.


 Continue with Email

 Home
Home


