Sales Campaign

Client Testimonials Ppt PowerPoint Presentation Gallery Introduction
This is a client testimonials ppt powerpoint presentation gallery introduction. This is a two stage process. The stages in this process are john smith, sales manager, mary smith, founder ceo.
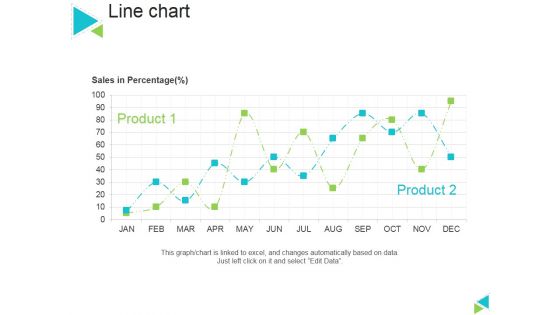
Line Chart Ppt PowerPoint Presentation Gallery Master Slide
This is a line chart ppt powerpoint presentation gallery master slide. This is a two stage process. The stages in this process are sales in percentage, product, line chart.

Our Marketing Team Ppt PowerPoint Presentation Summary Format
This is a our marketing team ppt powerpoint presentation summary format. This is a five stage process. The stages in this process are marketing manager, marketing director, product marketing manager, sales manager.
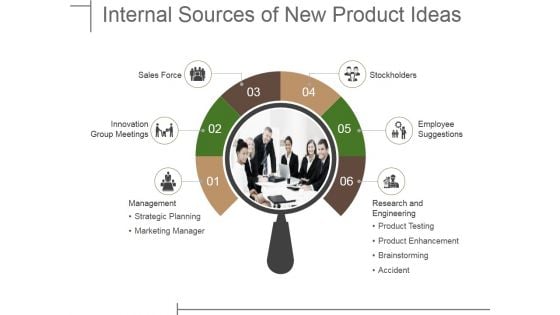
Internal Sources Of New Product Ideas Ppt PowerPoint Presentation Infographics Graphics Download
This is a internal sources of new product ideas ppt powerpoint presentation infographics graphics download. This is a six stage process. The stages in this process are sales force, innovation group meetings, management, stockholders, employee suggestions.
Media Kpi Development Ppt PowerPoint Presentation Show Icon
This is a media kpi development ppt powerpoint presentation show icon. This is a four stage process. The stages in this process are visitors, leads, marketing qualified leads, sales qualified leads, decision.
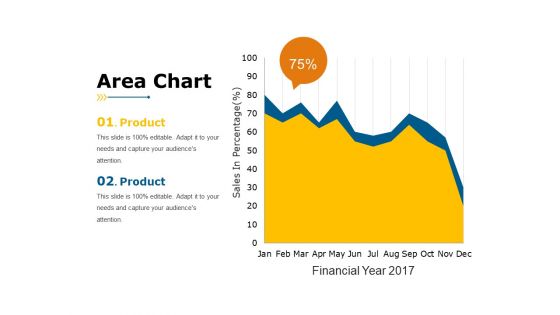
Area Chart Ppt PowerPoint Presentation Slides Rules
This is a area chart ppt powerpoint presentation slides rules. This is a two stage process. The stages in this process are sales in percentage, business, marketing, product, finance.
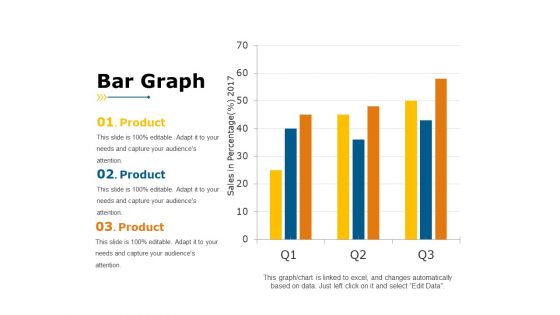
Bar Graph Ppt PowerPoint Presentation Portfolio Example
This is a bar graph ppt powerpoint presentation portfolio example. This is a three stage process. The stages in this process are sales in percentage, year, business, product, business, graph.

Marketing Assessment Ppt PowerPoint Presentation Gallery Guidelines
This is a marketing assessment ppt powerpoint presentation gallery guidelines. This is a five stage process. The stages in this process are target market, forecasting of sales volume, indication of product positioning,, competitor reaction.
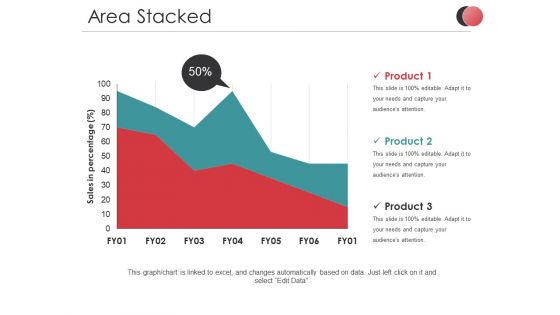
Area Stacked Ppt PowerPoint Presentation Diagram Images
This is a area stacked ppt powerpoint presentation diagram images. This is a two stage process. The stages in this process are sales in percentage, product, business, marketing, finance.
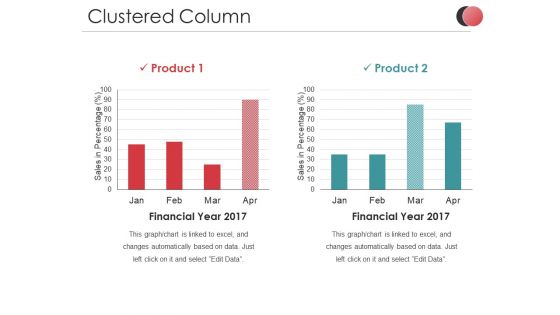
Clustered Column Ppt PowerPoint Presentation Slides Ideas
This is a clustered column ppt powerpoint presentation slides ideas. This is a two stage process. The stages in this process are sales in percentage, business, marketing, finance, graph.
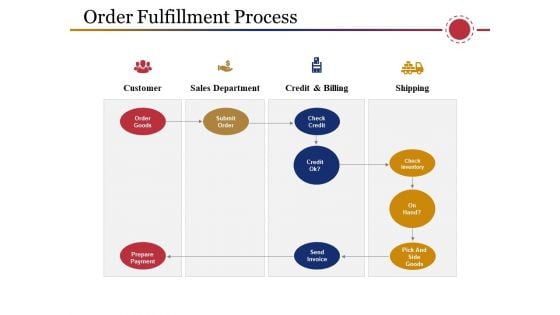
Order Fulfillment Process Ppt PowerPoint Presentation Pictures Graphics Tutorials
This is a order fulfillment process ppt powerpoint presentation pictures graphics tutorials. This is a four stage process. The stages in this process are customer, sales department, credit and billing, shipping, order goods.
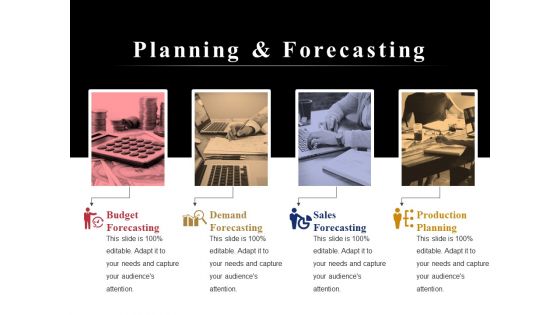
Planning And Forecasting Ppt PowerPoint Presentation Infographic Template Graphics Tutorials
This is a planning and forecasting ppt powerpoint presentation infographic template graphics tutorials. This is a four stage process. The stages in this process are budget forecasting, demand forecasting, sales forecasting, production planning.
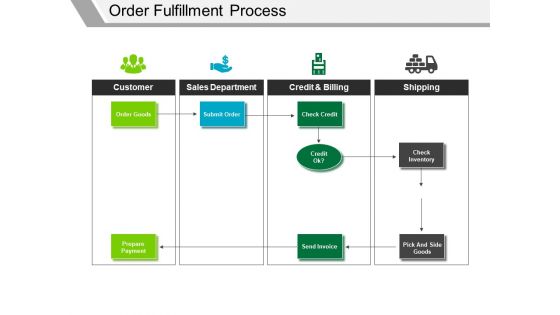
Order Fulfillment Process Ppt PowerPoint Presentation Styles Graphics Tutorials
This is a order fulfillment process ppt powerpoint presentation styles graphics tutorials. This is a four stage process. The stages in this process are customer, sales department, credit and billing, shipping, check inventory.
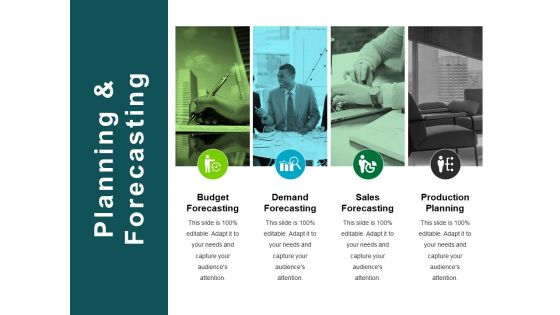
Planning And Forecasting Ppt PowerPoint Presentation Show Deck
This is a planning and forecasting ppt powerpoint presentation show deck. This is a four stage process. The stages in this process are budget forecasting, demand forecasting, sales forecasting, production planning, icons.
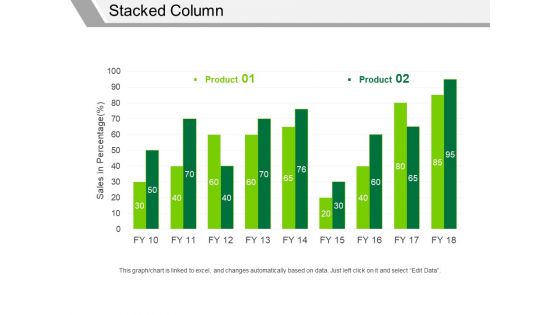
Stacked Column Ppt PowerPoint Presentation Infographics Samples
This is a stacked column ppt powerpoint presentation infographics samples. This is a two stage process. The stages in this process are product, sales in percentage, business, marketing, graph.
Area Chart Ppt PowerPoint Presentation Gallery Icons
This is a area chart ppt powerpoint presentation gallery icons. This is a two stage process. The stages in this process are financial year, sales in percentage, product, finance, graph.
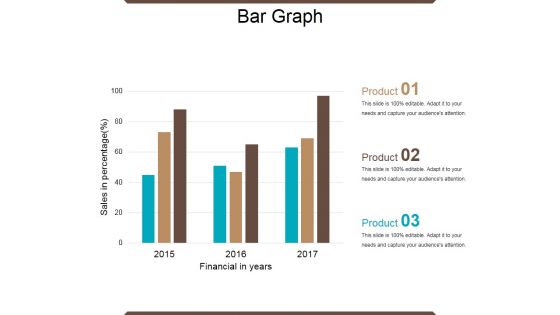
Bar Graph Ppt PowerPoint Presentation Ideas Graphic Tips
This is a bar graph ppt powerpoint presentation ideas graphic tips. This is a three stage process. The stages in this process are financial year, sales in percentage, product, bar graph, growth.
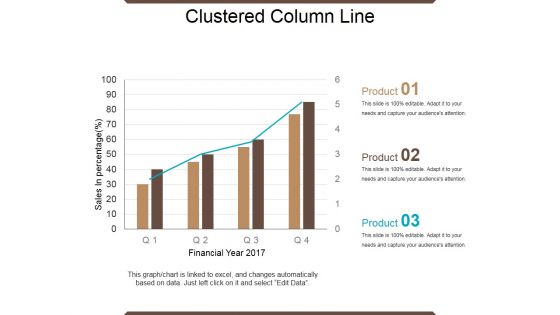
Clustered Column Line Ppt PowerPoint Presentation Show Influencers
This is a clustered column line ppt powerpoint presentation show influencers. This is a four stage process. The stages in this process are financial year, sales in percentage, product, growth, success.
Order Fulfillment Process Ppt PowerPoint Presentation Icon Demonstration
This is a order fulfillment process ppt powerpoint presentation icon demonstration. This is a four stage process. The stages in this process are customer, sales department, credit and billing, shipping, submit order.
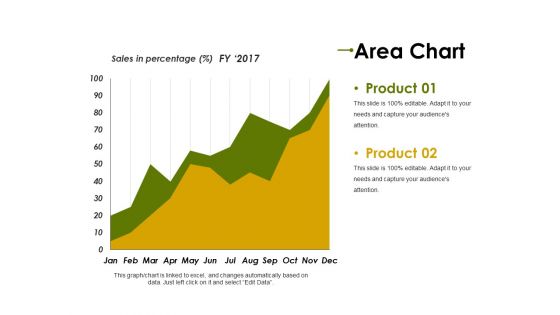
Area Chart Ppt PowerPoint Presentation Summary Objects
This is a area chart ppt powerpoint presentation summary objects. This is a two stage process. The stages in this process are product, sales in percentage, finance, business, marketing.
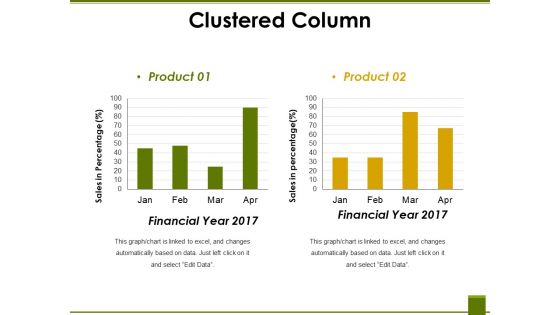
Clustered Column Ppt PowerPoint Presentation Ideas Graphic Tips
This is a clustered column ppt powerpoint presentation ideas graphic tips. This is a two stage process. The stages in this process are financial year, sales in percentage, product, graph, business.
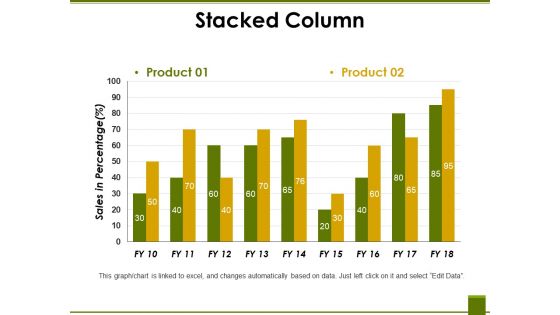
Stacked Column Ppt PowerPoint Presentation Professional Vector
This is a stacked column ppt powerpoint presentation professional vector. This is a two stage process. The stages in this process are product, sales in percentage, business, marketing, graph.
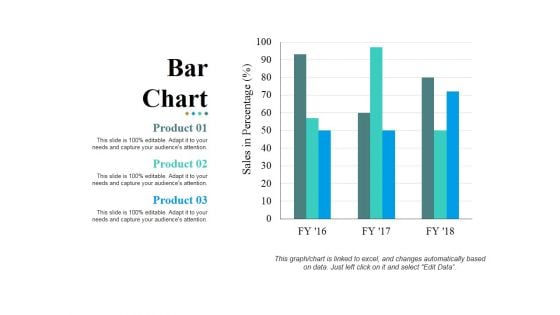
Bar Chart Ppt PowerPoint Presentation Layouts Pictures
This is a bar chart ppt powerpoint presentation layouts pictures. This is a three stage process. The stages in this process are bar graph, product, sales in percentage, business, marketing.
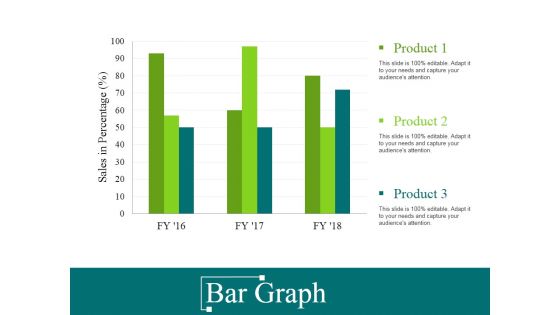
Bar Graph Ppt PowerPoint Presentation Gallery Grid
This is a bar graph ppt powerpoint presentation gallery grid. This is a three stage process. The stages in this process are sales in percentage, product, finance, business, marketing.
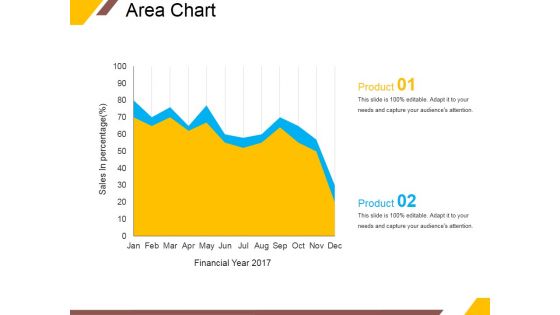
Area Chart Ppt PowerPoint Presentation Layouts Vector
This is a area chart ppt powerpoint presentation layouts vector. This is a two stage process. The stages in this process are area chart, product, sales in percentage, financial year.
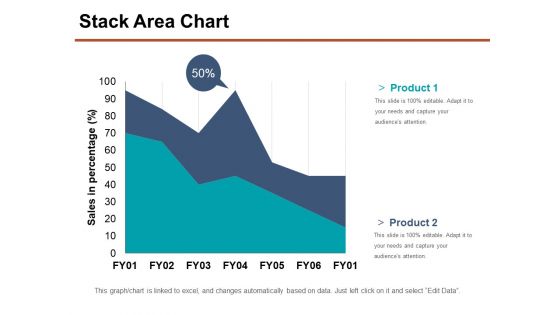
Stack Area Chart Ppt PowerPoint Presentation Show Samples
This is a stack area chart ppt powerpoint presentation show samples. This is a two stage process. The stages in this process are product, sales in percentage, business, marketing, percentage.
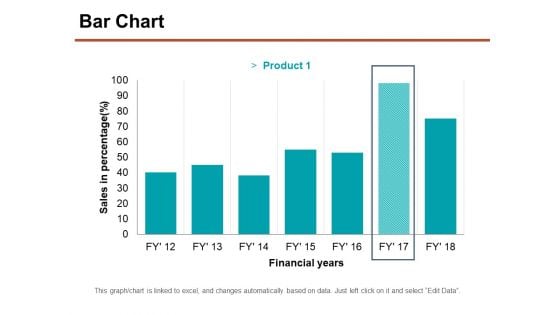
Bar Chart Ppt PowerPoint Presentation Professional Graphics Download
This is a bar chart ppt powerpoint presentation professional graphics download. This is a seven stage process. The stages in this process are sales in percentage, financial years, chart, business.
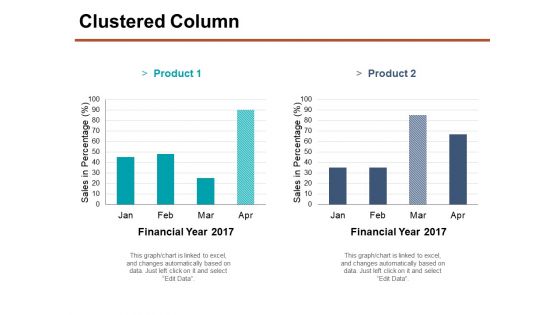
Clustered Column Ppt PowerPoint Presentation Portfolio Smartart
This is a clustered column ppt powerpoint presentation portfolio smartart. This is a two stage process. The stages in this process are financial year, product, sales in percentage, finance, business, graph.
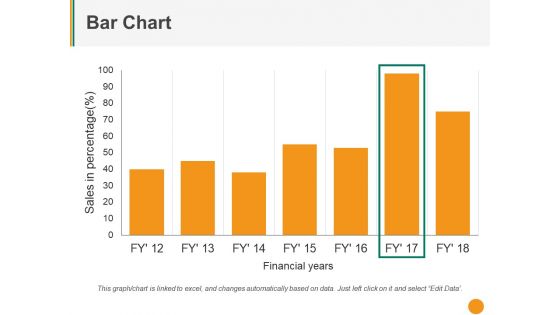
Bar Chart Ppt PowerPoint Presentation Styles Outfit
This is a bar chart ppt powerpoint presentation styles outfit. This is a Seven stage process. The stages in this process are sales in percentage, financial years, graph, business.
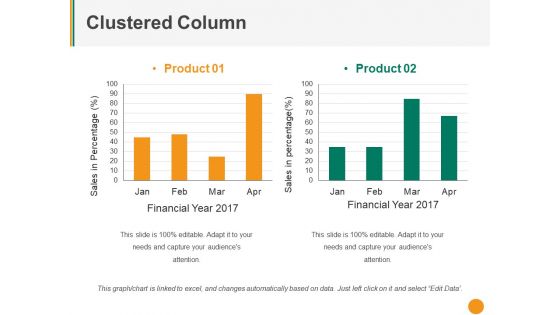
Clustered Column Ppt PowerPoint Presentation Pictures Mockup
This is a clustered column ppt powerpoint presentation pictures mockup. This is a two stage process. The stages in this process are product, sales in percentage, financial year, graph, business.
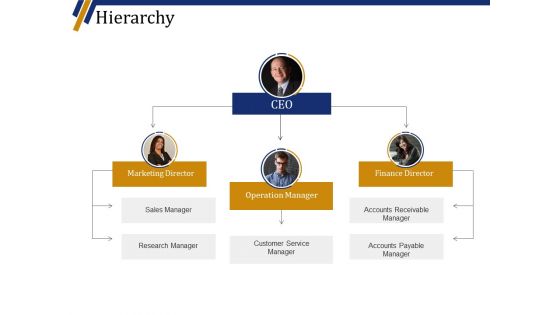
Hierarchy Ppt PowerPoint Presentation Layouts Visuals
This is a hierarchy ppt powerpoint presentation layouts visuals. This is a three stage process. The stages in this process are marketing director, operation manager, finance director, sales manager, research manager.
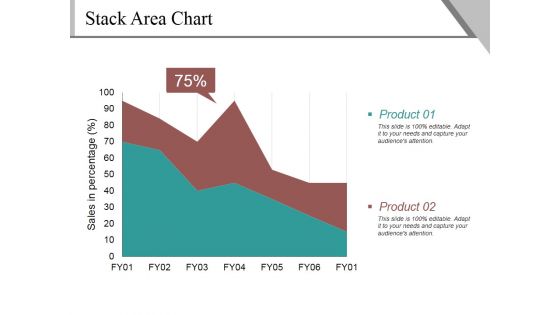
Stack Area Chart Ppt PowerPoint Presentation Gallery Guidelines
This is a stack area chart ppt powerpoint presentation gallery guidelines. This is a two stage process. The stages in this process are sales in percentage, product, percentage, business.
Bar Chart Ppt PowerPoint Presentation Icon Demonstration
This is a bar chart ppt powerpoint presentation icon demonstration. This is a seven stage process. The stages in this process are product, sales in percentage, financial year, graph.
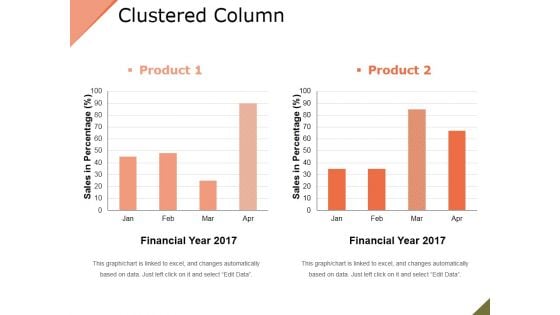
Clustered Column Ppt PowerPoint Presentation File Slide
This is a clustered column ppt powerpoint presentation file slide. This is a two stage process. The stages in this process are product, financial year, sales in percentage, bar graph.
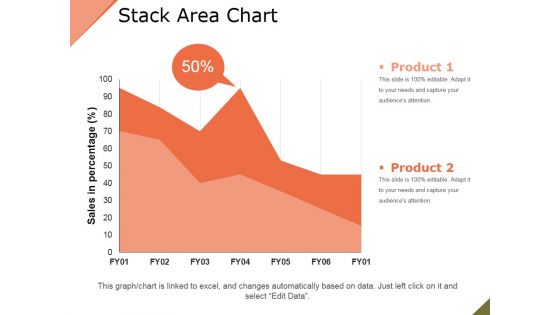
Stack Area Chart Ppt PowerPoint Presentation Example File
This is a stack area chart ppt powerpoint presentation example file. This is a two stage process. The stages in this process are product, sales in percentage, percentage, finance.

Our Team Ppt PowerPoint Presentation Portfolio Graphics Download
This is a our team ppt powerpoint presentation portfolio graphics download. This is a two stage process. The stages in this process are sales manager, graphic designer, our team, business, management.

Clustered Column Line Ppt PowerPoint Presentation Slide
This is a clustered column line ppt powerpoint presentation slide. This is a three stage process. The stages in this process are bar graph, growth, finance, product, sales in percentage.
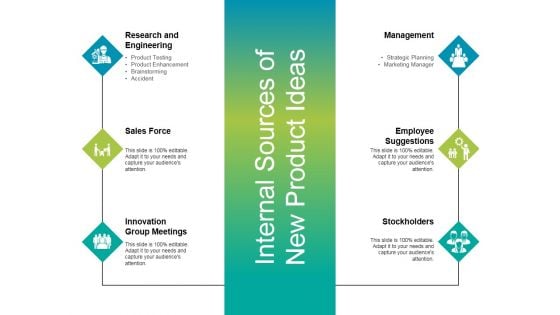
Internal Sources Of New Product Ideas Ppt PowerPoint Presentation Portfolio Information
This is a internal sources of new product ideas ppt powerpoint presentation portfolio information. This is a three stage process. The stages in this process are research and engineering, sales force, innovation group meetings, management, employee suggestions.
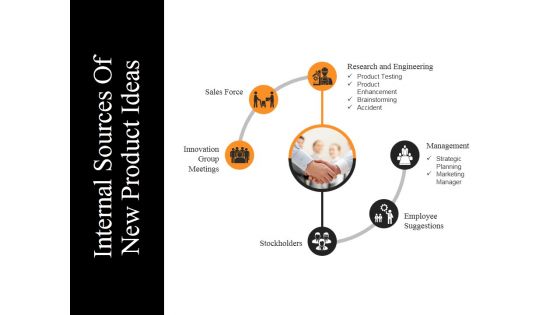
Internal Sources Of New Product Ideas Ppt PowerPoint Presentation Inspiration Portfolio
This is a internal sources of new product ideas ppt powerpoint presentation inspiration portfolio. This is a six stage process. The stages in this process are sales force, management, employee suggestions, stockholders, research and engineering.
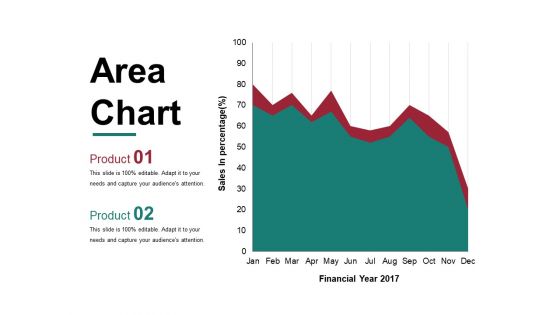
Area Chart Ppt PowerPoint Presentation Layouts Maker
This is a area chart ppt powerpoint presentation layouts maker. This is a two stage process. The stages in this process are financial year, sales in percentage, graph, business, marketing.
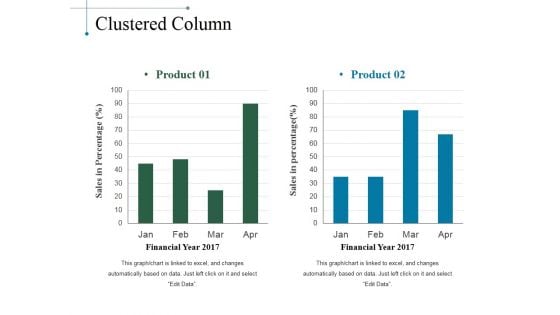
Clustered Column Ppt PowerPoint Presentation Slides Smartart
This is a clustered column ppt powerpoint presentation slides smartart. This is a two stage process. The stages in this process are product, sales in percentage, financial year, bar graph.
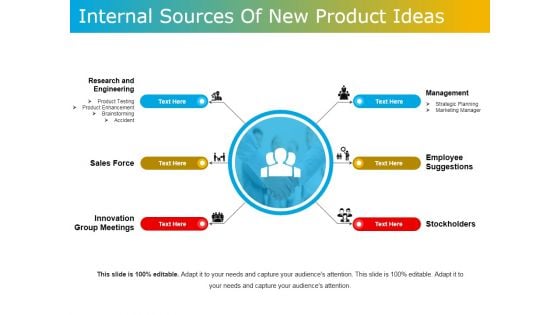
Internal Sources Of New Product Ideas Ppt PowerPoint Presentation Ideas Maker
This is a internal sources of new product ideas ppt powerpoint presentation ideas maker. This is a six stage process. The stages in this process are research and engineering, sales force, innovation group meetings, stockholders, employee suggestions.
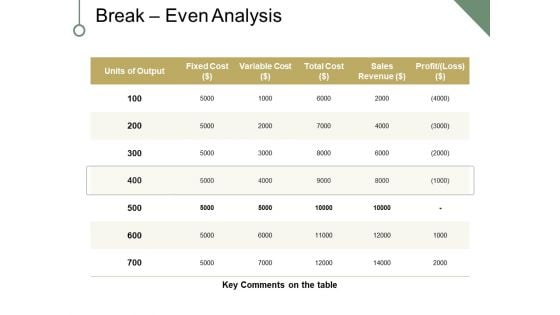
Break Even Analysis Ppt PowerPoint Presentation Portfolio Clipart
This is a break even analysis ppt powerpoint presentation portfolio clipart. This is a five stage process. The stages in this process are fixed cost, variable cost, sales revenue, profit, key comments on the table, units of output.
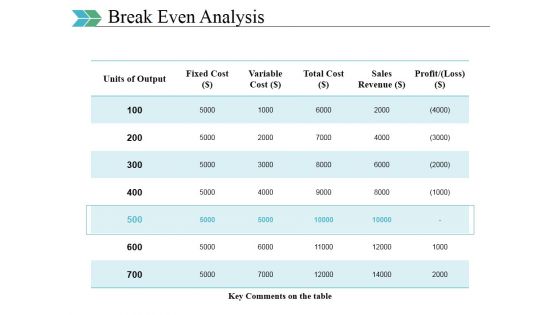
Break Even Analysis Ppt PowerPoint Presentation Styles Influencers
This is a break even analysis ppt powerpoint presentation styles influencers. This is a five stage process. The stages in this process are units of output, fixed cost, variable cost, total cost, sales revenue.
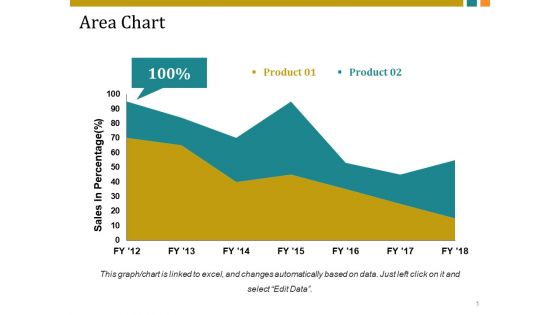
Area Chart Ppt PowerPoint Presentation Professional Brochure
This is a area chart ppt powerpoint presentation professional brochure. This is a two stage process. The stages in this process are sales in percentage, business, marketing, finance, graph.

Bar Chart Ppt PowerPoint Presentation Portfolio Diagrams
This is a bar chart ppt powerpoint presentation portfolio diagrams. This is a three stage process. The stages in this process are sales in percentage, business, marketing, graph, finance.
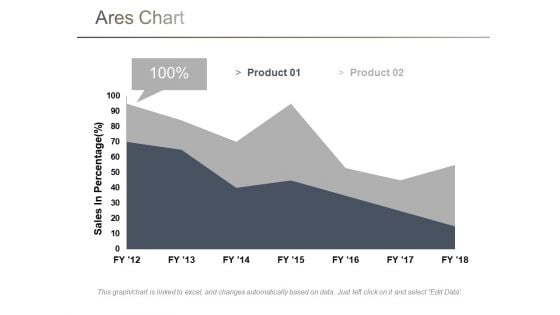
Area Chart Ppt PowerPoint Presentation Model Influencers
This is a area chart ppt powerpoint presentation model influencers. This is a two stage process. The stages in this process are sales in percentage, chart, business, marketing, finance.
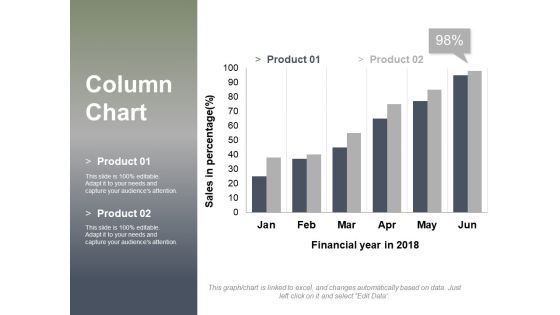
Column Chart Ppt PowerPoint Presentation Layouts Design Inspiration
This is a column chart ppt powerpoint presentation layouts design inspiration. This is a two stage process. The stages in this process are sales in percentage, financial year in, graph, business, finance, marketing.

Line Chart Ppt PowerPoint Presentation Infographics Graphic Images
This is a line chart ppt powerpoint presentation infographics graphic images. This is a two stage process. The stages in this process are sales in percentage, financial years, growth, business, marketing.
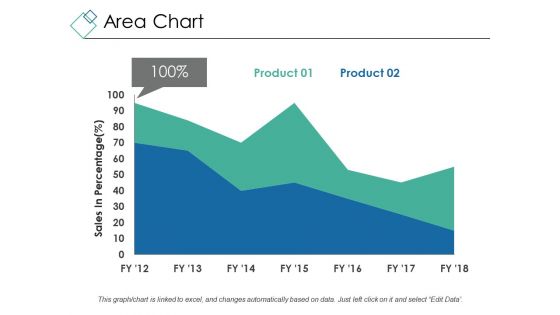
Area Chart Ppt PowerPoint Presentation Inspiration Demonstration
This is a area chart ppt powerpoint presentation inspiration demonstration. This is a two stage process. The stages in this process are sales in percentage, chart, percentage, business, marketing.
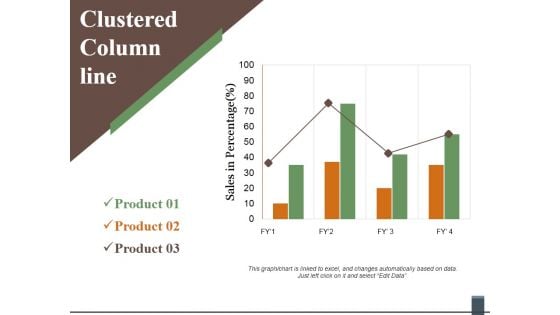
Clustered Column Line Ppt PowerPoint Presentation Inspiration Guidelines
This is a clustered column line ppt powerpoint presentation inspiration guidelines. This is a three stage process. The stages in this process are product, sales in percentage, graph, line, finance, business.
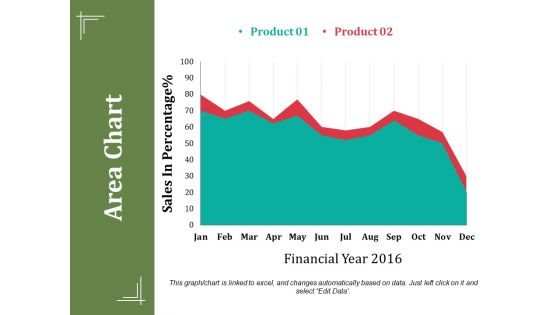
Area Chart Ppt PowerPoint Presentation Summary Show
This is a area chart ppt powerpoint presentation summary show. This is a two stage process. The stages in this process are sales in percentage, financial year, business, marketing, finance.
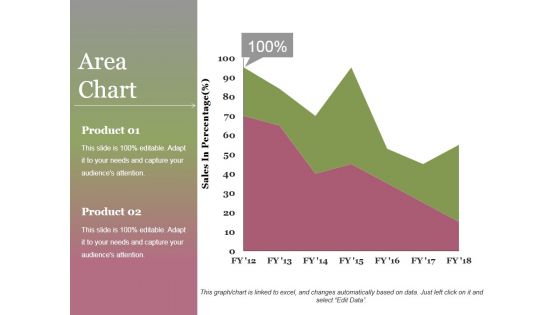
Area Chart Ppt PowerPoint Presentation Infographics File Formats
This is a area chart ppt powerpoint presentation infographics file formats. This is a two stage process. The stages in this process are area chart, product, sales in percentage, growth, success.
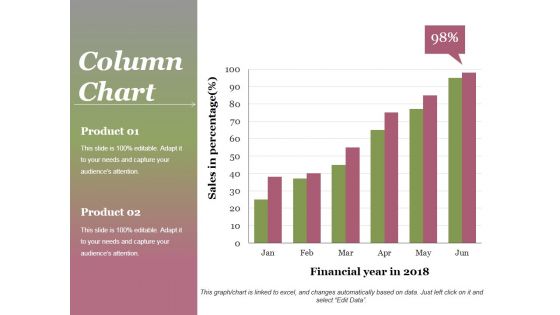
Column Chart Ppt PowerPoint Presentation Gallery Background
This is a column chart ppt powerpoint presentation gallery background. This is a two stage process. The stages in this process are product, sales in percentage, financial year, graph, success.
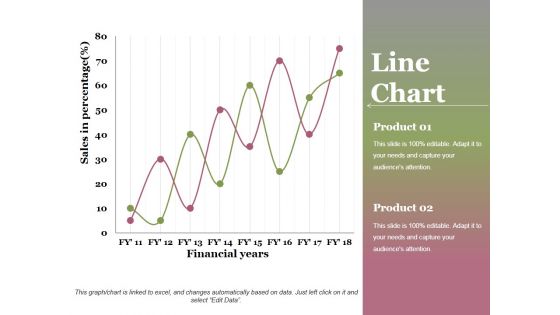
Line Chart Ppt PowerPoint Presentation Professional Graphics Design
This is a line chart ppt powerpoint presentation professional graphics design. This is a two stage process. The stages in this process are financial years, sales in percentage, product, growth, success.
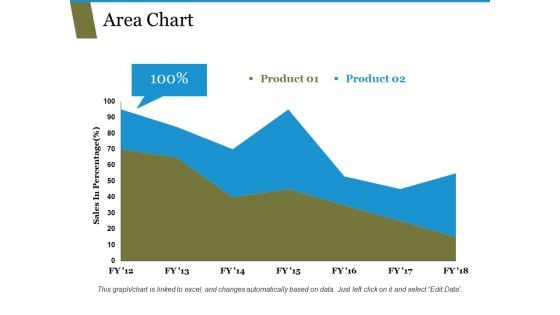
Area Chart Ppt PowerPoint Presentation Portfolio Templates
This is a area chart ppt powerpoint presentation portfolio templates. This is a two stage process. The stages in this process are sales in percentage, chart, business, marketing, finance.
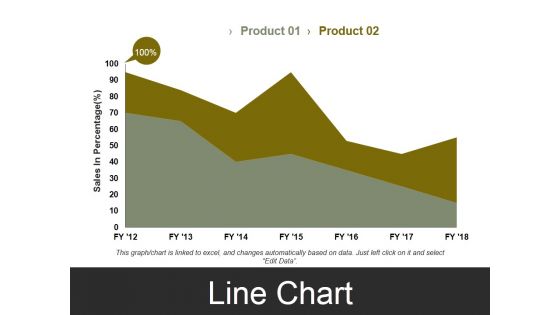
Line Chart Template 3 Ppt PowerPoint Presentation Styles Visual Aids
This is a line chart template 3 ppt powerpoint presentation styles visual aids. This is a two stage process. The stages in this process are sales in percentage, business, marketing, finance, graph.
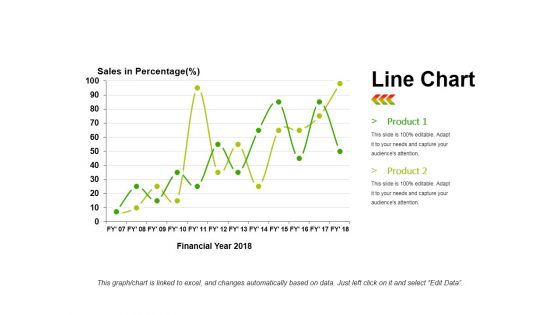
Line Chart Ppt PowerPoint Presentation Infographics Infographics
This is a line chart ppt powerpoint presentation infographics infographics. This is a two stage process. The stages in this process are product, sales in percentage, financial year, line chart, finance.
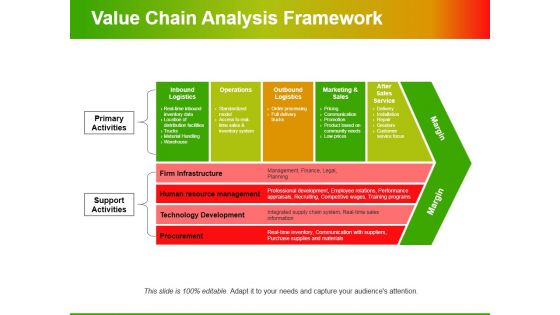
Value Chain Analysis Framework Ppt PowerPoint Presentation Infographic Template Shapes
This is a value chain analysis framework ppt powerpoint presentation infographic template shapes. This is a one stage process. The stages in this process are operations, after sales service, margin, firm infrastructure, primary activities.

Meet Our Team Ppt PowerPoint Presentation Styles File Formats
This is a meet our team ppt powerpoint presentation styles file formats. This is a three stage process. The stages in this process are sales manager, ceo, graphic designer.


 Continue with Email

 Home
Home


