Sales Dashboard
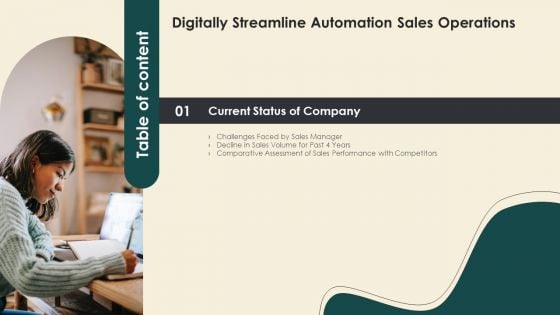
Table Of Contents Digitally Streamline Automation Sales Operations Performance Slides PDF
Presenting Table Of Contents Digitally Streamline Automation Sales Operations Performance Slides PDF to provide visual cues and insights. Share and navigate important information on six stages that need your due attention. This template can be used to pitch topics like Implementation Of Sales, Dashboard And Metrics, Sales Automation. In addtion, this PPT design contains high resolution images, graphics, etc, that are easily editable and available for immediate download.
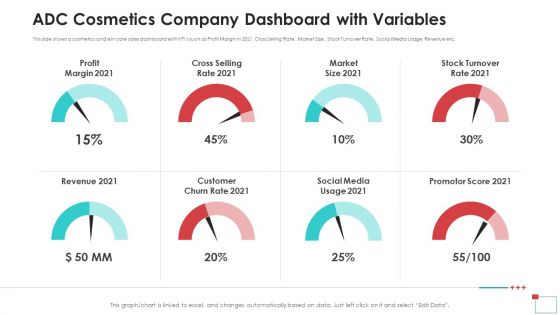
ADC Cosmetics Company Dashboard With Variables Introduction PDF
This slide shows a cosmetics and skin care sales dashboard with KPIs such as Profit Margin in 2021, Cross Selling Rate, Market Size, Stock Turnover Rate, Social Media Usage, Revenue etc. Presenting adc cosmetics company dashboard with variables introduction pdf to provide visual cues and insights. Share and navigate important information on eight stages that need your due attention. This template can be used to pitch topics like profit margin, revenue, market size, social media, promotor score. In addition, this PPT design contains high-resolution images, graphics, etc, that are easily editable and available for immediate download.
Performance Evaluation Sales And Profit Tracking Report Ideas Pdf
This slide illustrate tables that helps in tracking performance of product and also track profit margin. It includes elements such as item code, item name, quantity , total cost, total sales, gross profit and profit margin. Showcasing this set of slides titled Performance Evaluation Sales And Profit Tracking Report Ideas Pdf The topics addressed in these templates are Product Performance Dashboard, Total Sales, Gross Profit All the content presented in this PPT design is completely editable. Download it and make adjustments in color, background, font etc. as per your unique business setting. This slide illustrate tables that helps in tracking performance of product and also track profit margin. It includes elements such as item code, item name, quantity , total cost, total sales, gross profit and profit margin.
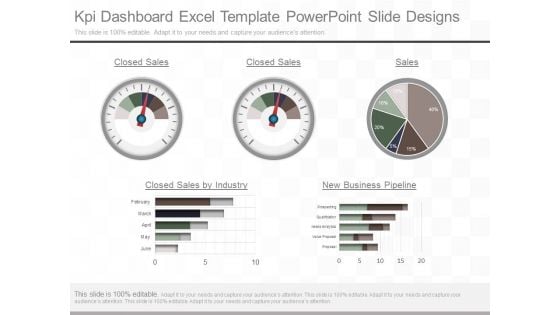
Kpi Dashboard Excel Template Powerpoint Slide Designs
This is a kpi dashboard excel template powerpoint slide designs. This is a five stage process. The stages in this process are closed sales, closed sales, sales, closed sales by industry, new business pipeline, february, march april, may, june, prospecting, qualification, needs analytics, value proposal, proposal.
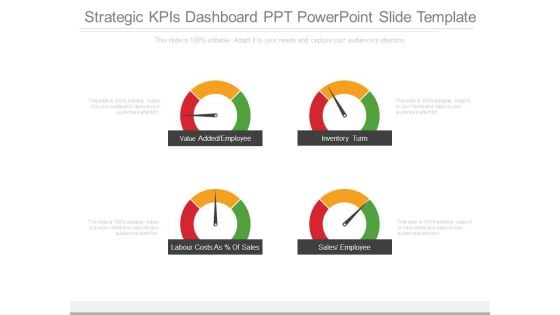
Strategic Kpis Dashboard Ppt Powerpoint Slide Template
This is a strategic kpis dashboard ppt powerpoint slide template. This is a four stage process. The stages in this process are value added employee, inventory turn, labour costs as of sales, sales employee.
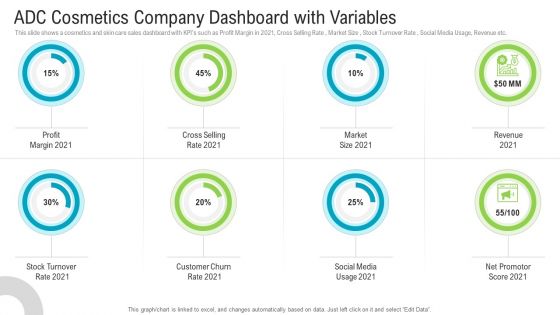
ADC Cosmetics Company Dashboard With Variables Summary PDF
This slide shows a cosmetics and skin care sales dashboard with KPIs such as Profit Margin in 2021, Cross Selling Rate , Market Size , Stock Turnover Rate , Social Media Usage, Revenue etc. Presenting adc cosmetics company dashboard with variables summary pdf to provide visual cues and insights. Share and navigate important information on eight stages that need your due attention. This template can be used to pitch topics like profit margin, cross selling rate, market size, revenue, stock turnover rate. In addtion, this PPT design contains high resolution images, graphics, etc, that are easily editable and available for immediate download.
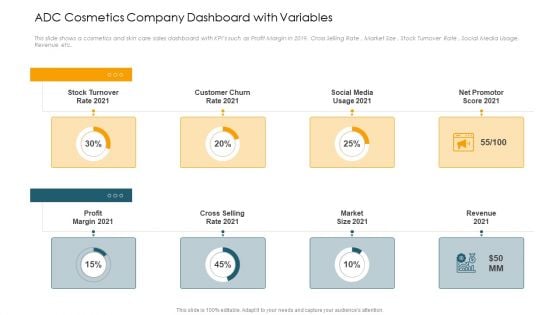
ADC Cosmetics Company Dashboard With Variables Ppt Backgrounds PDF
This slide shows a cosmetics and skin care sales dashboard with KPIs such as Profit Margin in 2019, Cross Selling Rate , Market Size , Stock Turnover Rate , Social Media Usage, Revenue etc.Presenting adc cosmetics company dashboard with variables ppt backgrounds pdf. to provide visual cues and insights. Share and navigate important information on eight stages that need your due attention. This template can be used to pitch topics like stock turnover rate 2021, social media usage 2021, net promotor score 2021. In addtion, this PPT design contains high resolution images, graphics, etc, that are easily editable and available for immediate download.
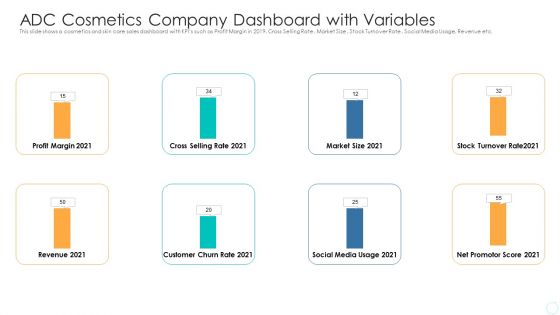
ADC Cosmetics Company Dashboard With Variables Formats PDF
This slide shows a cosmetics and skin care sales dashboard with KPIs such as Profit Margin in 2021, Cross Selling Rate , Market Size, Stock Turnover Rate , Social Media Usage, Revenue etc. Deliver an awe-inspiring pitch with this creative adc cosmetics company dashboard with variables formats pdf bundle. Topics like profit margin, cross selling rate, market size, revenue, social media can be discussed with this completely editable template. It is available for immediate download depending on the needs and requirements of the user.
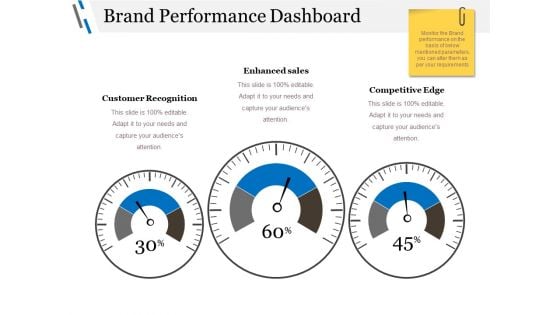
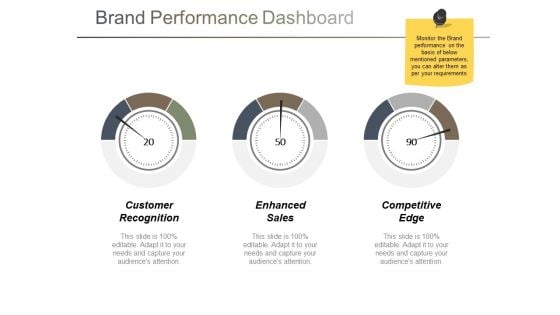
Brand Performance Dashboard Ppt PowerPoint Presentation Professional Grid
This is a brand performance dashboard ppt powerpoint presentation professional grid. This is a three stage process. The stages in this process are customer recognition, enhanced sales, competitive edge, dashboard, business.
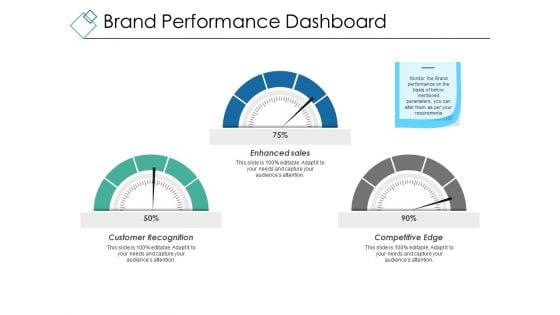
Brand Performance Dashboard Ppt PowerPoint Presentation Layouts Summary
This is a brand performance dashboard ppt powerpoint presentation layouts summary. This is a three stage process. The stages in this process are customer recognition, enhanced sales, competitive edge, dashboard, business.
Brand Performance Dashboard Ppt PowerPoint Presentation Show Graphic Tips
This is a brand performance dashboard ppt powerpoint presentation show graphic tips. This is a three stage process. The stages in this process are customer recognition, enhanced sales, competitive edge, dashboard, business, percentage.
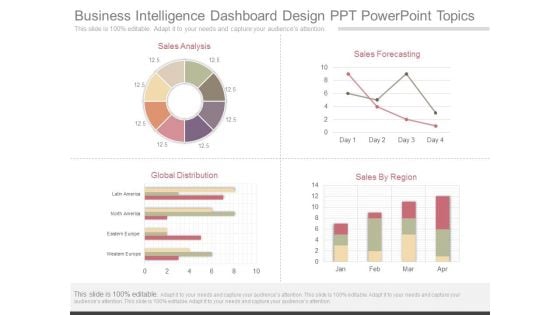
Business Intelligence Dashboard Design Ppt Powerpoint Topics
This is a business intelligence dashboard design ppt powerpoint topics. This is a four stage process. The stages in this process are sales analysis, sales forecasting, global distribution, sales by region, latin america, north america, eastern europe, western europe.
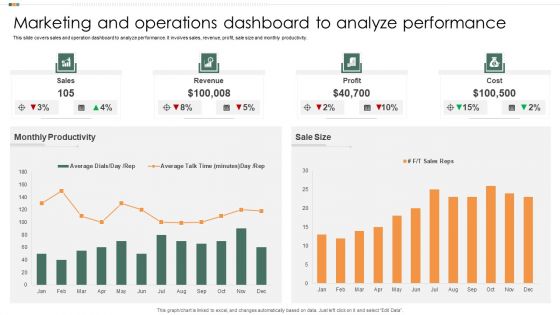
Marketing And Operations Dashboard To Analyze Performance Infographics PDF
This slide covers sales and operation dashboard to analyze performance. It involves sales, revenue, profit, sale size and monthly productivity. Showcasing this set of slides titled Marketing And Operations Dashboard To Analyze Performance Infographics PDF. The topics addressed in these templates are Monthly Productivity, Sales, Revenue. All the content presented in this PPT design is completely editable. Download it and make adjustments in color, background, font etc. as per your unique business setting.
Shipment Tracking Solutions To Minimize Decline Of Sales Demonstration PDF
Following slide presents digital solutions for warehouse management that can be implemented by managers to streamline inventory management and reduce lost sales. Major solutions are radio frequency handheld device, dashboard, data analytics, trailer management etc. Persuade your audience using this Shipment Tracking Solutions To Minimize Decline Of Sales Demonstration PDF. This PPT design covers six stages, thus making it a great tool to use. It also caters to a variety of topics including Dashboard, Trailer Management, Advanced Solutions. Download this PPT design now to present a convincing pitch that not only emphasizes the topic but also showcases your presentation skills.
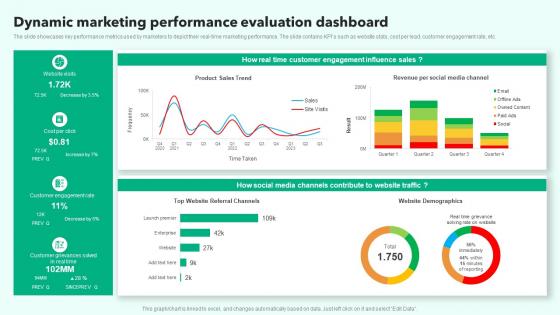
Dynamic Marketing Performance Evaluation Dashboard Microsoft Pdf
The slide showcases key performance metrics used by marketers to depict their real time marketing performance. The slide contains KPIs such as website stats, cost per lead, customer engagement rate, etc. Pitch your topic with ease and precision using this Dynamic Marketing Performance Evaluation Dashboard Microsoft Pdf. This layout presents information on Influence Sales, Customer Engagement, Customer Engagement Rate. It is also available for immediate download and adjustment. So, changes can be made in the color, design, graphics or any other component to create a unique layout. The slide showcases key performance metrics used by marketers to depict their real time marketing performance. The slide contains KPIs such as website stats, cost per lead, customer engagement rate, etc.
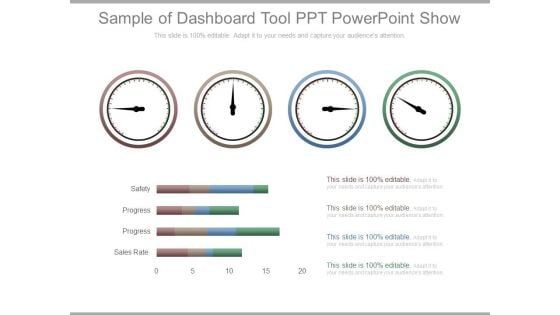
Sample Of Dashboard Tool Ppt Powerpoint Show
This is a sample of dashboard tool ppt powerpoint show. This is a four stage process. The stages in this process are safety, progress, sales rate.
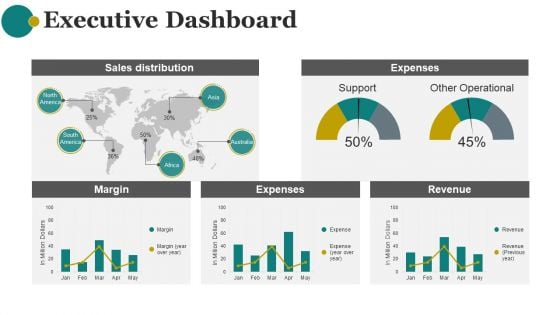
Executive Dashboard Ppt PowerPoint Presentation Graphics
This is a executive dashboard ppt powerpoint presentation graphics. This is a five stage process. The stages in this process are sales distribution, expenses, margin, expenses, revenue.
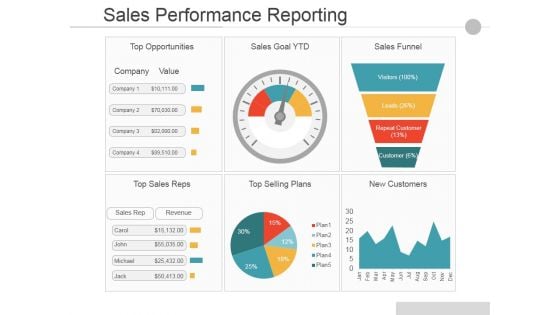
Sales Performance Reporting Ppt PowerPoint Presentation Infographics Portrait
This is a Sales Performance Reporting Ppt PowerPoint Presentation Infographics Portrait. This is a six stage process. The stages in this process are Top Opportunities, Sales Goal Ytd, Sales Funnel, Top Sales Reps, Top Selling Plans, New Customers.
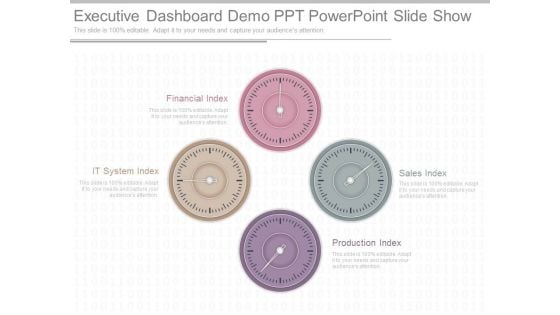
Executive Dashboard Demo Ppt Powerpoint Slide Show
This is a executive dashboard demo ppt powerpoint slide show. This is a four stage process. The stages in this process are financial index, it system index, production index, sales index.
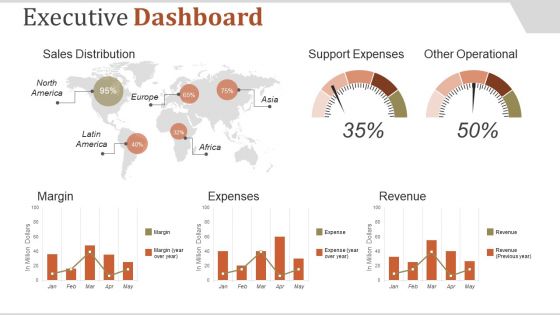
Executive Dashboard Ppt PowerPoint Presentation Introduction
This is a executive dashboard ppt powerpoint presentation introduction. This is a five stage process. The stages in this process are sales distribution, support expenses, other operational, margin, expenses.
Social Media Performance Tracking Sales Performance Enhancement Infographics Pdf
The following slide showcases a dashboard to track and measure social media platforms performance. It includes key elements such as website traffic, social media referral rate, site revenue, social media site revenue, etc. Here you can discover an assortment of the finest PowerPoint and Google Slides templates. With these templates, you can create presentations for a variety of purposes while simultaneously providing your audience with an eye catching visual experience. Download Social Media Performance Tracking Sales Performance Enhancement Infographics Pdf to deliver an impeccable presentation. These templates will make your job of preparing presentations much quicker, yet still, maintain a high level of quality. Slidegeeks has experienced researchers who prepare these templates and write high quality content for you. Later on, you can personalize the content by editing the Social Media Performance Tracking Sales Performance Enhancement Infographics Pdf. The following slide showcases a dashboard to track and measure social media platforms performance. It includes key elements such as website traffic, social media referral rate, site revenue, social media site revenue, etc.

Dashboard Ppt PowerPoint Presentation Ideas Graphics Pictures
Presenting this set of slides with name dashboard ppt powerpoint presentation ideas graphics pictures. The topics discussed in these slides are ytd sales vs yr sm, net sales vs last yr sm, net sales vs last yr sm. This is a completely editable PowerPoint presentation and is available for immediate download. Download now and impress your audience.
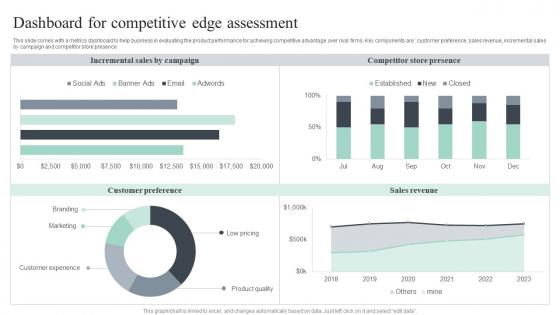
Dashboard For Competitive Edge Assessment Themes Pdf
This slide comes with a metrics dashboard to help business in evaluating the product performance for achieving competitive advantage over rival firms. Key components are customer preference, sales revenue, incremental sales by campaign and competitor store presence Pitch your topic with ease and precision using this Dashboard For Competitive Edge Assessment Themes Pdf. This layout presents information on Incremental Sales, Competitor Store Presence, Sales Revenue. It is also available for immediate download and adjustment. So, changes can be made in the color, design, graphics or any other component to create a unique layout. This slide comes with a metrics dashboard to help business in evaluating the product performance for achieving competitive advantage over rival firms. Key components are customer preference, sales revenue, incremental sales by campaign and competitor store presence
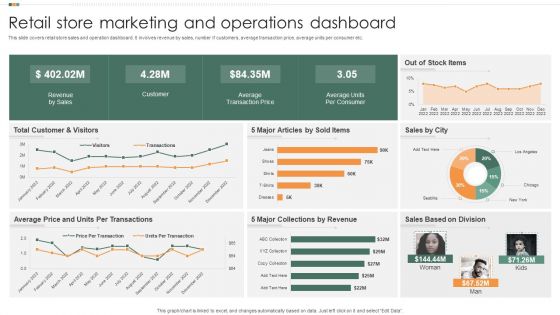
Retail Store Marketing And Operations Dashboard Mockup PDF
This slide covers retail store sales and operation dashboard. It involves revenue by sales, number if customers, average transaction price, average units per consumer etc. Pitch your topic with ease and precision using this Retail Store Marketing And Operations Dashboard Mockup PDF. This layout presents information on Revenue By Sales, Customer, Average Transaction Price. It is also available for immediate download and adjustment. So, changes can be made in the color, design, graphics or any other component to create a unique layout.
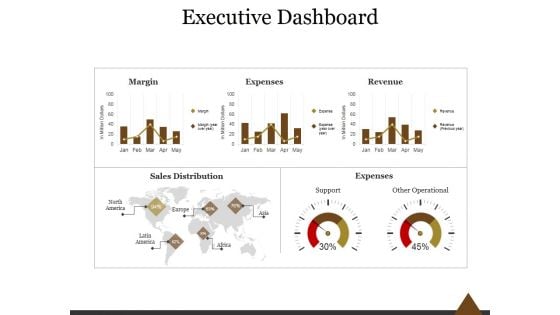
Executive Dashboard Ppt PowerPoint Presentation Professional
This is a executive dashboard ppt powerpoint presentation professional. This is a five stage process. The stages in this process are margin, expenses, revenue, sales distribution, expenses, support, other operational.
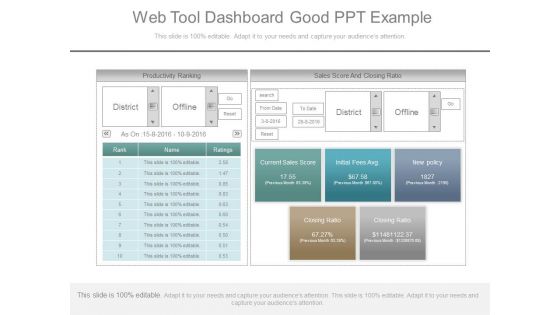
Web Tool Dashboard Good Ppt Example
This is a web tool dashboard good ppt example. This is a two stage process. The stages in this process are productivity ranking, district, offline, go, reset, rank, name, ratings, sales score and closing ratio, search, from date, to date, current sales score, initial fees avg, new policy, previous month, closing ratio, as on.
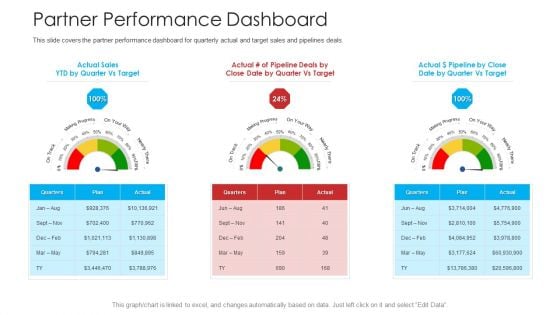
Retailer Channel Partner Boot Camp Partner Performance Dashboard Sample PDF
This slide covers the partner performance dashboard for quarterly actual and target sales and pipelines deals. Presenting retailer channel partner boot camp partner performance dashboard sample pdf to provide visual cues and insights. Share and navigate important information on three stages that need your due attention. This template can be used to pitch topics like performance dashboard, target sales, marketing progress. In addition, this PPT design contains high-resolution images, graphics, etc, that are easily editable and available for immediate download.
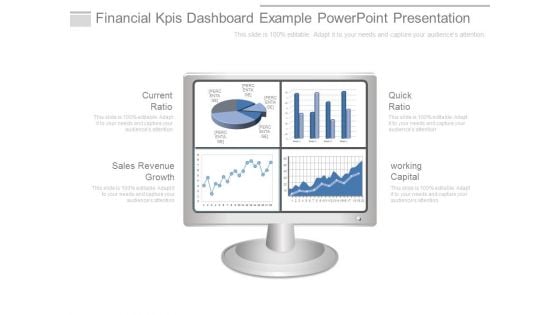
Financial Kpis Dashboard Example Powerpoint Presentation
This is a financial kpis dashboard example powerpoint presentation. This is a four stage process. The stages in this process are current ratio, sales revenue growth, quick ratio, working capital.
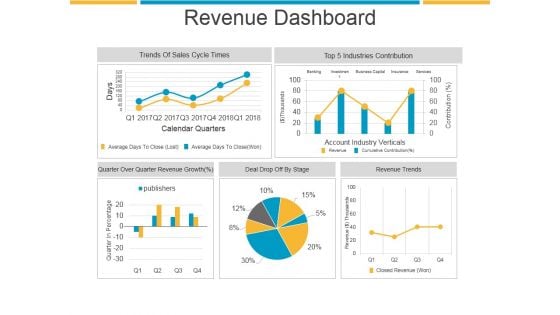
Revenue Dashboard Ppt PowerPoint Presentation Sample
This is a revenue dashboard ppt powerpoint presentation sample. This is a five stage process. The stages in this process are trends of sales cycle times, industries contribution, revenue trends, deal drop off by stage.
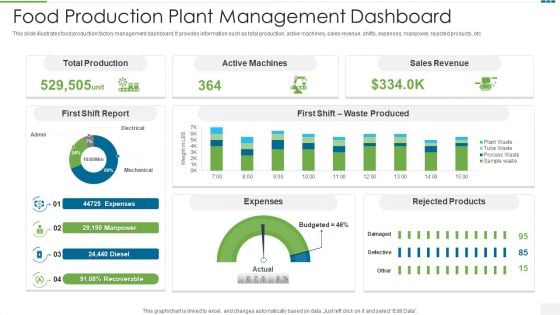
Food Production Plant Management Dashboard Clipart PDF
This slide illustrates food production factory management dashboard. It provides information such as total production, active machines, sales revenue, shifts, expenses, manpower, rejected products, etc.Pitch your topic with ease and precision using this food production plant management dashboard clipart pdf This layout presents information on total production, active machines, sales revenue It is also available for immediate download and adjustment. So, changes can be made in the color, design, graphics or any other component to create a unique layout.
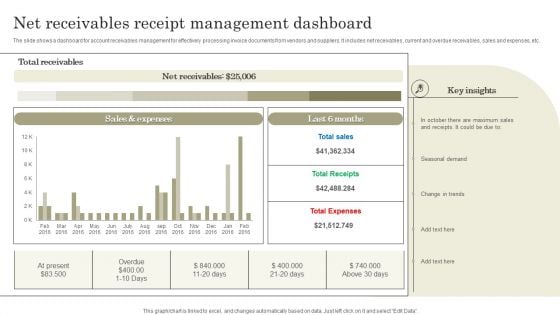
Net Receivables Receipt Management Dashboard Information PDF
The slide shows a dashboard for account receivables management for effectively processing invoice documents from vendors and suppliers. It includes net receivables, current and overdue receivables, sales and expenses, etc. Showcasing this set of slides titled Net Receivables Receipt Management Dashboard Information PDF. The topics addressed in these templates are Total sales, Total Receipts, Total Expenses. All the content presented in this PPT design is completely editable. Download it and make adjustments in color, background, font etc. as per your unique business setting.
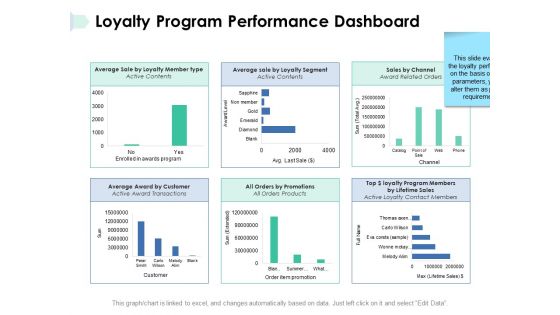
Loyalty Program Performance Dashboard Ppt PowerPoint Presentation File Microsoft
Presenting this set of slides with name loyalty program performance dashboard ppt powerpoint presentation file microsoft. The topics discussed in these slides are average sale, performance dashboard, customer, loyalty segment. This is a completely editable PowerPoint presentation and is available for immediate download. Download now and impress your audience.
Loyalty Program Performance Dashboard Ppt PowerPoint Presentation File Show
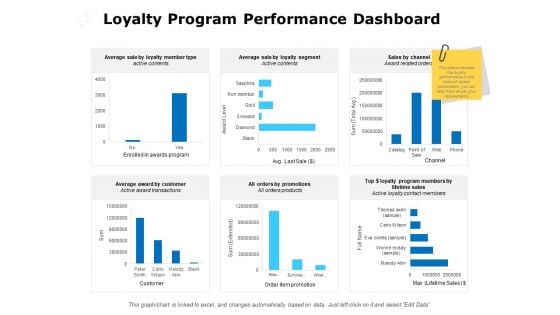
Presenting this set of slides with name loyalty program performance dashboard ppt powerpoint presentation file show. The topics discussed in these slides are average sale, performance dashboard, customer, loyalty segment. This is a completely editable PowerPoint presentation and is available for immediate download. Download now and impress your audience.
Loyalty Program Performance Dashboard Ppt PowerPoint Presentation Outline Structure
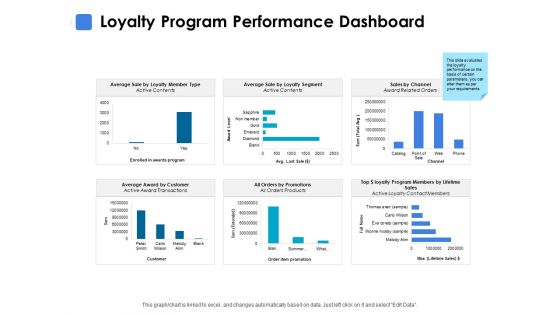
Presenting this set of slides with name loyalty program performance dashboard ppt powerpoint presentation outline structure. The topics discussed in these slides are average sale, performance dashboard, customer, loyalty segment. This is a completely editable PowerPoint presentation and is available for immediate download. Download now and impress your audience.
Retail For Expenditure Dashboard Budget Designs PDF
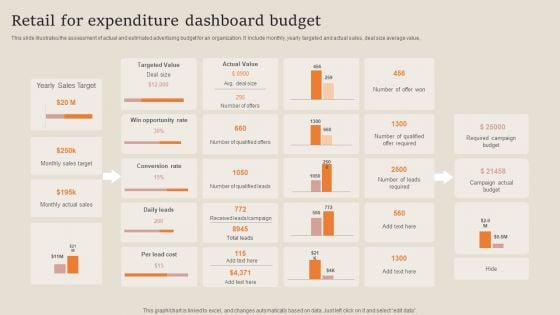
This slide illustrates the assessment of actual and estimated advertising budget for an organization. It include monthly, yearly targeted and actual sales, deal size average value, Showcasing this set of slides titled Retail For Expenditure Dashboard Budget Designs PDF. The topics addressed in these templates are Sales Target, Opportunity Rate, Required Campaign Budget. All the content presented in this PPT design is completely editable. Download it and make adjustments in color, background, font etc. as per your unique business setting.
Company Department Cultural Dashboard Formats PDF
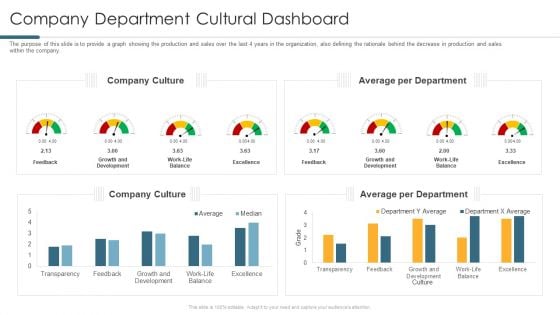
The purpose of this slide is to provide a graph showing the production and sales over the last 4 years in the organization, also defining the rationale behind the decrease in production and sales within the company. Deliver an awe inspiring pitch with this creative company department cultural dashboard formats pdf bundle. Topics like average per department, company culture can be discussed with this completely editable template. It is available for immediate download depending on the needs and requirements of the user.
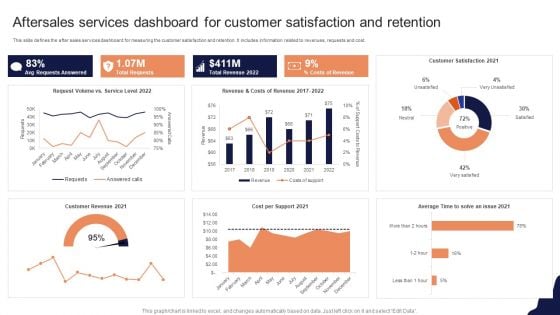
Aftersales Services Dashboard For Customer Satisfaction And Retention Template PDF
This slide defines the after sales services dashboard for measuring the customer satisfaction and retention. It includes information related to revenues, requests and cost.Showcasing this set of slides titled Aftersales Services Dashboard For Customer Satisfaction And Retention Template PDF The topics addressed in these templates are Requests Answered, Total Requests, Customer Satisfaction All the content presented in this PPT design is completely editable. Download it and make adjustments in color, background, font etc. as per your unique business setting.
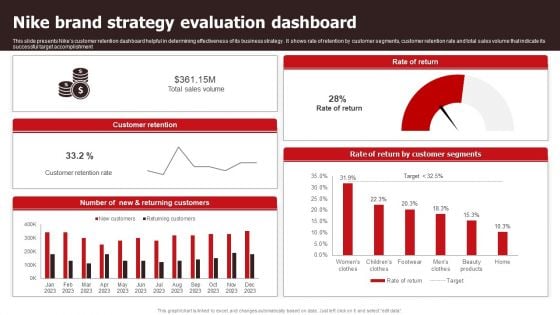
Nike Brand Strategy Evaluation Dashboard Sample PDF
This slide presents Nikes customer retention dashboard helpful in determining effectiveness of its business strategy . It shows rate of retention by customer segments, customer retention rate and total sales volume that indicate its successful target accomplishment. Showcasing this set of slides titled Nike Brand Strategy Evaluation Dashboard Sample PDF. The topics addressed in these templates are Sales Volume, Customer Retention Rate . All the content presented in this PPT design is completely editable. Download it and make adjustments in color, background, font etc. as per your unique business setting.
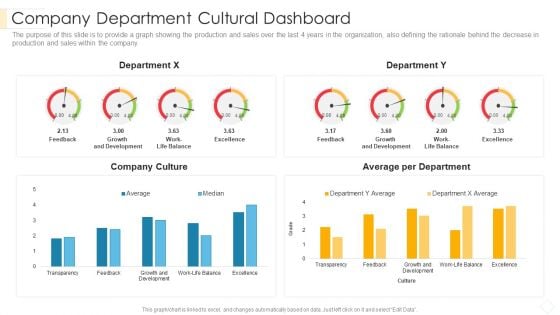
Company Department Cultural Dashboard Pictures PDF
The purpose of this slide is to provide a graph showing the production and sales over the last 4 years in the organization, also defining the rationale behind the decrease in production and sales within the company.Deliver an awe inspiring pitch with this creative company department cultural dashboard pictures pdf bundle. Topics like company culture, average per department, growth and development can be discussed with this completely editable template. It is available for immediate download depending on the needs and requirements of the user.
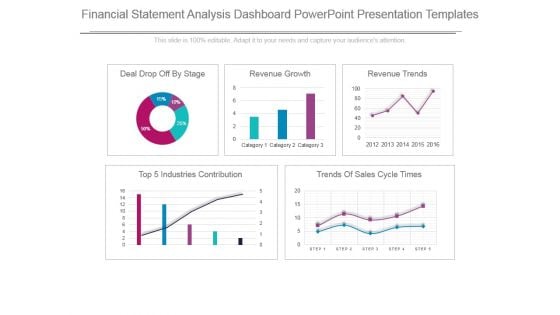
Financial Statement Analysis Dashboard Powerpoint Presentation Templates
This is a financial statement analysis dashboard powerpoint presentation templates. This is a five stage process. The stages in this process are deal drop off by stage, revenue growth, revenue trends, top 5 industries contribution, trends of sales cycle times, category.

Balance Scorecard Index Dashboard Ppt Slides
This is a balance scorecard index dashboard ppt slides. This is a one stage process. The stages in this process are sales by month, gross revenue, customer retention, executive scorecard, measures, status, trend, financial, option, customer, internal processes, learning and growth.
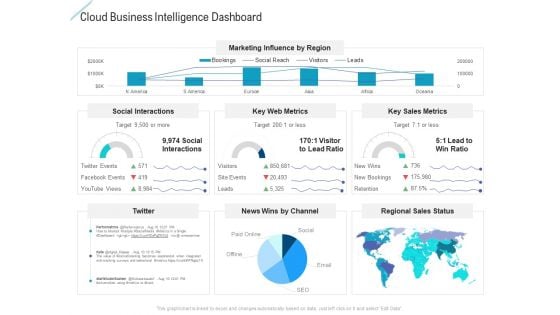
Cloud Business Intelligence Dashboard Graphics PDF
Deliver and pitch your topic in the best possible manner with this cloud business intelligence dashboard graphics pdf. Use them to share invaluable insights on social interactions, key web metrics, key sales metrics and impress your audience. This template can be altered and modified as per your expectations. So, grab it now.
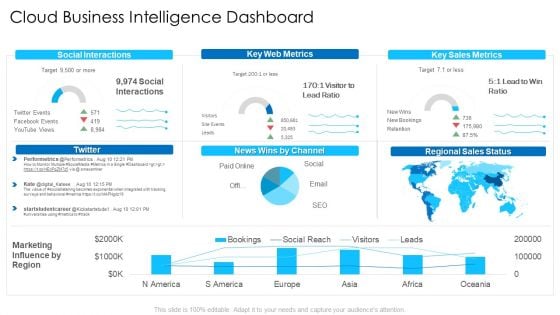
Cloud Business Intelligence Dashboard Microsoft PDF
Deliver an awe inspiring pitch with this creative cloud business intelligence dashboard microsoft pdf bundle. Topics like social interactions, key web metrics, regional sales status can be discussed with this completely editable template. It is available for immediate download depending on the needs and requirements of the user.
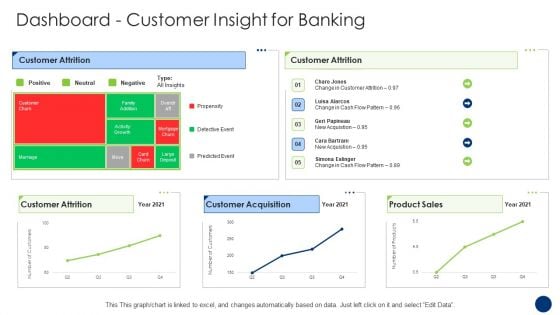
Dashboard Customer Insight For Banking Brochure PDF
Deliver and pitch your topic in the best possible manner with this dashboard customer insight for banking brochure pdf. Use them to share invaluable insights on customer attrition, customer acquisition, product sales and impress your audience. This template can be altered and modified as per your expectations. So, grab it now.
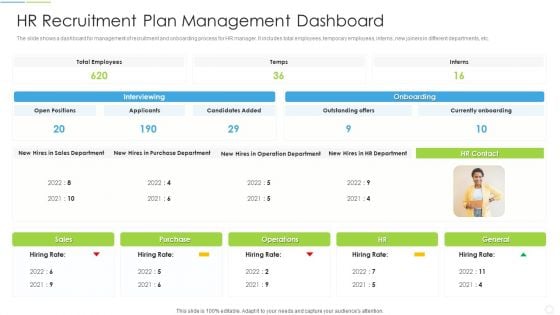
HR Recruitment Plan Management Dashboard Graphics PDF
Showcasing this set of slides titled HR Recruitment Plan Management Dashboard Graphics PDF The topics addressed in these templates are Interviewing, Currently Onboarding, Sales Department All the content presented in this PPT design is completely editable. Download it and make adjustments in color, background, font etc. as per your unique business setting.
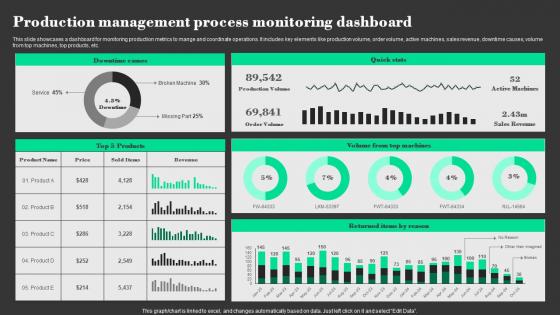
Production Management Process Monitoring Dashboard Designs Pdf
This slide showcases a dashboard for monitoring production metrics to mange and coordinate operations. It includes key elements like production volume, order volume, active machines, sales revenue, downtime causes, volume from top machines, top products, etc. Showcasing this set of slides titled Production Management Process Monitoring Dashboard Designs Pdf The topics addressed in these templates are Downtime Causes, Products, Volume From Top Machines All the content presented in this PPT design is completely editable. Download it and make adjustments in color, background, font etc. as per your unique business setting. This slide showcases a dashboard for monitoring production metrics to mange and coordinate operations. It includes key elements like production volume, order volume, active machines, sales revenue, downtime causes, volume from top machines, top products, etc.
Tracking Purchase Insights Using Hyper Personalization Dashboard
Present like a pro with Tracking Purchase Insights Using Hyper Personalization Dashboard. Create beautiful presentations together with your team, using our easy-to-use presentation slides. Share your ideas in real-time and make changes on the fly by downloading our templates. So whether you are in the office, on the go, or in a remote location, you can stay in sync with your team and present your ideas with confidence. With Slidegeeks presentation got a whole lot easier. Grab these presentations today. This slide showcases a KPI dashboard for hyper-personalization for tracking purchase insights. It includes metrics such as projected user interaction, traffic origins, equipment type, and countries.
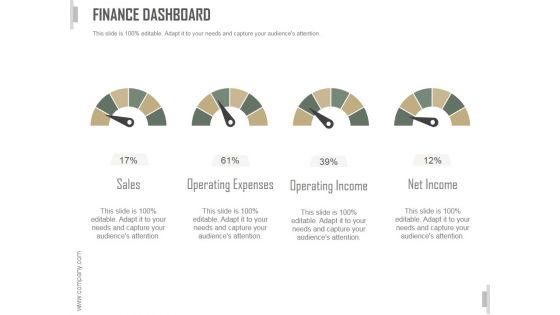
Finance Dashboard Ppt PowerPoint Presentation Clipart
This is a finance dashboard ppt powerpoint presentation clipart. This is a four stage process. The stages in this process are sales, operating expenses, operating income, net income.
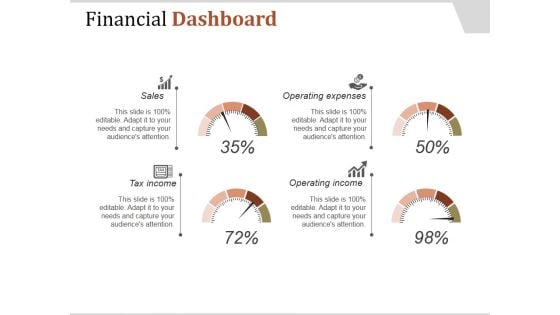
Financial Dashboard Ppt PowerPoint Presentation Influencers
This is a financial dashboard ppt powerpoint presentation influencers. This is a four stage process. The stages in this process are sales, tax income, operating income, operating expenses.
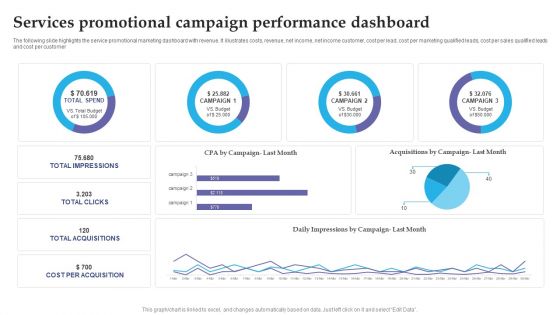
Services Promotional Campaign Performance Dashboard Slides PDF
The following slide highlights the service promotional marketing dashboard with revenue. It illustrates costs, revenue, net income, net income customer, cost per lead, cost per marketing qualified leads, cost per sales qualified leads and cost per customer. Pitch your topic with ease and precision using this Services Promotional Campaign Performance Dashboard Slides PDF. This layout presents information on Services Promotional, Campaign Performance Dashboard. It is also available for immediate download and adjustment. So, changes can be made in the color, design, graphics or any other component to create a unique layout.

Sample Kpi Dashboard Ppt Sample Presentations
This is a sample kpi dashboard ppt sample presentations. This is a four stage process. The stages in this process are sales, market, budget, people.
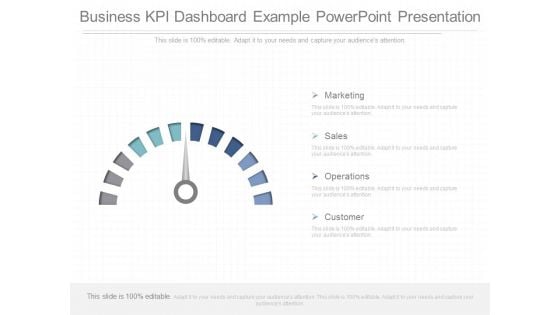
Business Kpi Dashboard Example Powerpoint Presentation
This is a business kpi dashboard example powerpoint presentation. This is a four stage process. The stages in this process are marketing, sales, operations, customer.
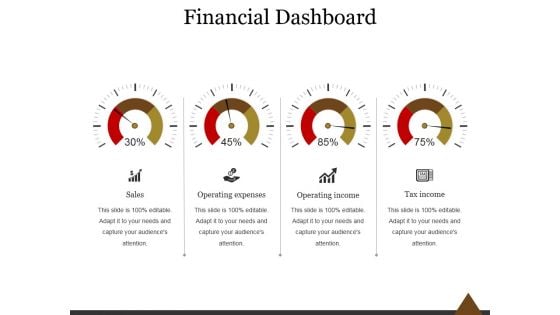
Financial Dashboard Ppt PowerPoint Presentation Information
This is a financial dashboard ppt powerpoint presentation information. This is a four stage process. The stages in this process are sales, operating expenses, operating income, tax income.
Overall Brand Performance Tracking Dashboard Microsoft PDF
This slide provides information regarding brand performance tracking dashboard capturing KPIs such as brand metric, brand commitment, advertising metrics, and purchase metrics. Slidegeeks is here to make your presentations a breeze with Overall Brand Performance Tracking Dashboard Microsoft PDF With our easy to use and customizable templates, you can focus on delivering your ideas rather than worrying about formatting. With a variety of designs to choose from, you are sure to find one that suits your needs. And with animations and unique photos, illustrations, and fonts, you can make your presentation pop. So whether you are giving a sales pitch or presenting to the board, make sure to check out Slidegeeks first.
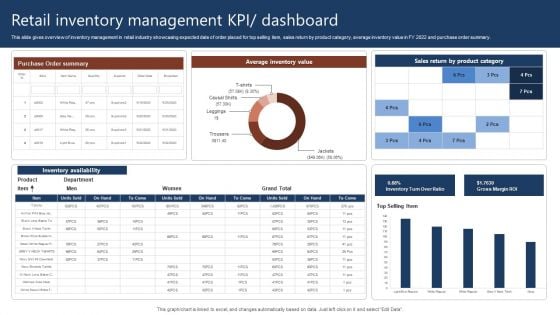
Retail Inventory Management Kpi Dashboard Rules PDF
This slide gives overview of inventory management in retail industry showcasing expected date of order placed for top selling item, sales return by product category, average inventory value in FY 2022 and purchase order summary. Pitch your topic with ease and precision using this Retail Inventory Management Kpi Dashboard Rules PDF. This layout presents information on Retail Inventory Management, Dashboard. It is also available for immediate download and adjustment. So, changes can be made in the color, design, graphics or any other component to create a unique layout.
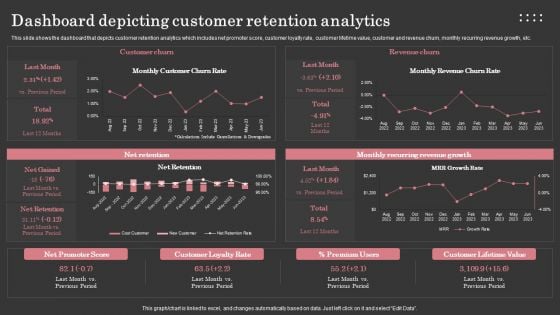
Dashboard Depicting Customer Retention Analytics Background PDF
This slide shows the dashboard that depicts customer retention analytics which includes net promoter score, customer loyalty rate, customer lifetime value, customer and revenue churn, monthly recurring revenue growth, etc. Make sure to capture your audiences attention in your business displays with our gratis customizable Dashboard Depicting Customer Retention Analytics Background PDF. These are great for business strategies, office conferences, capital raising or task suggestions. If you desire to acquire more customers for your tech business and ensure they stay satisfied, create your own sales presentation with these plain slides.
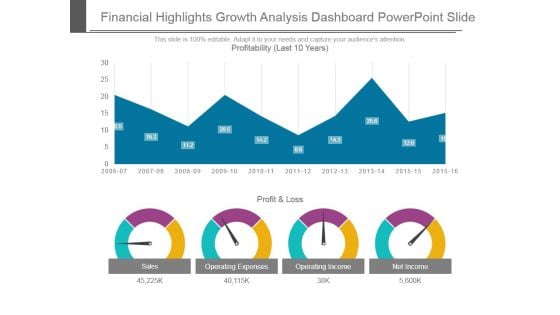
Financial Highlights Growth Analysis Dashboard Powerpoint Slide
This is a financial highlights growth analysis dashboard powerpoint slide. This is a four stage process. The stages in this process are profit and loss, sales, operating expenses, operating income, net income, profitability.
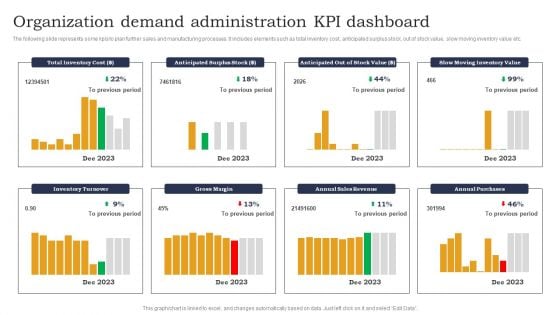
Organization Demand Administration KPI Dashboard Designs PDF
The following slide represents some kpis to plan further sales and manufacturing processes. It includes elements such as total inventory cost, anticipated surplus stock, out of stock value, slow moving inventory value etc. Pitch your topic with ease and precision using this Organization Demand Administration KPI Dashboard Designs PDF. This layout presents information on Anticipated Surplus Stock, Out Of Stock, Slow Moving Inventory. It is also available for immediate download and adjustment. So, changes can be made in the color, design, graphics or any other component to create a unique layout.
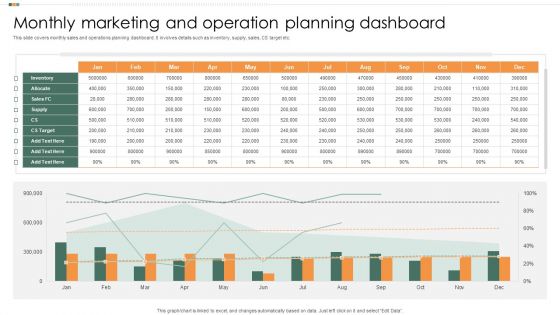
Monthly Marketing And Operation Planning Dashboard Rules PDF
This slide covers monthly sales and operations planning dashboard. It involves details such as inventory, supply, sales, CS target etc. Showcasing this set of slides titled Monthly Marketing And Operation Planning Dashboard Rules PDF. The topics addressed in these templates are Target, Sales, Supply. All the content presented in this PPT design is completely editable. Download it and make adjustments in color, background, font etc. as per your unique business setting.
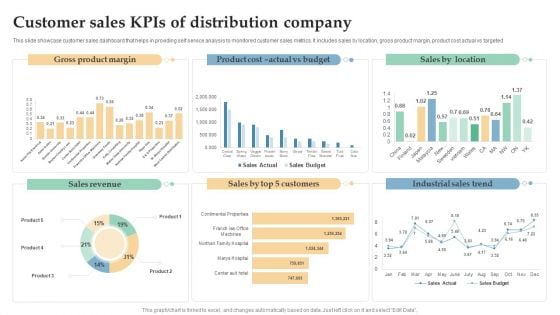
Customer Sales Kpis Of Distribution Company Ppt Infographic Template Templates PDF
This slide showcase customer sales dashboard that helps in providing self service analysis to monitored customer sales metrics. It includes sales by location, gross product margin, product cost actual vs targeted. Showcasing this set of slides titled Customer Sales Kpis Of Distribution Company Ppt Infographic Template Templates PDF. The topics addressed in these templates are Gross Product Margin, Sales Revenue, Industrial Sales Trend. All the content presented in this PPT design is completely editable. Download it and make adjustments in color, background, font etc. as per your unique business setting.


 Continue with Email

 Home
Home


