Sales Graph

Graphical Representation Of Personal Interests Ppt PowerPoint Presentation Pictures Designs Download
Presenting this set of slides with name graphical representation of personal interests ppt powerpoint presentation pictures designs download. This is a five stage process. The stages in this process are people graph, sales performance, population data demographics. This is a completely editable PowerPoint presentation and is available for immediate download. Download now and impress your audience.
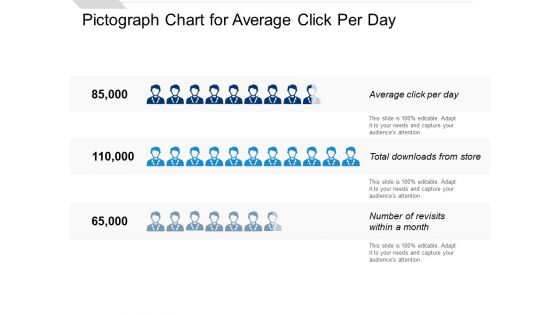
Pictograph Chart For Average Click Per Day Ppt PowerPoint Presentation Slides Format
Presenting this set of slides with name pictograph chart for average click per day ppt powerpoint presentation slides format. This is a three stage process. The stages in this process are people graph, sales performance, population data demographics. This is a completely editable PowerPoint presentation and is available for immediate download. Download now and impress your audience.

Population Data Demographics Yearly Representation Ppt PowerPoint Presentation Ideas Layout
Presenting this set of slides with name population data demographics yearly representation ppt powerpoint presentation ideas layout. This is a four stage process. The stages in this process are people graph, sales performance, population data demographics. This is a completely editable PowerPoint presentation and is available for immediate download. Download now and impress your audience.
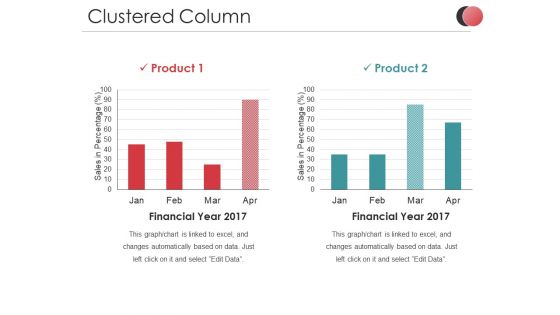
Clustered Column Ppt PowerPoint Presentation Slides Ideas
This is a clustered column ppt powerpoint presentation slides ideas. This is a two stage process. The stages in this process are sales in percentage, business, marketing, finance, graph.
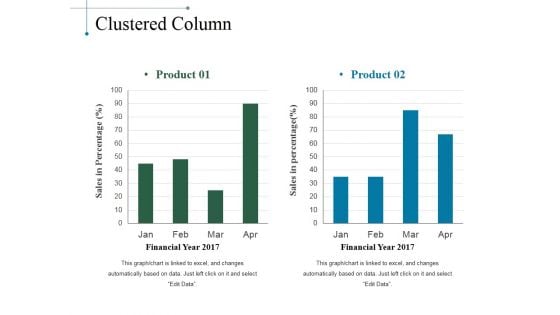
Clustered Column Ppt PowerPoint Presentation Slides Smartart
This is a clustered column ppt powerpoint presentation slides smartart. This is a two stage process. The stages in this process are product, sales in percentage, financial year, bar graph.
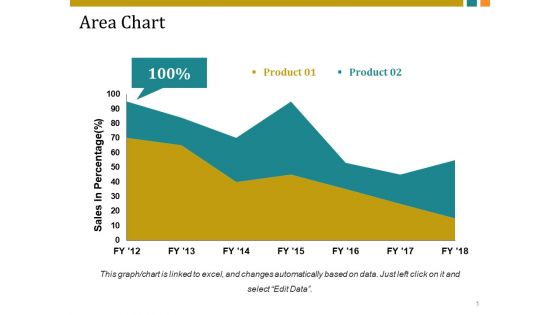
Area Chart Ppt PowerPoint Presentation Professional Brochure
This is a area chart ppt powerpoint presentation professional brochure. This is a two stage process. The stages in this process are sales in percentage, business, marketing, finance, graph.
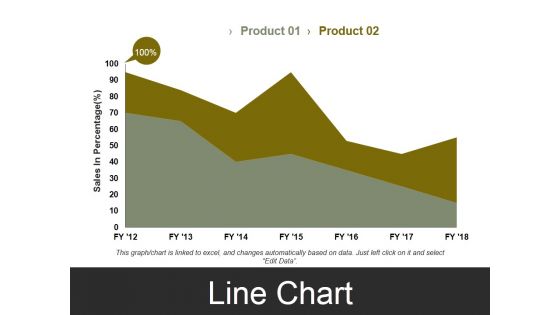
Line Chart Template 3 Ppt PowerPoint Presentation Styles Visual Aids
This is a line chart template 3 ppt powerpoint presentation styles visual aids. This is a two stage process. The stages in this process are sales in percentage, business, marketing, finance, graph.
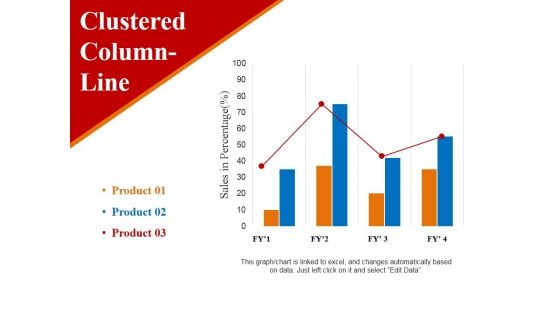
clustered column line ppt powerpoint presentation ideas example
This is a clustered column line ppt powerpoint presentation ideas example. This is a three stage process. The stages in this process are sales in percentage, business, marketing, finance, graph.
Bar Chart Ppt PowerPoint Presentation Icon Information
This is a bar chart ppt powerpoint presentation icon information. This is a one stage process. The stages in this process are product, sales in percentage, financial years, bar graph, growth.
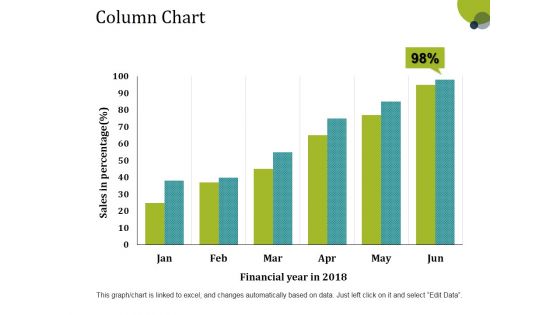
Column Chart Ppt PowerPoint Presentation Layouts Tips
This is a column chart ppt powerpoint presentation layouts tips. This is a six stage process. The stages in this process are sales in percentage, financial year, bar graph, growth, success.
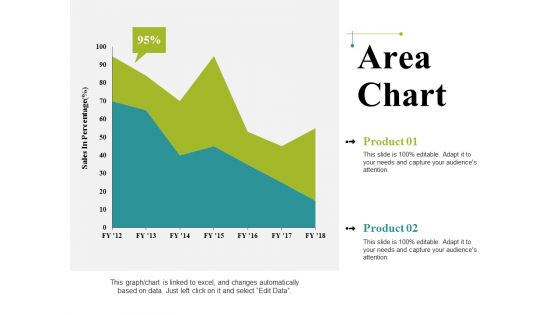
Area Chart Ppt PowerPoint Presentation Infographics Graphics Pictures
This is a area chart ppt powerpoint presentation infographics graphics pictures. This is a two stage process. The stages in this process are business, sales in percentage, area chart, marketing, graph.
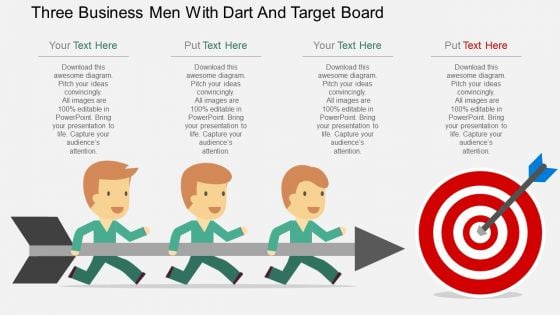
Three Business Men With Dart And Target Board PowerPoint Template
In this fast moving world, every organization and business is working hard to achieve their goals. What better way could be to portray to your clients and customer that your company is working at its best and in an organized manner to deliver the unexcelled. This will help you gain the trust of your investors, clients and employees. All organizations and companies are judged on their performance and this slide is all about success, good performance and satisfaction. You can also use this template to lay emphasis on teamwork and the importance of coordination between different departments for achieving the set of goals. The arrow being carried by three happy men denotes progress being carried out by the teams in an effort to attain the highest standard of satisfaction from their work.

Gold Chart Business PowerPoint Template 0810
3D gold growth graph with world map. All in gold. Take control with our Gold Chart Business PowerPoint Template 0810. Do not be fatalistic in your approach.
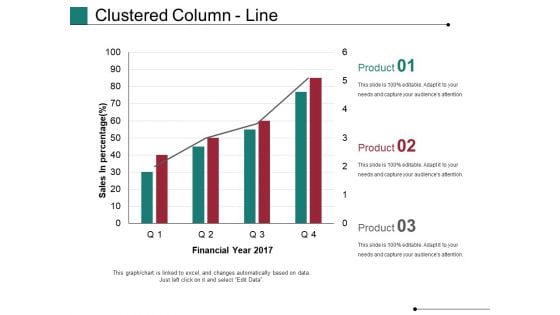
Clustered Column Line Ppt PowerPoint Presentation Model Rules
This is a clustered column line ppt powerpoint presentation model rules. This is a four stage process. The stages in this process are financial year, sales in percentage, business, marketing, growth, graph.
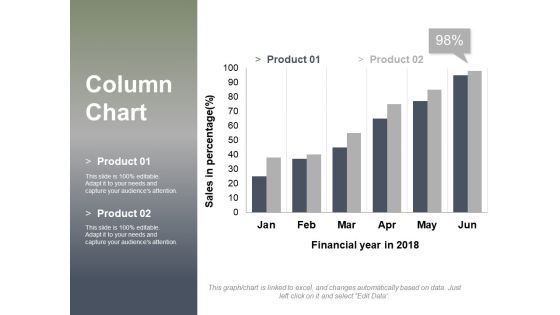
Column Chart Ppt PowerPoint Presentation Layouts Design Inspiration
This is a column chart ppt powerpoint presentation layouts design inspiration. This is a two stage process. The stages in this process are sales in percentage, financial year in, graph, business, finance, marketing.
Pie Chart Business PowerPoint Templates And PowerPoint Backgrounds 0411
Microsoft PowerPoint Template and Background with rendering of pie graph on white background Get success delivered on a platter with our Pie Chart Business PowerPoint Templates And PowerPoint Backgrounds 0411. Dont pass up this opportunity to shine.

Explosive Growth Chart Finance PowerPoint Templates And PowerPoint Backgrounds 0611
Microsoft PowerPoint Template and Background with cash-flow statement with business graph and stock chart over an explosion Our Explosive Growth Chart Finance PowerPoint Templates And PowerPoint Backgrounds 0611 believe in fidelity. They will abide by your faith in them.
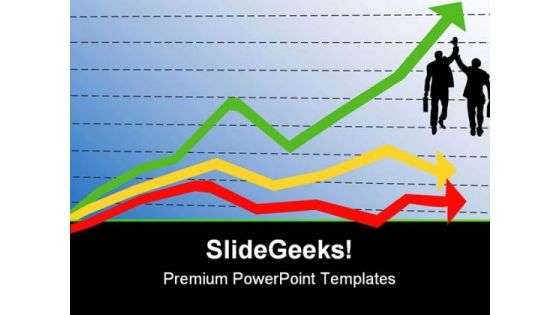
Out Beating Competitors Business PowerPoint Templates And PowerPoint Backgrounds 0711
Microsoft PowerPoint Template and Background with line graph indicating the winer out beating two competitors Critique plans with our Out Beating Competitors Business PowerPoint Templates And PowerPoint Backgrounds 0711. Download without worries with our money back guaranteee.
Colorful Bar Chart Business PowerPoint Templates And PowerPoint Backgrounds 0811
Microsoft PowerPoint Template and Background with of a three-dimensional multi-colored bar graph on a white background Address baseless allegations with our Colorful Bar Chart Business PowerPoint Templates And PowerPoint Backgrounds 0811. Give appropriate answers to clear all doubts.

Business Diagram Success PowerPoint Templates And PowerPoint Backgrounds 1011
Microsoft PowerPoint Template and Background with business diagram with graph going up on world map background Take your thoughts on an interesting escapade. Our Business Diagram Success PowerPoint Templates And PowerPoint Backgrounds 1011 will give them a sense of adventure.
Pie Chart Business PowerPoint Themes And PowerPoint Slides 0411
Microsoft PowerPoint Theme and Slide with rendering of pie graph on white Slide Measure your team's success with our Pie Chart Business PowerPoint Themes And PowerPoint Slides 0411. You will be at the top of your game.
Colorful Bar Chart Business PowerPoint Themes And PowerPoint Slides 0811
Microsoft PowerPoint Theme and Slide with of a three-dimensional multi-colored bar graph on a white Slide Don't leave your career to chance. Let our Colorful Bar Chart Business PowerPoint Themes And PowerPoint Slides 0811 help you take charge.

Finance Business PowerPoint Templates And PowerPoint Themes 0612
Finance Business PowerPoint Templates And PowerPoint Themes PPT Slides-Microsoft Powerpoint Templates and Background with business graph with arrow Taste success with our Finance Business PowerPoint Templates And PowerPoint Themes 0612. You will come out on top.
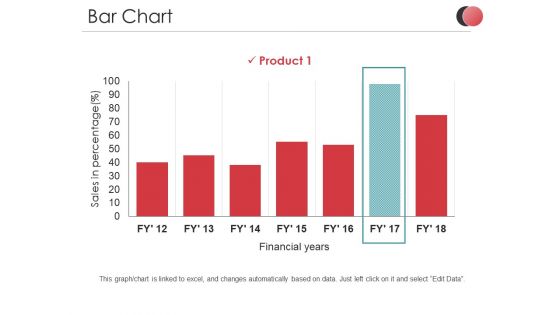
Bar Chart Ppt PowerPoint Presentation Outline Introduction
This is a bar chart ppt powerpoint presentation outline introduction. This is a one stage process. The stages in this process are sales in percentage, product, business, financial years, graph.
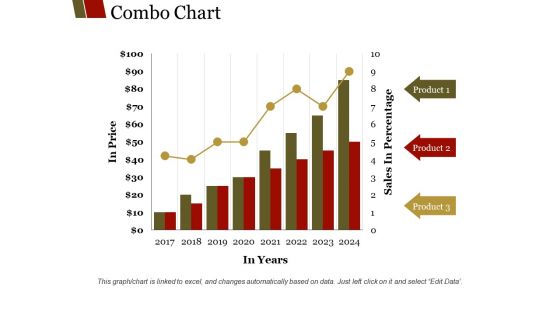
Combo Chart Ppt PowerPoint Presentation Summary Layouts
This is a combo chart ppt powerpoint presentation summary layouts. This is a eight stage process. The stages in this process are product, sales in percentage, in years, in price, graph.
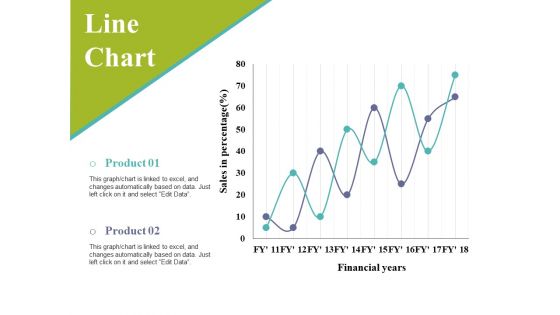
Line Chart Ppt PowerPoint Presentation Infographic Template Slides
This is a line chart ppt powerpoint presentation infographic template slides. This is a two stage process. The stages in this process are sales in percentage, financial years, business, marketing, graph.
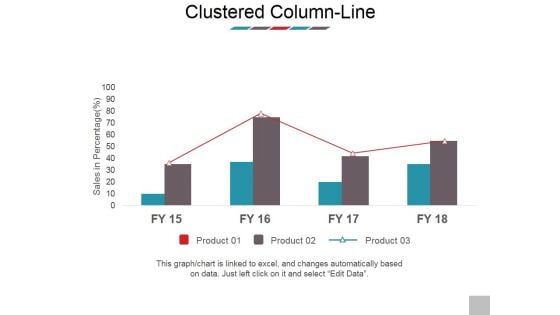
Clustered Column Line Ppt PowerPoint Presentation Model Images
This is a clustered column line ppt powerpoint presentation model images. This is a four stage process. The stages in this process are sales in percentage, product, business, marketing, bar graph.
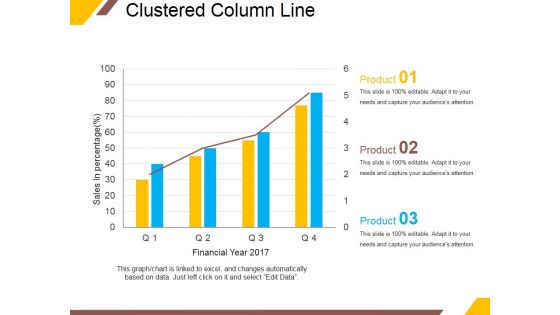
Clustered Column Line Ppt PowerPoint Presentation Portfolio Outline
This is a clustered column line ppt powerpoint presentation portfolio outline. This is a four stage process. The stages in this process are sales in percentage, financial year, product, graph, growth.

Clustered Column Line Ppt PowerPoint Presentation Slide
This is a clustered column line ppt powerpoint presentation slide. This is a three stage process. The stages in this process are bar graph, growth, finance, product, sales in percentage.
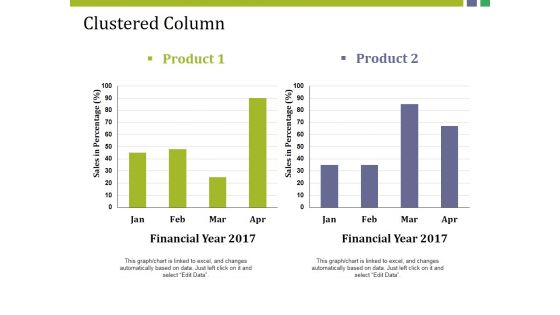
Clustered Column Ppt PowerPoint Presentation Gallery Structure
This is a clustered column ppt powerpoint presentation gallery structure. This is a two stage process. The stages in this process are product, sales in percentage, financial year, bar graph, finance.
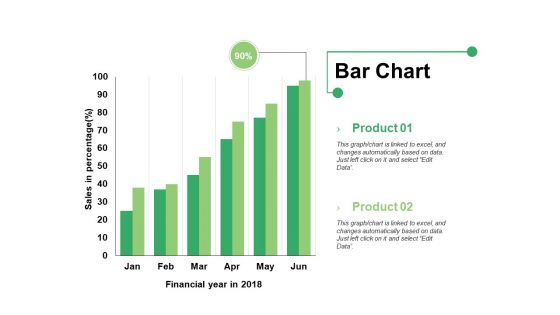
Bar Chart Ppt PowerPoint Presentation Infographics Format Ideas
This is a bar chart ppt powerpoint presentation infographics format ideas. This is a two stage process. The stages in this process are bar graph, product, financial year, sales in percentage.
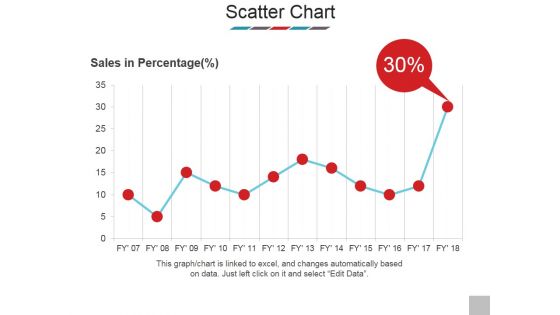
Scatter Chart Ppt PowerPoint Presentation Model Show
This is a scatter chart ppt powerpoint presentation model show. This is a one stage process. The stages in this process are sales in percentage, scatter chart, business, bar graph, marketing.
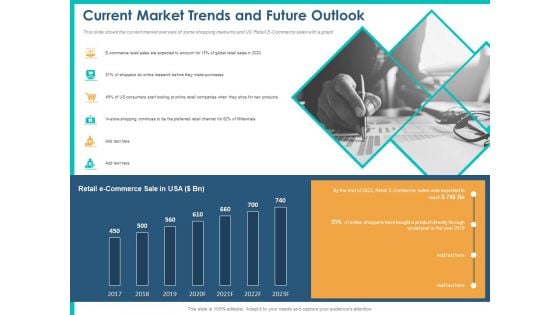
PPM Private Equity Current Market Trends And Future Outlook Ppt PowerPoint Presentation Infographic Template Designs Download PDF
This slide shows the current market overview of some shopping mediums and US Retail E Commerce sales with a graph. Deliver an awe-inspiring pitch with this creative ppm private equity current market trends and future outlook ppt powerpoint presentation infographic template designs download pdf bundle. Topics like e commerce retail sales, expected account, global retail sales 2020, online research, purchases, preferred retail channel can be discussed with this completely editable template. It is available for immediate download depending on the needs and requirements of the user.
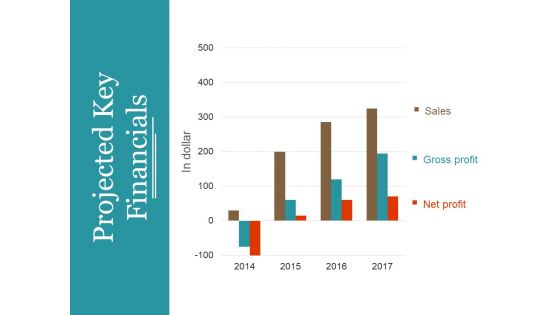
Projected Key Financials Template 1 Ppt PowerPoint Presentation Summary Professional
This is a projected key financials template 1 ppt powerpoint presentation summary professional. This is a three stage process. The stages in this process are in dollar, sales, gross profit, net profit, graph, year.
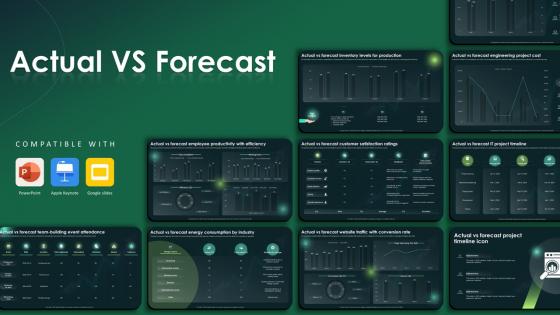
Actual Vs Forecast Powerpoint Ppt Template Bundles
This Actual Vs Forecast Powerpoint Ppt Template Bundles is designed to help you retain your audiences attention. This content-ready PowerPoint Template enables you to take your audience on a journey and share information in a way that is easier to recall. It helps you highlight the crucial parts of your work so that the audience does not get saddled with information download. This KPI Dashboard, Data Driven Marketing, Campaign Performance, Marketing Evaluation, Inventory Assessment-slide PPT Deck comes prepared with the graphs and charts you could need to showcase your information through visuals. You only need to enter your own data in them. Download this editable PowerPoint Theme and walk into that meeting with confidence. Our Actual vs. Forecast PowerPoint presentation can provide you with valuable business insights. Analyze sales figures, budgets, and financial predictions. Identify major differences, modify methods, and match projections with results to improve decision-making. Download now to accelerate your success.
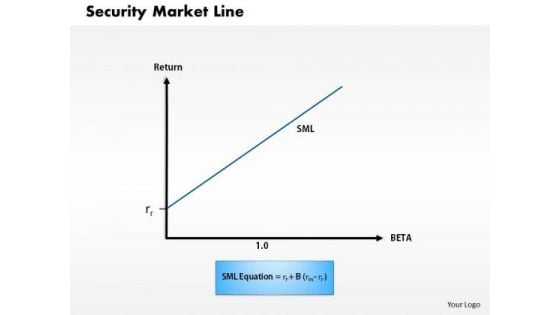
Business Framework Security Market Line 1 PowerPoint Presentation
This diagram displays graph of security market line. You can use line graph to plot changes in data over time, such as monthly revenue and earnings changes or daily changes in stock market prices.
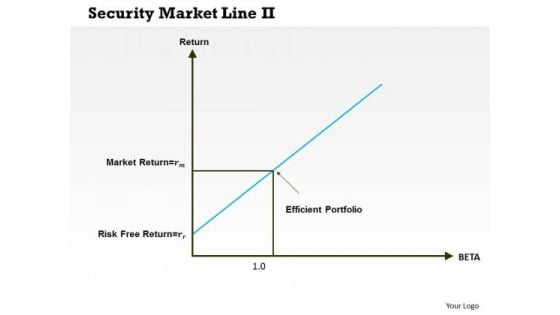
Business Framework Security Market Line 11 PowerPoint Presentation
This diagram displays graph of security market line. You can use line graph to plot changes in data over time, such as monthly revenue and earnings changes or daily changes in stock market prices.
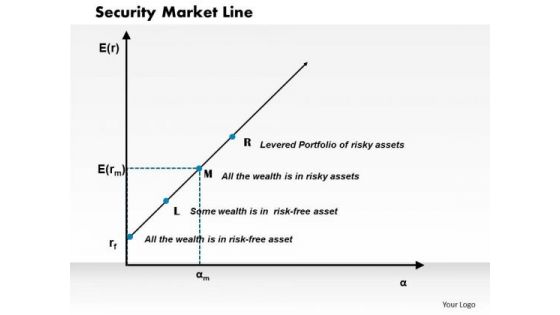
Business Framework Security Market Line PowerPoint Presentation
This diagram displays graph of security market line. You can use line graph to plot changes in data over time, such as monthly revenue and earnings changes or daily changes in stock market prices.
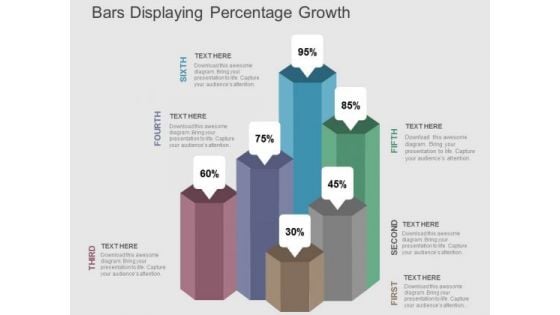
Bars Displaying Percentage Growth PowerPoint Templates
Our above PPT slide contains bar graph displaying percentage growth. This diagram of bar graph helps to depict statistical information. Use this diagram to impart more clarity to data and to create more sound impact on viewers.
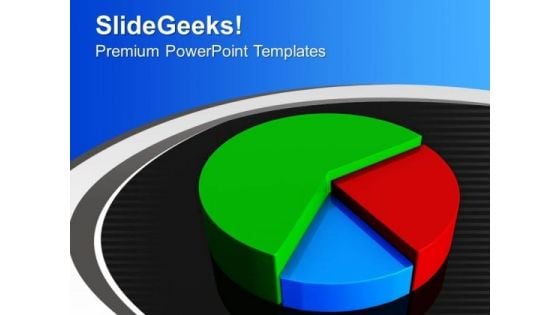
Illustration Of Pie Chart Market Strategy PowerPoint Templates Ppt Backgrounds For Slides 0313
We present our Illustration Of Pie Chart Market Strategy PowerPoint Templates PPT Backgrounds For Slides 0313.Present our Finance PowerPoint Templates because Our PowerPoint Templates and Slides will steer your racing mind. Hit the right buttons and spur on your audience. Download our Marketing PowerPoint Templates because You can Hit the nail on the head with our PowerPoint Templates and Slides. Embed your ideas in the minds of your audience. Download and present our Sales PowerPoint Templates because Our PowerPoint Templates and Slides will weave a web of your great ideas. They are gauranteed to attract even the most critical of your colleagues. Use our Success PowerPoint Templates because It can Bubble and burst with your ideas. Present our Business PowerPoint Templates because Our PowerPoint Templates and Slides are Clear and concise. Use them and dispel any doubts your team may have.Use these PowerPoint slides for presentations relating to A colorful pie chart graph, finance, marketing, success, business, sales. The prominent colors used in the PowerPoint template are Blue, Red, Green. Display an ambitious attitude with our Illustration Of Pie Chart Market Strategy PowerPoint Templates Ppt Backgrounds For Slides 0313. Your audience will become believers.

Image Of Bar Chart Dollar Finance PowerPoint Templates Ppt Backgrounds For Slides 0213
We present our Image Of Bar Chart Dollar Finance PowerPoint Templates PPT Backgrounds For Slides 0213.Download our Finance PowerPoint Templates because Our PowerPoint Templates and Slides team portray an attitude of elegance. Personify this quality by using them regularly. Download and present our Business PowerPoint Templates because Our PowerPoint Templates and Slides help you pinpoint your timelines. Highlight the reasons for your deadlines with their use. Download our Marketing PowerPoint Templates because Your success is our commitment. Our PowerPoint Templates and Slides will ensure you reach your goal. Download our Money PowerPoint Templates because They will Put the wind in your sails. Skim smoothly over the choppy waters of the market. Download and present our Sales PowerPoint Templates because Our PowerPoint Templates and Slides are truly out of this world. Even the MIB duo has been keeping tabs on our team.Use these PowerPoint slides for presentations relating to Business Graph, finance, business, marketing, money, sales . The prominent colors used in the PowerPoint template are Green, Black, Gray. Exhort your team with our Image Of Bar Chart Dollar Finance PowerPoint Templates Ppt Backgrounds For Slides 0213. Urge them on to go one better.
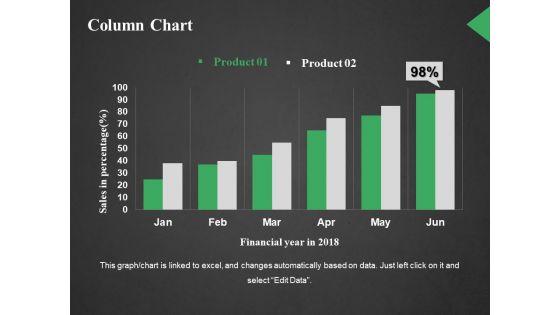
Column Chart Ppt PowerPoint Presentation Outline Styles
This is a column chart ppt powerpoint presentation outline styles. This is a two stage process. The stages in this process are sales in percentage, financial year in, business, marketing, graph.
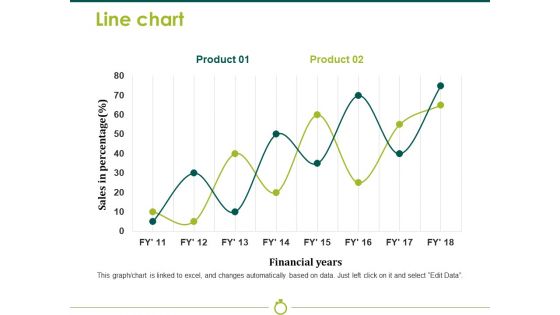
Line Chart Template 2 Ppt PowerPoint Presentation Model Background Image
This is a line chart template 2 ppt powerpoint presentation model background image. This is a two stage process. The stages in this process are sales in percentage, financial years, business, marketing, strategy, graph.
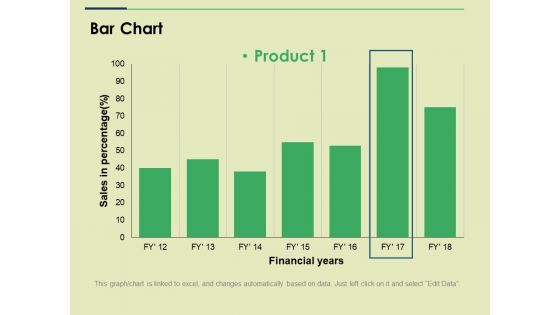
Bar Chart Ppt PowerPoint Presentation File Slide
This is a bar chart ppt powerpoint presentation file slide. This is a one stage process. The stages in this process are sales in percentage financial years, business, marketing, strategy, graph.
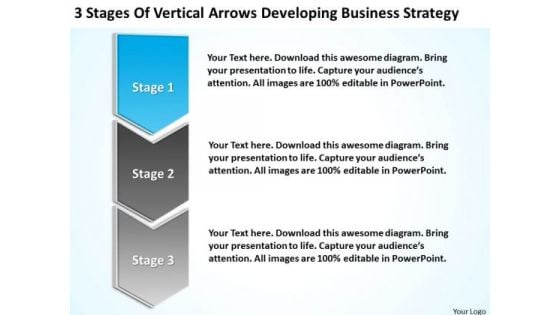
Flow Chart Business Of Vertical Arrows Developing Strategy Ppt PowerPoint Templates
We present our flow chart business of vertical arrows developing strategy ppt PowerPoint templates.Download our Finance PowerPoint Templates because They will bring a lot to the table. Their alluring flavours will make your audience salivate. Present our Arrows PowerPoint Templates because Our PowerPoint Templates and Slides will let you Illuminate the road ahead to Pinpoint the important landmarks along the way. Download our Sales PowerPoint Templates because You should Throw the gauntlet with our PowerPoint Templates and Slides. They are created to take up any challenge. Download our Process and Flows PowerPoint Templates because Our PowerPoint Templates and Slides are conceived by a dedicated team. Use them and give form to your wondrous ideas. Use our Business PowerPoint Templates because Watching this your Audience will Grab their eyeballs, they wont even blink.Use these PowerPoint slides for presentations relating to Process, Graph, Flow, Steps, Arrow, Banner, Vector, Sale, Button, Business, Design, Menu, Advertisement, Isolated, Decoration, Nobody, Bread-Crumbs, Green, Retail, Blank, Yellow, Symbol, Template, Orange, Element, Push, Vertical, Shape, Label, Grey, Illustration, Shiny, Collection, Direction, Badge, Empty, Set, Variation, Elegance, Placard, Message, Gradient, Silver, Financial. The prominent colors used in the PowerPoint template are Blue, Gray, White. Our Flow Chart Business Of Vertical Arrows Developing Strategy Ppt PowerPoint Templates team are knowledge fiends. They are animated encyclopedias.
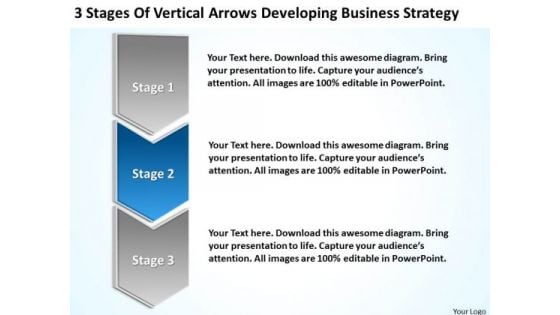
Flow Chart Business Of Vertical Arrows Developing Strategy Ppt PowerPoint Template
We present our flow chart business of vertical arrows developing strategy ppt PowerPoint template.Present our Finance PowerPoint Templates because Our PowerPoint Templates and Slides are like the strings of a tennis racquet. Well strung to help you serve aces. Download our Arrows PowerPoint Templates because Our PowerPoint Templates and Slides will give good value for money. They also have respect for the value of your time. Download and present our Sales PowerPoint Templates because our PowerPoint Templates and Slides are the string of your bow. Fire of your ideas and conquer the podium. Download and present our Process and Flows PowerPoint Templates because Our PowerPoint Templates and Slides offer you the widest possible range of options. Download and present our Business PowerPoint Templates because It will mark the footprints of your journey. Illustrate how they will lead you to your desired destination.Use these PowerPoint slides for presentations relating to Process, Graph, Flow, Steps, Arrow, Banner, Vector, Sale, Button, Business, Design, Menu, Advertisement, Isolated, Decoration, Nobody, Bread-Crumbs, Green, Retail, Blank, Yellow, Symbol, Template, Orange, Element, Push, Vertical, Shape, Label, Grey, Illustration, Shiny, Collection, Direction, Badge, Empty, Set, Variation, Elegance, Placard, Message, Gradient, Silver, Financial. The prominent colors used in the PowerPoint template are Blue, Gray, White. Enhance growth with our Flow Chart Business Of Vertical Arrows Developing Strategy Ppt PowerPoint Template. Download without worries with our money back guaranteee.
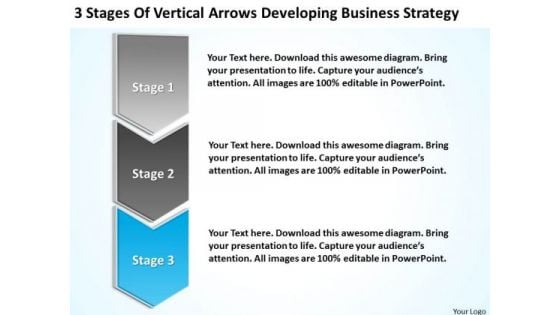
Sample Business Model Diagram Of Vertical Arrows Developing Strategy Ppt PowerPoint Slides
We present our sample business model diagram of vertical arrows developing strategy ppt PowerPoint Slides.Present our Finance PowerPoint Templates because Our PowerPoint Templates and Slides will effectively help you save your valuable time. They are readymade to fit into any presentation structure. Download our Arrows PowerPoint Templates because Our PowerPoint Templates and Slides are innately eco-friendly. Their high recall value negate the need for paper handouts. Download and present our Sales PowerPoint Templates because Our PowerPoint Templates and Slides offer you the widest possible range of options. Download our Process and Flows PowerPoint Templates because Our PowerPoint Templates and Slides provide you with a vast range of viable options. Select the appropriate ones and just fill in your text. Use our Business PowerPoint Templates because Our PowerPoint Templates and Slides ensures Effective communication. They help you put across your views with precision and clarity.Use these PowerPoint slides for presentations relating to Process, Graph, Flow, Steps, Arrow, Banner, Vector, Sale, Button, Business, Design, Menu, Advertisement, Isolated, Decoration, Nobody, Bread-Crumbs, Green, Retail, Blank, Yellow, Symbol, Template, Orange, Element, Push, Vertical, Shape, Label, Grey, Illustration, Shiny, Collection, Direction, Badge, Empty, Set, Variation, Elegance, Placard, Message, Gradient, Silver, Financial. The prominent colors used in the PowerPoint template are Blue, Gray, White. Our Sample Business Model Diagram Of Vertical Arrows Developing Strategy Ppt PowerPoint Slides will soon be your favourites. They will delight you with their charm.
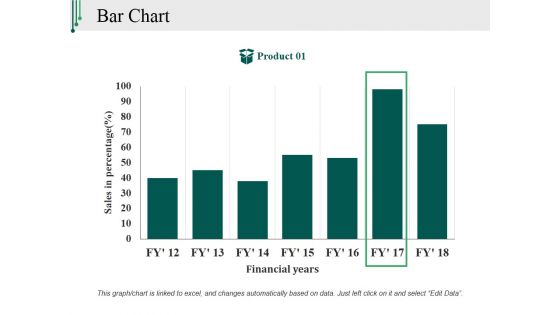
Bar Chart Ppt PowerPoint Presentation Outline Backgrounds
This is a bar chart ppt powerpoint presentation outline backgrounds. This is a one stage process. The stages in this process are sales in percentage, financial years, product, bar graph, finance.
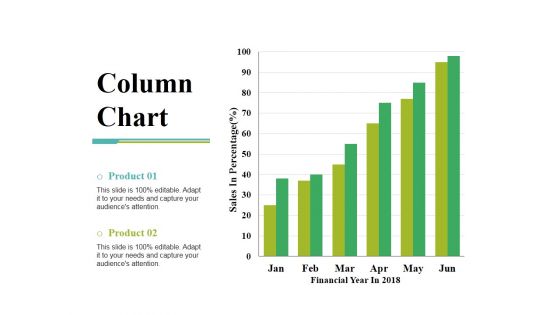
Column Chart Ppt PowerPoint Presentation Gallery Slide Portrait
This is a column chart ppt powerpoint presentation gallery slide portrait. This is a two stage process. The stages in this process are sales in percentage, financial year, product, bar graph, growth.
Image Of Green Business Pie Chart PowerPoint Templates Ppt Backgrounds For Slides 0113
We present our Image Of Green Business Pie Chart PowerPoint Templates PPT Backgrounds For Slides 0113.Use our Finance PowerPoint Templates because Our PowerPoint Templates and Slides will let your team Walk through your plans. See their energy levels rise as you show them the way. Download our Business PowerPoint Templates because Our PowerPoint Templates and Slides offer you the widest possible range of options. Present our Sales PowerPoint Templates because You can Hit the nail on the head with our PowerPoint Templates and Slides. Embed your ideas in the minds of your audience. Download our Success PowerPoint Templates because Our PowerPoint Templates and Slides are topically designed to provide an attractive backdrop to any subject. Download and present our Pie charts PowerPoint Templates because Your ideas provide food for thought. Our PowerPoint Templates and Slides will help you create a dish to tickle the most discerning palate.Use these PowerPoint slides for presentations relating to Green business Pie Chart Graph, finance, business, sales, Pie charts, success. The prominent colors used in the PowerPoint template are Green dark , Green lime , Green. Use our Image Of Green Business Pie Chart PowerPoint Templates PPT Backgrounds For Slides 0113 are aesthetically designed to attract attention. We guarantee that they will grab all the eyeballs you need. We assure you our finance PowerPoint templates and PPT Slides are second to none. The feedback we get is that our Image Of Green Business Pie Chart PowerPoint Templates PPT Backgrounds For Slides 0113 effectively help you save your valuable time. Customers tell us our Chart PowerPoint templates and PPT Slides look good visually. The feedback we get is that our Image Of Green Business Pie Chart PowerPoint Templates PPT Backgrounds For Slides 0113 will get their audience's attention. You can be sure our sales PowerPoint templates and PPT Slides help you meet deadlines which are an element of today's workplace. Just browse and pick the slides that appeal to your intuitive senses. Cover the gaps with our Image Of Green Business Pie Chart PowerPoint Templates Ppt Backgrounds For Slides 0113. They provide an ideal filling.
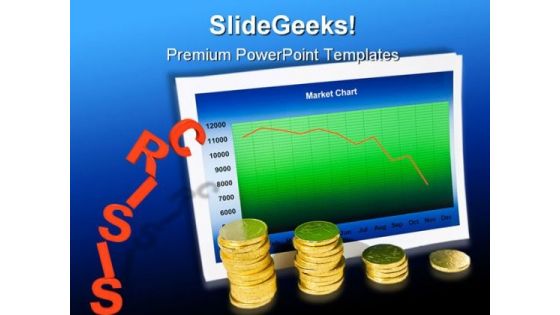
Market Crisis Finance PowerPoint Template 0610
Market chart with graph and stack of money Raise the bar with our Market Crisis Finance PowerPoint Template 0610. You will come out on top.
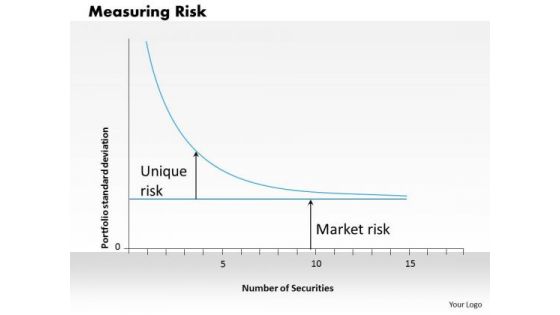
Business Framework Measuring Risk PowerPoint Presentation
This business framework has been crafted with graphic of graph with concept of measuring risk. Use this template for marketing and business related risk calculation.

Stock Market Crash Business PowerPoint Templates And PowerPoint Backgrounds 0811
Microsoft PowerPoint Template and Background with a man deeply depressed due to a drop in the graph to represent stock losses sales losses Our environment needs our care. Convey your concern with our Stock Market Crash Business PowerPoint Templates And PowerPoint Backgrounds 0811.
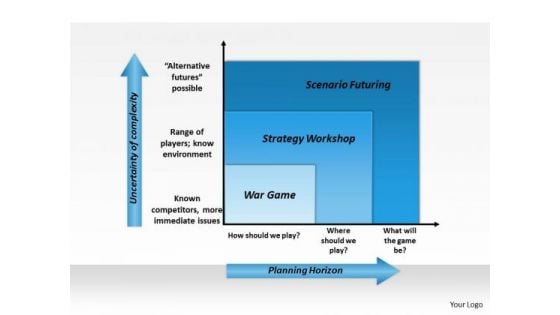
Business Framework Future Strategy Planning PowerPoint Presentation
This image slide displays planning graph. This image slide has been crafted with graph with planning horizon and uncertainty of complexity attributes. Use this image slide in your presentations to express views on future planning, strategy and various business complexities. This image slide will help your express your views in professional manner.
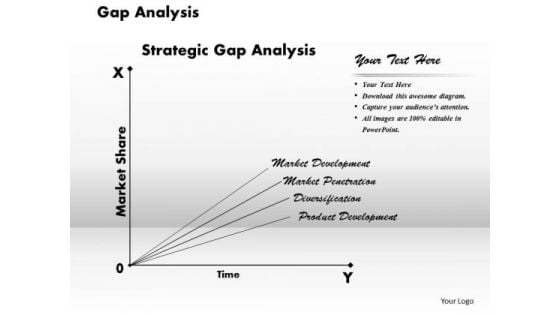
Business Framework Gap Analysis PowerPoint Presentation
This image slide displays gap analysis graph. This image slide has been designed with gap analysis graph with market share and time axis. It is the comparison of actual performance with potential or desired performance. Use this image slide to depict strategic gap analysis in your presentations. Make outstanding presentations in your presentations.
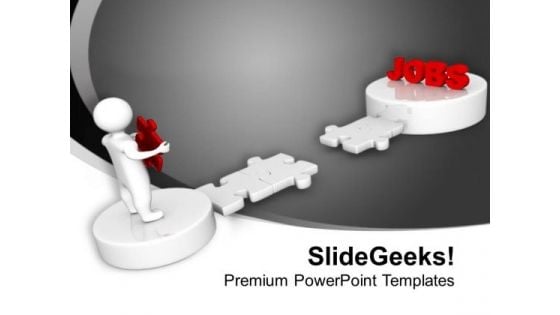
3d Man With Jobs Path Destination Business PowerPoint Templates Ppt Backgrounds For Slides 1112
We present our 3D Man With Jobs Path Destination Business PowerPoint Templates PPT Backgrounds For Slides 1112.Present our Business PowerPoint Templates because a brainwave has occurred to you after review. You know just how to push the graph skyward. Use our Targets PowerPoint Templates because it illustrates the symbols of human growth. Download our Shapes PowerPoint Templates because it helps you to display your ideas and thoughts. Present our Success PowerPoint Templates because the success of your venture depends on the performance of every team member. Use our Education PowerPoint Templates because a good beginning is the foundation of a young minds growth.Use these PowerPoint slides for presentations relating to Man With jobs path destination, business, targets, shapes, success, education Give credit where its due. Just download, type and present.
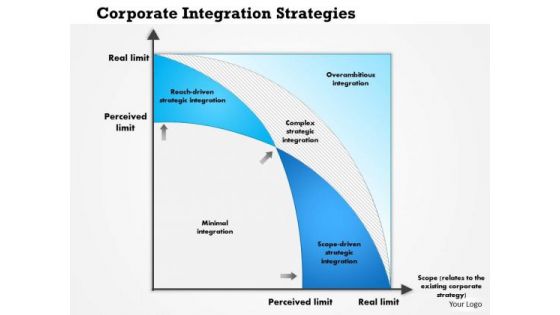
Business Framework Corporate Integration Strategies PowerPoint Presentation
This innovative image slide has been designed to display graph for corporate integration strategies. This business framework template may be used to display corporate strategy management in your presentations. This image slide will enhance the quality of your presentations.

Profits Business PowerPoint Backgrounds And Templates 1210
Microsoft PowerPoint Template and Background with line graph with the word profits in white lettering Don't leave your career to chance. Let our Profits Business PowerPoint Backgrounds And Templates 1210 help you take charge.

Marketing Business Finance PowerPoint Templates And PowerPoint Backgrounds 0211
Microsoft PowerPoint Template and Background with business bar graph and arrow shows growth Conclude the debate with our Marketing Business Finance PowerPoint Templates And PowerPoint Backgrounds 0211. Arrive at the right answers with your thoughts.

Marketing Business Finance PowerPoint Themes And PowerPoint Slides 0211
Microsoft PowerPoint Theme and Slide with business bar graph and arrow shows growth Analyse the effect of different factors. Our Marketing Business Finance PowerPoint Themes And PowerPoint Slides 0211 will give them equal attention.


 Continue with Email

 Home
Home


