Sales Graph
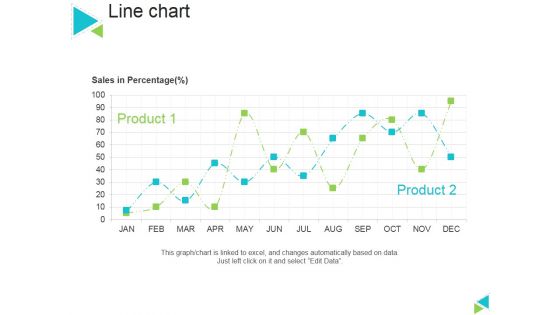
Line Chart Ppt PowerPoint Presentation Gallery Master Slide
This is a line chart ppt powerpoint presentation gallery master slide. This is a two stage process. The stages in this process are sales in percentage, product, line chart.
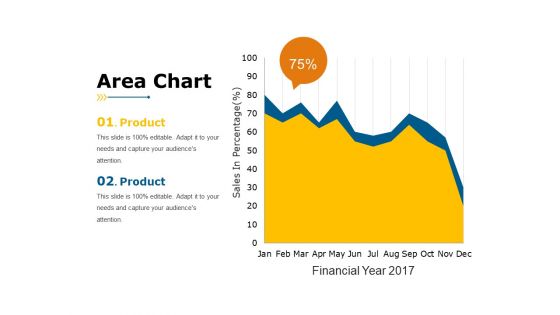
Area Chart Ppt PowerPoint Presentation Slides Rules
This is a area chart ppt powerpoint presentation slides rules. This is a two stage process. The stages in this process are sales in percentage, business, marketing, product, finance.
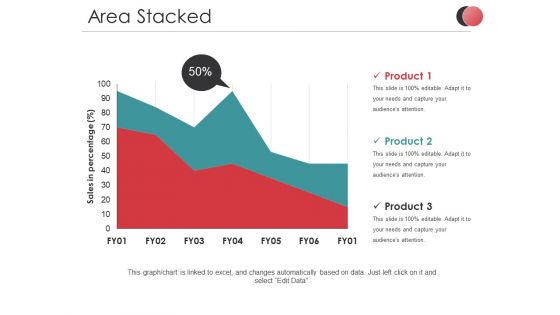
Area Stacked Ppt PowerPoint Presentation Diagram Images
This is a area stacked ppt powerpoint presentation diagram images. This is a two stage process. The stages in this process are sales in percentage, product, business, marketing, finance.
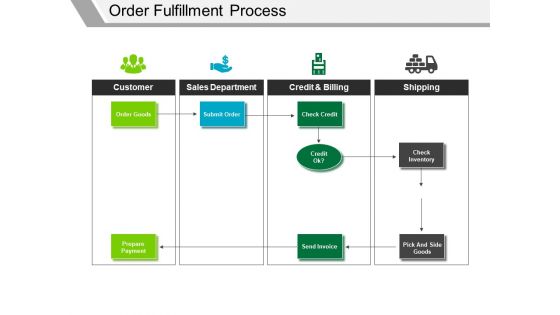
Order Fulfillment Process Ppt PowerPoint Presentation Styles Graphics Tutorials
This is a order fulfillment process ppt powerpoint presentation styles graphics tutorials. This is a four stage process. The stages in this process are customer, sales department, credit and billing, shipping, check inventory.
Order Fulfillment Process Ppt PowerPoint Presentation Icon Demonstration
This is a order fulfillment process ppt powerpoint presentation icon demonstration. This is a four stage process. The stages in this process are customer, sales department, credit and billing, shipping, submit order.
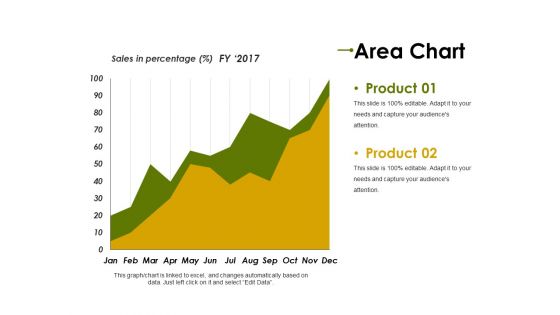
Area Chart Ppt PowerPoint Presentation Summary Objects
This is a area chart ppt powerpoint presentation summary objects. This is a two stage process. The stages in this process are product, sales in percentage, finance, business, marketing.
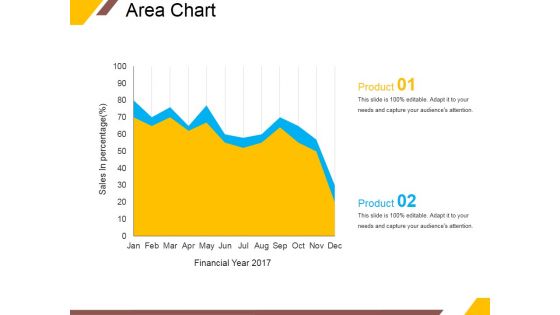
Area Chart Ppt PowerPoint Presentation Layouts Vector
This is a area chart ppt powerpoint presentation layouts vector. This is a two stage process. The stages in this process are area chart, product, sales in percentage, financial year.
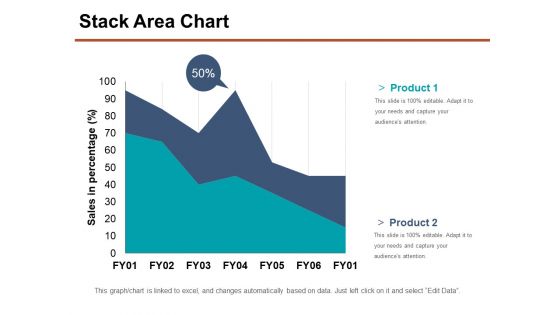
Stack Area Chart Ppt PowerPoint Presentation Show Samples
This is a stack area chart ppt powerpoint presentation show samples. This is a two stage process. The stages in this process are product, sales in percentage, business, marketing, percentage.
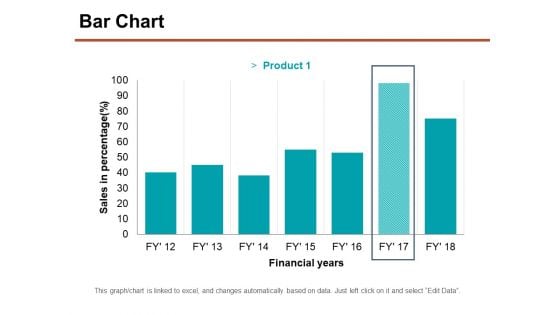
Bar Chart Ppt PowerPoint Presentation Professional Graphics Download
This is a bar chart ppt powerpoint presentation professional graphics download. This is a seven stage process. The stages in this process are sales in percentage, financial years, chart, business.
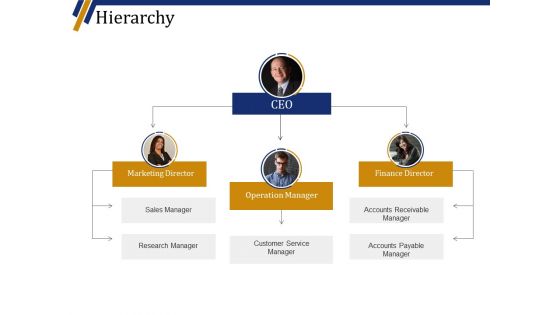
Hierarchy Ppt PowerPoint Presentation Layouts Visuals
This is a hierarchy ppt powerpoint presentation layouts visuals. This is a three stage process. The stages in this process are marketing director, operation manager, finance director, sales manager, research manager.

Line Chart Ppt PowerPoint Presentation Infographics Graphic Images
This is a line chart ppt powerpoint presentation infographics graphic images. This is a two stage process. The stages in this process are sales in percentage, financial years, growth, business, marketing.
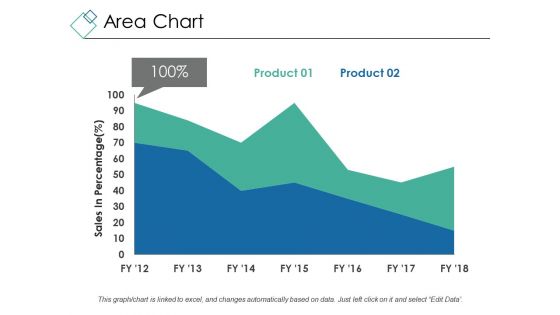
Area Chart Ppt PowerPoint Presentation Inspiration Demonstration
This is a area chart ppt powerpoint presentation inspiration demonstration. This is a two stage process. The stages in this process are sales in percentage, chart, percentage, business, marketing.
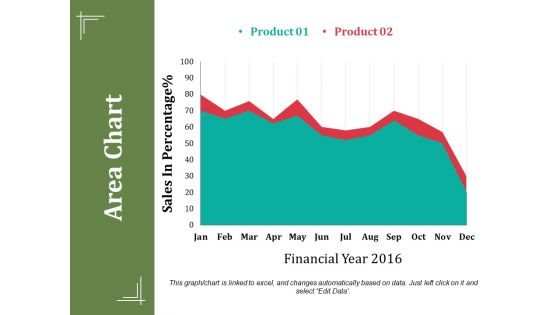
Area Chart Ppt PowerPoint Presentation Summary Show
This is a area chart ppt powerpoint presentation summary show. This is a two stage process. The stages in this process are sales in percentage, financial year, business, marketing, finance.
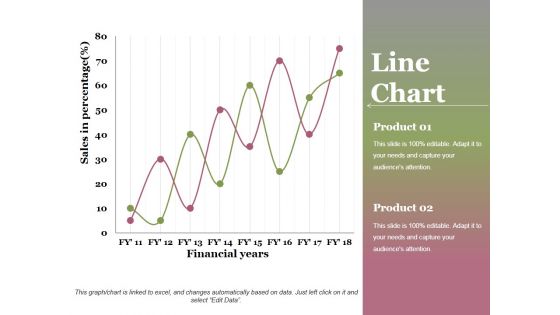
Line Chart Ppt PowerPoint Presentation Professional Graphics Design
This is a line chart ppt powerpoint presentation professional graphics design. This is a two stage process. The stages in this process are financial years, sales in percentage, product, growth, success.
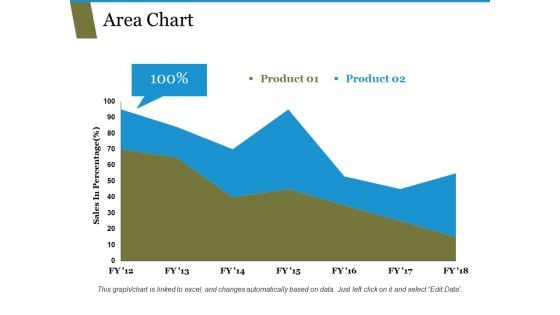
Area Chart Ppt PowerPoint Presentation Portfolio Templates
This is a area chart ppt powerpoint presentation portfolio templates. This is a two stage process. The stages in this process are sales in percentage, chart, business, marketing, finance.
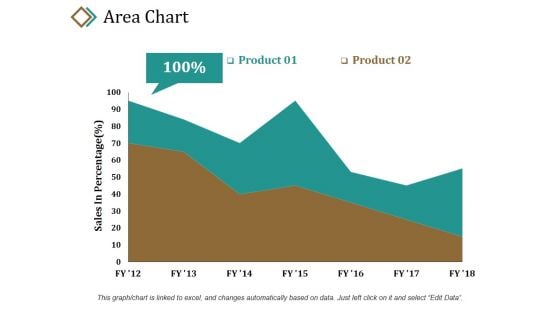
Area Chart Ppt PowerPoint Presentation Summary Example Introduction
This is a area chart ppt powerpoint presentation summary example introduction. This is a two stage process. The stages in this process are product, sales in percentage, percentage, area chart, business.
Area Chart Ppt PowerPoint Presentation Ideas Icon
This is a area chart ppt powerpoint presentation ideas icon. This is a two stage process. The stages in this process are product, area chart, sales in percentage, growth, success.
Bar Chart Ppt PowerPoint Presentation Icon Layout
This is a bar chart ppt powerpoint presentation icon layout. This is a one stage process. The stages in this process are sales in percentage, financial years, bar chart, finance, marketing.
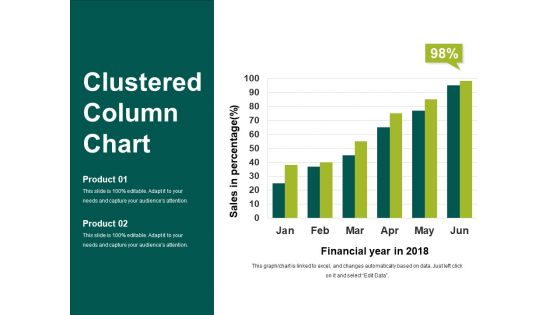
Clustered Column Chart Ppt PowerPoint Presentation Show Slideshow
This is a clustered column chart ppt powerpoint presentation show slideshow. This is a six stage process. The stages in this process are financial year in, sales in percentage, business, marketing, finance.
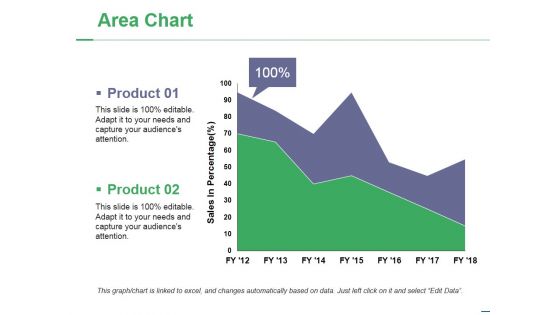
Area Chart Ppt PowerPoint Presentation Layouts Images
This is a area chart ppt powerpoint presentation layouts images. This is a two stage process. The stages in this process are product, sales in percentage, area chart, percentage, finance.
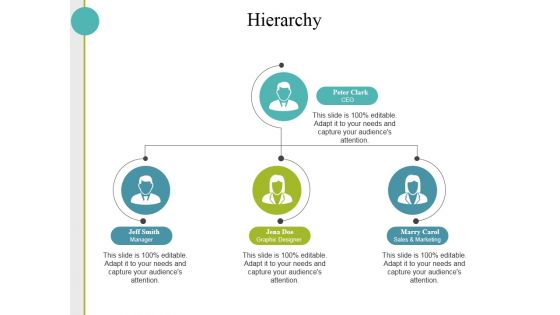
Hierarchy Ppt PowerPoint Presentation Professional Display
This is a hierarchy ppt powerpoint presentation professional display. This is a three stage process. The stages in this process are ceo, manager, graphic designer, sales and marketing, hierarchy.
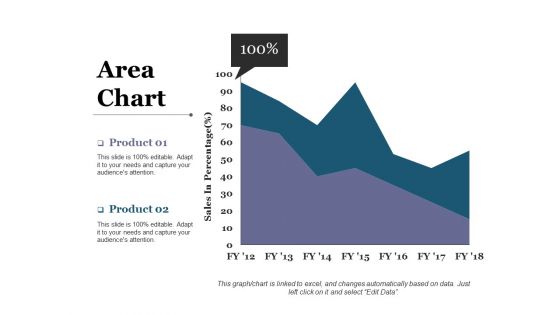
Area Chart Ppt PowerPoint Presentation Model Introduction
This is a area chart ppt powerpoint presentation model introduction. This is a two stage process. The stages in this process are sales in percentage, area chart, percentage, business, marketing.
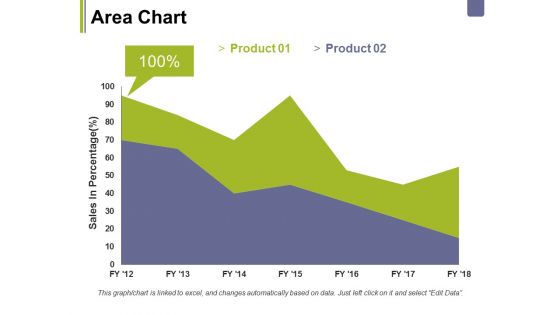
Area Chart Ppt PowerPoint Presentation Styles Show
This is a area chart ppt powerpoint presentation styles show. This is a two stage process. The stages in this process are business, marketing, area chart, sales in percentage, percentage.
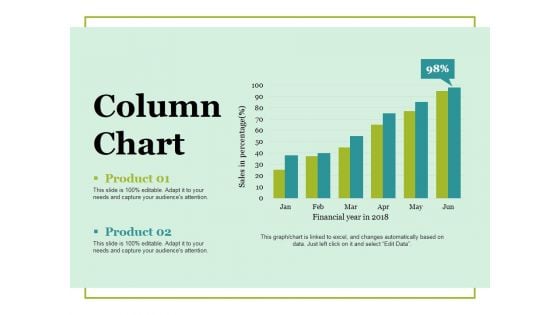
Column Chart Ppt PowerPoint Presentation Ideas Vector
This is a column chart ppt powerpoint presentation ideas vector. This is a two stage process. The stages in this process are column chart, product, financial years, sales in percentage, growth.
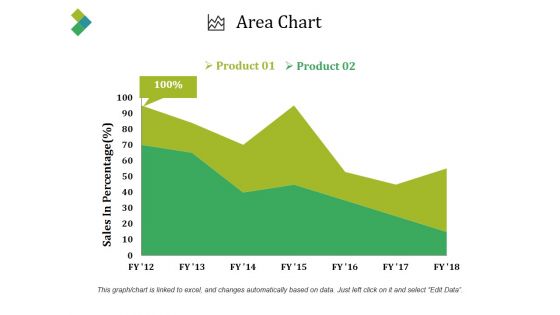
Area Chart Ppt PowerPoint Presentation Infographics Good
This is a area chart ppt powerpoint presentation infographics good. This is a two stage process. The stages in this process are sales in percentage, product, area chart, business, percentage.
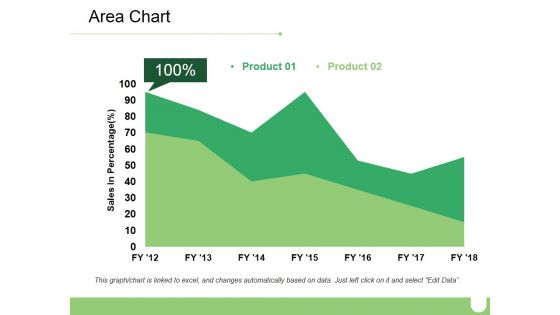
Area Chart Ppt PowerPoint Presentation Model Slides
This is a area chart ppt powerpoint presentation model slides. This is a two stage process. The stages in this process are business, marketing, sales in percentage, chart, percentage, finance.
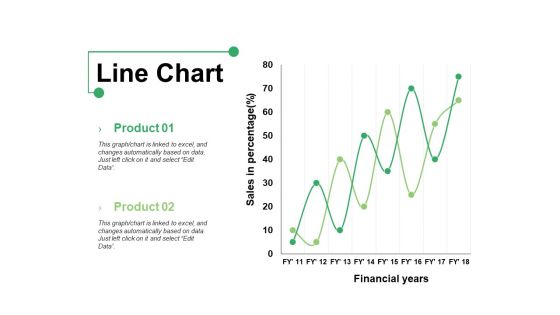
Line Chart Ppt PowerPoint Presentation Show Graphics Example
This is a line chart ppt powerpoint presentation show graphics example. This is a two stage process. The stages in this process are product, line chart, financial years, sales in percentage.
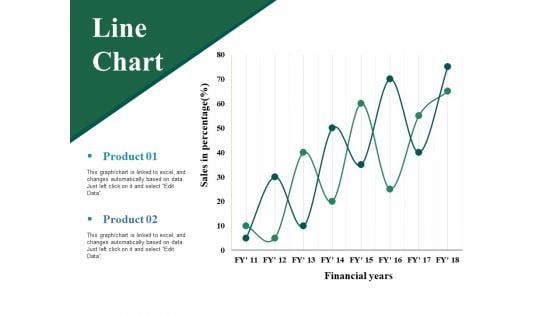
Line Chart Ppt PowerPoint Presentation Professional Grid
This is a line chart ppt powerpoint presentation professional grid. This is a two stage process. The stages in this process are sales in percentage, financial years, product, line chart.
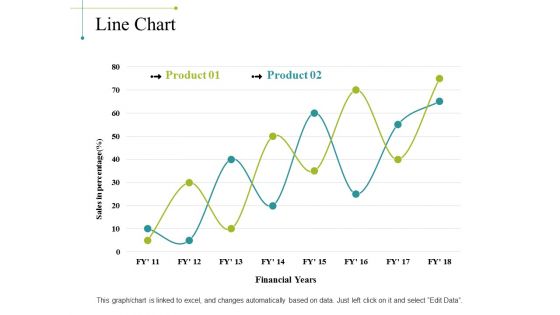
Line Chart Ppt PowerPoint Presentation Portfolio Background Image
This is a line chart ppt powerpoint presentation portfolio background image. This is a two stage process. The stages in this process are sales in percentage, financial years, chart, business, marketing, finance.
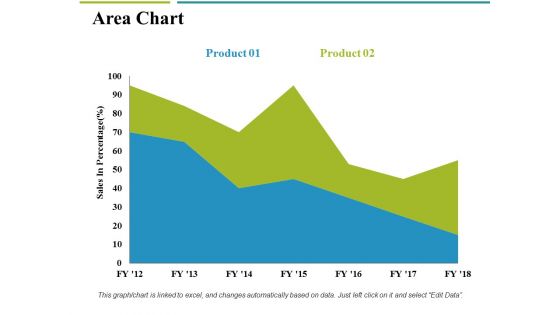
Area Chart Ppt PowerPoint Presentation Ideas Professional
This is a area chart ppt powerpoint presentation ideas professional. This is a two stage process. The stages in this process are business, sales in percentage, area chart, marketing, finance.
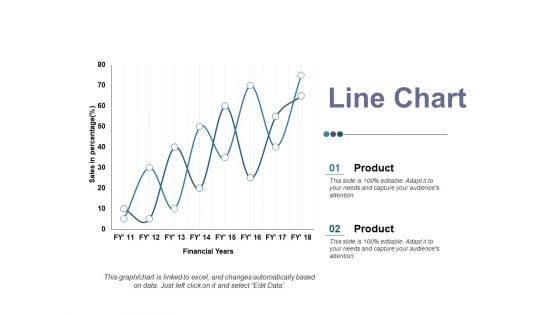
Line Chart Ppt PowerPoint Presentation Ideas Elements
This is a line chart ppt powerpoint presentation ideas elements. This is a two stage process. The stages in this process are product, sales in percentage, financial year, business, line chart.
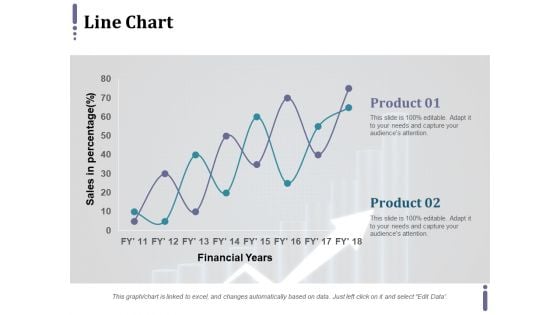
Line Chart Ppt PowerPoint Presentation Infographic Template Master Slide
This is a line chart ppt powerpoint presentation infographic template master slide. This is a two stage process. The stages in this process are product, financial years, sales in percentage.
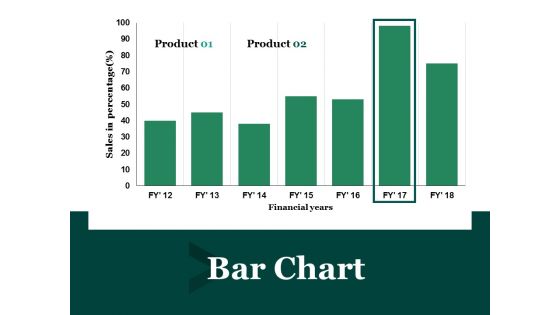
Bar Chart Ppt PowerPoint Presentation Layouts Template
This is a bar chart ppt powerpoint presentation layouts template. This is a two stage process. The stages in this process are financial year, sales in percentage, business, marketing, finance.
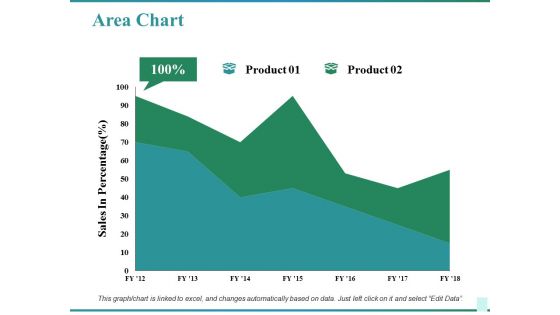
Area Chart Ppt PowerPoint Presentation Inspiration Background Designs
This is a area chart ppt powerpoint presentation inspiration background designs. This is a two stage process. The stages in this process are business, sales in percentage, area chart, marketing, finance.
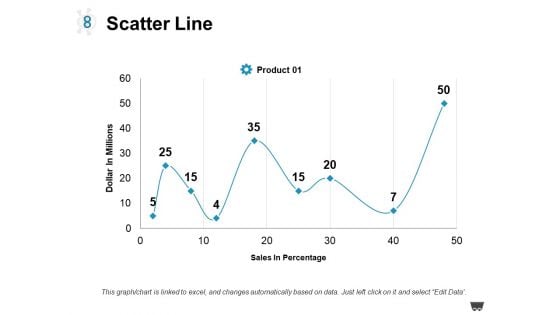
Scatter Line Ppt PowerPoint Presentation Styles Graphics Pictures
This is a scatter line ppt powerpoint presentation styles graphics pictures. This is a one stage process. The stages in this process are product, dollar in millions, sales in percentage.
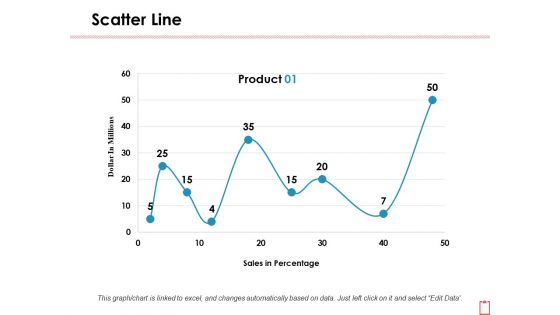
Scatter Line Ppt PowerPoint Presentation Infographics Background Images
This is a scatter line ppt powerpoint presentation infographics background images. This is a one stage process. The stages in this process are dollar in millions, product, sales in percentage.
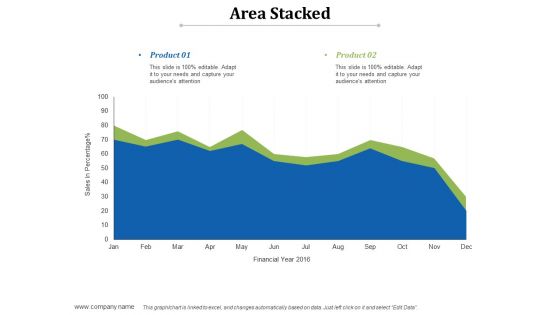
Area Stacked Ppt PowerPoint Presentation Infographics Shapes
This is a area stacked ppt powerpoint presentation infographics shapes. This is a two stage process. The stages in this process are product, area stacked, sales in percentage, financial year.
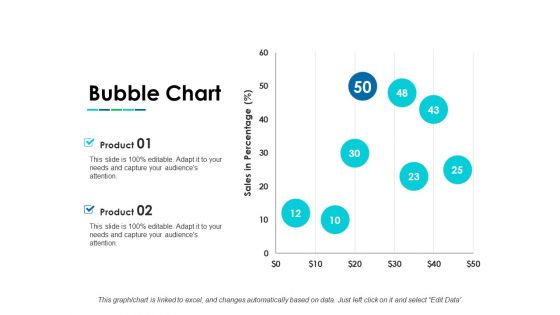
Bubble Chart Ppt PowerPoint Presentation Infographic Template Layouts
This is a bubble chart ppt powerpoint presentation infographic template layouts. This is a two stage process. The stages in this process are bubble chart, product, sales in percentage, growth.
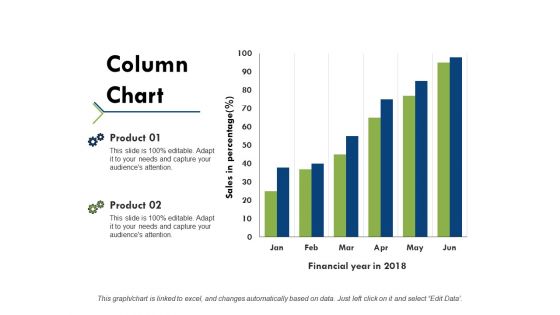
Column Chart Ppt PowerPoint Presentation Portfolio Example Topics
This is a column chart ppt powerpoint presentation portfolio example topics. This is a two stage process. The stages in this process are product, financial year, sales in percentage, column chart.
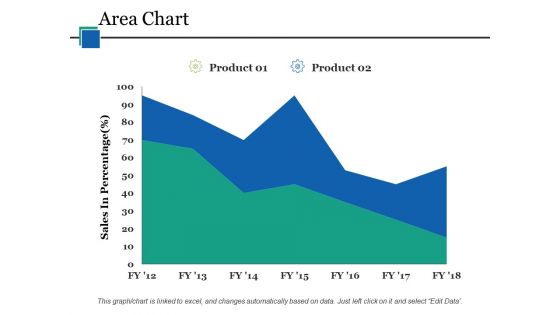
Area Chart Ppt PowerPoint Presentation Infographics Guide
This is a area chart ppt powerpoint presentation infographics guide. This is a two stage process. The stages in this process are area chart, product, sales in percentage, finance, business.
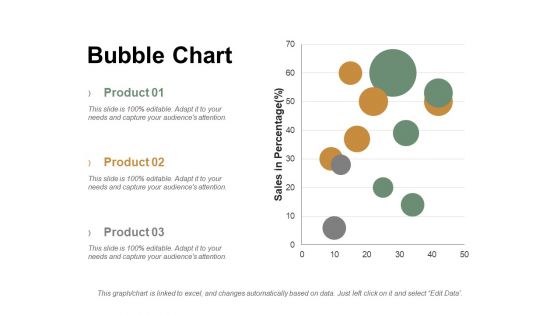
Bubble Chart Ppt PowerPoint Presentation Summary Graphics Tutorials
This is a bubble chart ppt powerpoint presentation summary graphics tutorials. This is a three stage process. The stages in this process are product, sales in percentage, bubble chart.
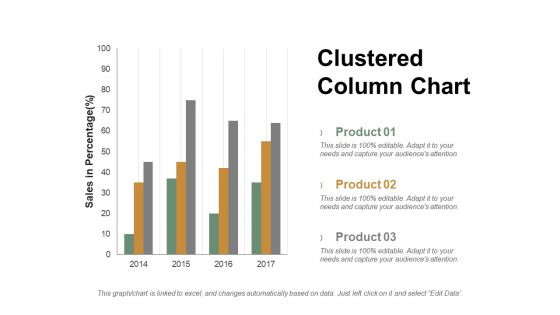
Clustered Column Chart Ppt PowerPoint Presentation Professional Ideas
This is a clustered column chart ppt powerpoint presentation professional ideas. This is a three stage process. The stages in this process are product, sales in percentage, column, years.
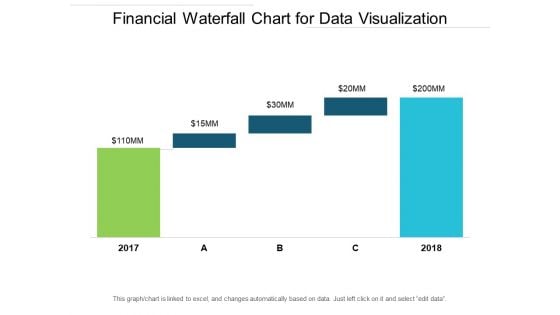
Financial Waterfall Chart For Data Visualization Ppt PowerPoint Presentation Ideas Elements
This is a financial waterfall chart for data visualization ppt powerpoint presentation ideas elements. This is a five stage process. The stages in this process are sales waterfall, waterfall chart, business.
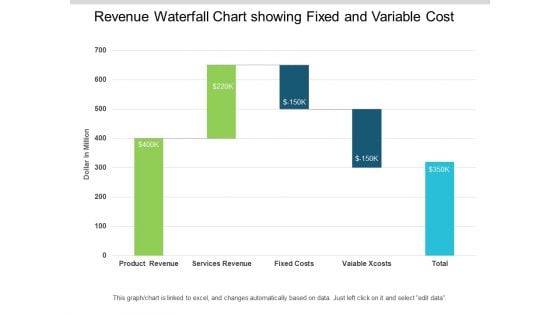
Revenue Waterfall Chart Showing Fixed And Variable Cost Ppt PowerPoint Presentation Infographic Template Images
This is a revenue waterfall chart showing fixed and variable cost ppt powerpoint presentation infographic template images. This is a five stage process. The stages in this process are sales waterfall, waterfall chart, business.
Waterfall Chart Showing Effective Pricing And Profitability Insight Ppt PowerPoint Presentation Icon Graphics
This is a waterfall chart showing effective pricing and profitability insight ppt powerpoint presentation icon graphics. This is a seven stage process. The stages in this process are sales waterfall, waterfall chart, business.
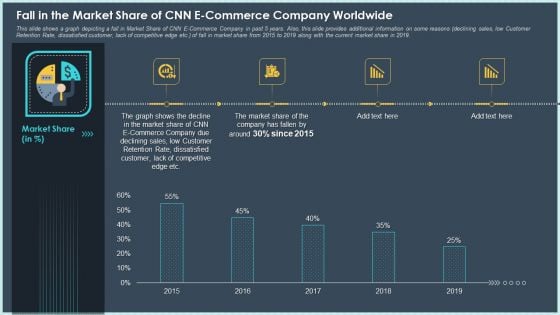
Fall In The Market Share Of Cnn E Commerce Company Worldwide Information PDF
This slide shows a graph depicting a fall in Market Share of CNN E-Commerce Company in past 5 years. Also, this slide provides additional information on some reasons declining sales, low Customer Retention Rate, dissatisfied customer, lack of competitive edge etc. of fall in market share from 2015 to 2019 along with the current market share in 2019. Deliver and pitch your topic in the best possible manner with this fall in the market share of cnn e commerce company worldwide information pdf. Use them to share invaluable insights on customer retention rate, market share, sales and impress your audience. This template can be altered and modified as per your expectations. So, grab it now.

International Business Extension Expectations After Expanding Into Global Markets Diagrams PDF
This slide showcase graph that can help organization to estimate the impact on organizational sales after global expansion. It showcases sales in thousand dollars and forecast for a period of two years. If you are looking for a format to display your unique thoughts, then the professionally designed International Business Extension Expectations After Expanding Into Global Markets Diagrams PDF is the one for you. You can use it as a Google Slides template or a PowerPoint template. Incorporate impressive visuals, symbols, images, and other charts. Modify or reorganize the text boxes as you desire. Experiment with shade schemes and font pairings. Alter, share or cooperate with other people on your work. Download International Business Extension Expectations After Expanding Into Global Markets Diagrams PDF and find out how to give a successful presentation. Present a perfect display to your team and make your presentation unforgettable.
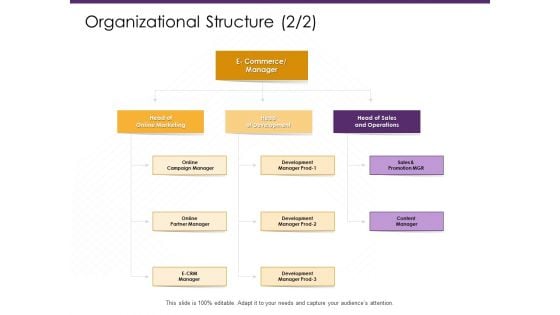
E Commerce Organizational Structure Development Ppt PowerPoint Presentation Model Slide Download PDF
Presenting this set of slides with name e commerce organizational structure development ppt powerpoint presentation model slide download pdf. This is a five stage process. The stages in this process are e commerce, online marketing, head development, head sales and operations, online partner, sales and promotion mgr. This is a completely editable PowerPoint presentation and is available for immediate download. Download now and impress your audience.
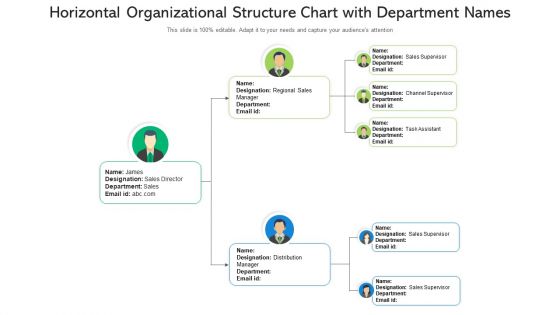
Horizontal Organizational Structure Chart With Department Names Ppt PowerPoint Presentation Gallery Summary PDF
Persuade your audience using this horizontal organizational structure chart with department names ppt powerpoint presentation gallery summary pdf. This PPT design covers two stages, thus making it a great tool to use. It also caters to a variety of topics including regional sales manager, sales supervisor, distribution manager. Download this PPT design now to present a convincing pitch that not only emphasizes the topic but also showcases your presentation skills.
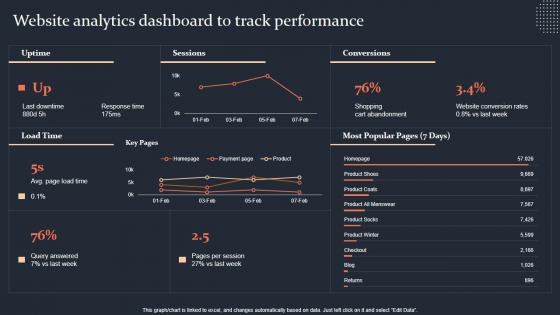
Website Analytics Dashboard To Track Performance Step By Step Guide Inspiration PDF
This graph chart is linked to excel, and changes automatically based on data. Just left click on it and select Edit Data. Slidegeeks is here to make your presentations a breeze with Website Analytics Dashboard To Track Performance Step By Step Guide Inspiration PDF With our easy-to-use and customizable templates, you can focus on delivering your ideas rather than worrying about formatting. With a variety of designs to choose from, you are sure to find one that suits your needs. And with animations and unique photos, illustrations, and fonts, you can make your presentation pop. So whether you are giving a sales pitch or presenting to the board, make sure to check out Slidegeeks first This graph chart is linked to excel, and changes automatically based on data. Just left click on it and select Edit Data.
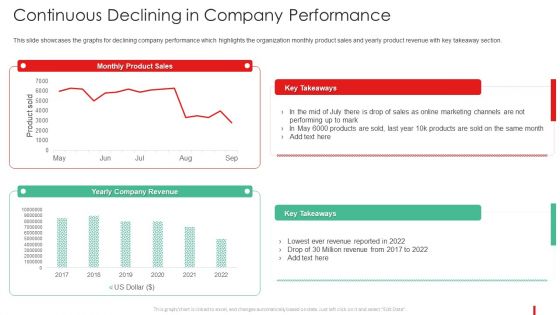
Promotion Guide To Advertise Brand On Youtube Continuous Declining In Company Rules PDF
This slide showcases the graphs for declining company performance which highlights the organization monthly product sales and yearly product revenue with key takeaway section.Deliver and pitch your topic in the best possible manner with this Promotion Guide To Advertise Brand On Youtube Continuous Declining In Company Rules PDF Use them to share invaluable insights on Continuous Declining In Company Performance and impress your audience. This template can be altered and modified as per your expectations. So, grab it now.
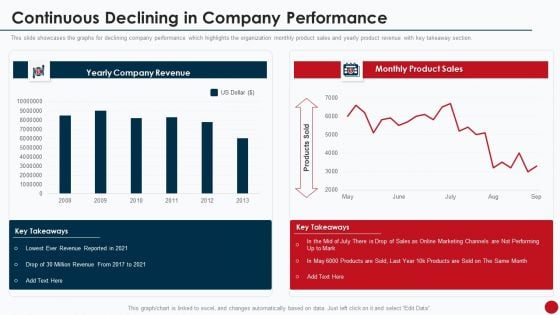
Marketing Manual For Product Promotion On Youtube Channel Continuous Declining In Company Performance Rules PDF
This slide showcases the graphs for declining company performance which highlights the organization monthly product sales and yearly product revenue with key takeaway section.Deliver and pitch your topic in the best possible manner with this Marketing Manual For Product Promotion On Youtube Channel Continuous Declining In Company Performance Rules PDF. Use them to share invaluable insights on Marketing Channels, Revenue Reported, Million Revenue and impress your audience. This template can be altered and modified as per your expectations. So, grab it now.
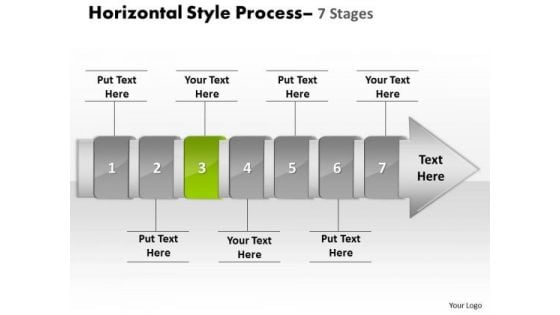
Ppt Theme Linear Demonstration Of 7 Stages Manner Production Strategy PowerPoint 4 Design
We present our PPT Theme linear demonstration of 7 stages manner production strategy power point 4 designs. Use our Arrows PowerPoint Templates because, be the cynosure of all eyes with our template depicting. Use our Shapes PowerPoint Templates because; Employ the right colors for your brilliant ideas. Use our Finance PowerPoint Templates because; adorn them with your ideas and thoughts. Use our Business PowerPoint Templates because; Blaze a brilliant trail from point to point. Use our Process and Flows PowerPoint Templates because, Business 3D Circular Puzzle:- Your business and plans for its growth consist of processes that are highly co-related. Use these PowerPoint slides for presentations relating to accent, advertisement, arrow, badge, banner, business, button, collection, color, decoration, design, direction, element, financial, flow, graph, horizontal, instruction, isolated, label, manual, message, process, sale, set, shape, steps, symbol, template. The prominent colors used in the PowerPoint template are Green, Gray, and Black Start emerging business ventures with our Ppt Theme Linear Demonstration Of 7 Stages Manner Production Strategy PowerPoint 4 Design. They will make you look good.
Global Event Market Analysis Revenue Event Management Business Plan Go To Market Strategy Icons Pdf
This slide showcases the global event market analysis by revenue source which includes ticket sale, sponsorship and others that shows sponsorship segment has captured the highest share in 2019 Make sure to capture your audiences attention in your business displays with our gratis customizable Global Event Market Analysis Revenue Event Management Business Plan Go To Market Strategy Icons Pdf. These are great for business strategies, office conferences, capital raising or task suggestions. If you desire to acquire more customers for your tech business and ensure they stay satisfied, create your own sales presentation with these plain slides. This slide showcases the global event market analysis by revenue source which includes ticket sale, sponsorship and others that shows sponsorship segment has captured the highest share in 2019
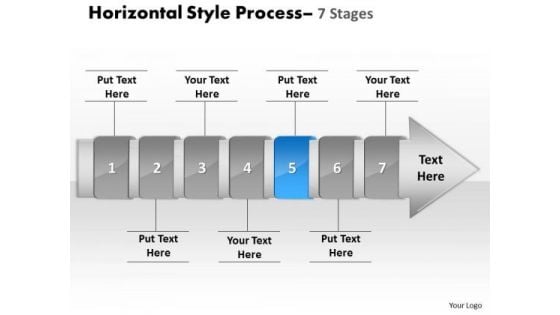
Ppt Background Linear Demonstration Of 7 Stages Method 6 Image
We present our PPT Background linear demonstration of 7 stages method 6 Image. Use our Arrows PowerPoint Templates because, and watch them strengthen your companys sinews. Use our Shapes PowerPoint Templates because; Break it all down to Key Result Areas. Use our Finance PowerPoint Templates because; demonstrate how they contribute to the larger melting pot. Use our Business PowerPoint Templates because, getting it done in time is the key to success. Use our Process and Flows PowerPoint Templates because, the lessons have been analyzed, studied and conclusions drawn. Use these PowerPoint slides for presentations relating to accent, advertisement, arrow, badge, banner, blank, business, button, collection, color, decoration, design, direction, element, financial, flow, graph, horizontal, instruction, label, menu, message, process, promotion, sale, set, shape, steps, symbol, template. The prominent colors used in the PowerPoint template are Blue, Gray, and Black Flap your wings and soar with our Ppt Background Linear Demonstration Of 7 Stages Method 6 Image. Try us out and see what a difference our templates make.
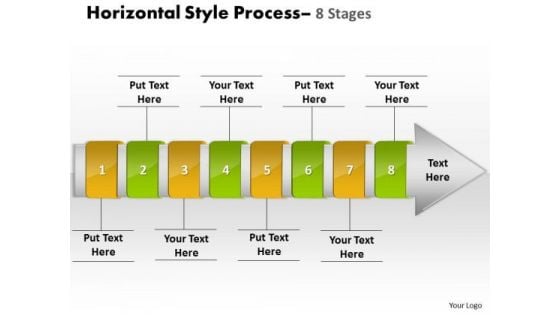
Ppt Background Linear Demonstration Of 8 PowerPoint Slide Numbers Procedure 1 Image
We present our PPT Background Linear demonstration of 8 PowerPoint slide numbers procedure 1 Image. Use our Arrows PowerPoint Templates because, the color coding of our templates are specifically designed to highlight you points. Use our Shapes PowerPoint Templates because, the core of any organization is the people who work for it. Use our Finance PowerPoint Templates because; Break it all down to Key Result Areas. Use our Business PowerPoint Templates because, you have good reasons to back up the strength of your belief. Use our Process and Flows PowerPoint Templates because, you have the right arrows in your quiver. Use these PowerPoint slides for presentations relating to accent, advertisement, arrow, badge, banner, blank, business, button, collection, color, decoration, design, direction, element, financial, flow, graph, horizontal, instruction, label, menu, message, process, promotion, sale, set, shape, steps, symbol, template. The prominent colors used in the PowerPoint template are Green, Yellow, and Gray Bubble up to the top with our Ppt Background Linear Demonstration Of 8 PowerPoint Slide Numbers Procedure 1 Image. You will come out on top.
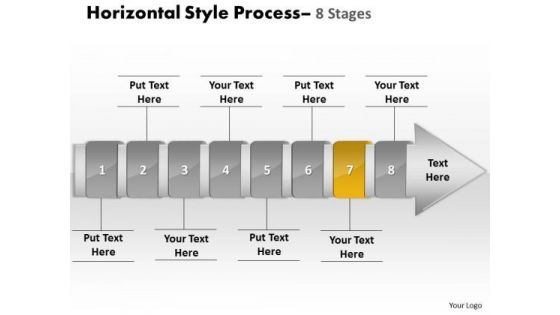
Ppt Background Linear Demonstration Of 8 Steps Working With Slide Numbers Procedure Image
We present our PPT Background linear Demonstration of 8 steps working with slide numbers procedure Image. Use our Arrows PowerPoint Templates because; Highlight the key components of your entire manufacturing/ business process. Use our Shapes PowerPoint Templates because, this business PowerPoint template helps expound on the logic of your detailed thought process to take your company forward. Use our Finance PowerPoint Templates because, Signpost your preferred roadmap to your eager co- travelers and demonstrate clearly how you intend to navigate them towards the desired corporate goal. Use our Business PowerPoint Templates because, Business Template:- There is a vision, a need you can meet. Use our Process and Flows PowerPoint Templates because, to strive to give true form to your great dream. Use these PowerPoint slides for presentations relating to accent, advertisement, arrow, badge, banner, blank, business, button, collection, color, decoration, design, direction, element, financial, flow, graph, horizontal, instruction, label, menu, message, process, promotion, sale, set, shape, steps, symbol, template. The prominent colors used in the PowerPoint template are Yellow, Gray, and Black Find the means with our Ppt Background Linear Demonstration Of 8 Steps Working With Slide Numbers Procedure Image. They will soon be an automatic choice.
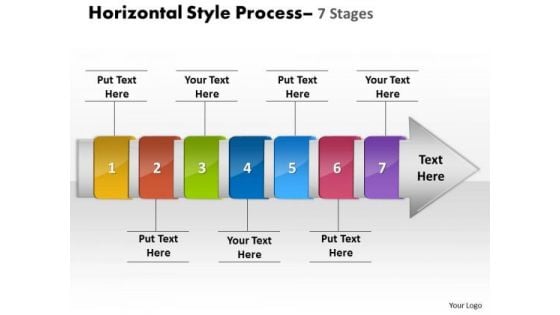
Ppt Theme Linear Demonstration Of 7 Phase Diagram Process 1 Graphic
We present our PPT Theme linear demonstration of 7 phase diagram Process 1 Graphic. Use our Arrows PowerPoint Templates because; now funnel your marketing strategies down the cone, stage by stage, refining as you go along. Use our Shapes PowerPoint Templates because; Use this template to explain the value of its wellness to human life. Use our Finance PowerPoint Templates because, Business Process Design:- The template offers an excellent background to build up the various stages of your business process. Use our Business PowerPoint Templates because, you have played a stellar role and have a few ideas. Use our Process and Flows PowerPoint Templates because, Knowledge is power goes the popular saying. Use these PowerPoint slides for presentations relating to accent, advertisement, arrow, badge, banner, business, button, collection, color, decoration, design, direction, element, financial, flow, graph, horizontal, instruction, isolated, label, manual, message, process, sale, set, shape, steps, symbol, template. The prominent colors used in the PowerPoint template are Yellow, Red, and Green Our Ppt Theme Linear Demonstration Of 7 Phase Diagram Process 1 Graphic are clinically correct. Every detail has been closely examined.
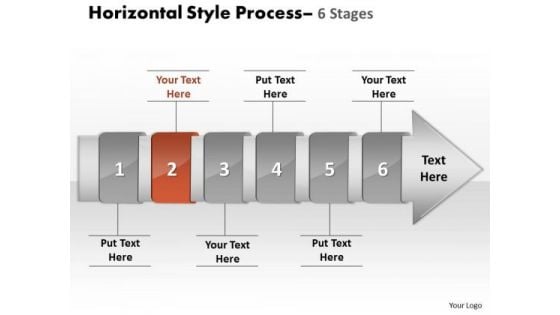
Ppt Theme Horizontal Flow Of 6 Stage Spider Diagram PowerPoint Template 3 Design
We present our PPT Theme horizontal flow of 6 stage spider diagram power point template 3 designs. Use our Arrows PowerPoint Templates because, the goal also clearly etched in your mind. Use our Shapes PowerPoint Templates because, Business 3D Circular Puzzle: - Your business and plans for its growth consist of processes that are highly co-related. Use our Finance PowerPoint Templates because; illustrate your plans on using the many social media modes available to inform society at large of the benefits of your product. Use our Business PowerPoint Templates because, Our PowerPoint templates give this step by step process to achieve the aim. Use our Process and Flows PowerPoint Templates because; illustrate your chain of ideas focusing on that aspect or resource in order to enhance the quality of your product. Use these PowerPoint slides for presentations relating to accent, advertisement, arrow, badge, banner, business, button, collection, color, decoration, design, direction, element, financial, flow, graph, horizontal, instruction, isolated, label, manual, message, process, sale, set, shape, steps, symbol, template. The prominent colors used in the PowerPoint template are Red, Gray, and Black Our Ppt Theme Horizontal Flow Of 6 Stage Spider Diagram PowerPoint Template 3 Design team are knowledge fiends. They are animated encyclopedias.
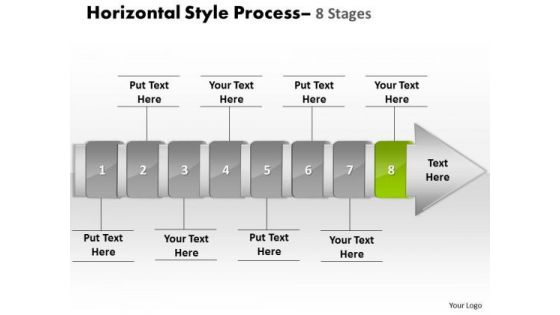
Ppt Theme Linear Demonstration Of 8 Create PowerPoint Macro Procedure 5 Graphic
We present our PPT Theme Linear Demonstration of 8 create power point macro procedure 5 Graphic. Use our Arrows PowerPoint Templates because, you have configured your targets, identified your goals as per priority and importance. Use our Shapes PowerPoint Templates because, Now use this slide to bullet point your views. Use our Finance PowerPoint Templates because, they highlight the depth of your thought process. Use our Business PowerPoint Templates because, Readymade PowerPoint templates for slides to show. Use our Process and Flows PowerPoint Templates because, your ideas are fundamentally stable with a broad base of workable possibilities. Use these PowerPoint slides for presentations relating to accent, advertisement, arrow, badge, banner, business, button, collection, color, decoration, design, direction, element, financial, flow, graph, horizontal, instruction, isolated, label, manual, message, process, sale, set, shape, steps, symbol, template. The prominent colors used in the PowerPoint template are Green, Gray, and Black Our Ppt Theme Linear Demonstration Of 8 Create PowerPoint Macro Procedure 5 Graphic are extremely compatible. Your thoughts will find them absolutely amenable.


 Continue with Email

 Home
Home


