Sales Graph
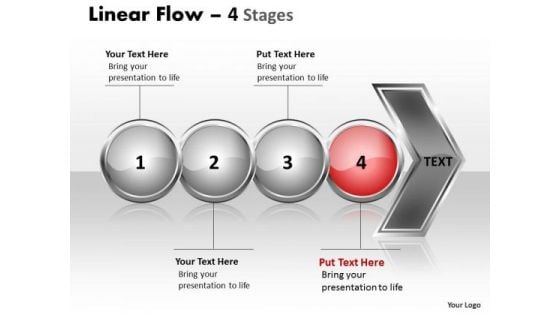
Editable Ppt Template Circular Flow Of 4 Stages Time Management PowerPoint 5 Image
We present our editable PPT template circular flow of 4 stages time management powerpoint 5 Image.Use our Arrows PowerPoint Templates because; colors generate instant reactions in our brains. Use our Signs PowerPoint Templates because, Our cleverly selected background hues are guaranteed to achieve this aim. Use our Shapes PowerPoint Templates because, Activities which in themselves have many inherent business opportunities. Use our Business PowerPoint Templates because, Marketing Strategy Business Template:- maximizing sales of your product is the intended destination. Use our Circle charts PowerPoint Templates because, Our PowerPoint templates designed for your ideas to sell. Use these PowerPoint slides for presentations relating to abstract, arrow, blank, business, chart, circular, circulation, concept, conceptual, diagram, executive, icon, idea, illustration, linear, flow, management, model, organization, procedure, process, progression, resource, stages, steps, strategy. The prominent colors used in the PowerPoint template are Red, Gray, Black Equal or better all records with our Editable Ppt Template Circular Flow Of 4 Stages Time Management PowerPoint 5 Image. Cross all benchmarks earlier set.
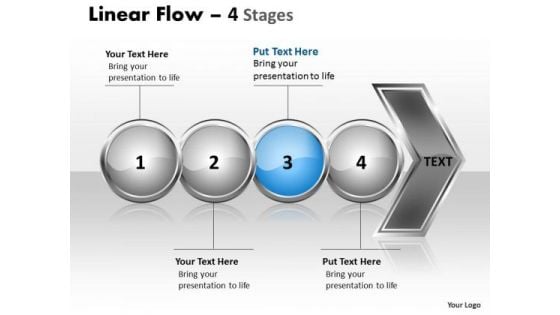
Editable Ppt Template Circular Flow Of 4 Stages Time Management PowerPoint Image
We present our editable PPT template circular flow of 4 stages time management powerpoint Image.Use our Arrows PowerPoint Templates because; Ideas roll along in your mind like billiard balls. Use our Signs PowerPoint Templates because; Transmit your passion via our creative templates. Use our Shapes PowerPoint Templates because, Start with the fundamental basic activities and slowly but surely hone them down to the top of the pyramid, the ultimate goal. Use our Business PowerPoint Templates because, Marketing Strategy Business Template: - maximizing sales of your product is the intended destination. Use our Circle charts PowerPoint Templates because, Gears Interconnected: - The Gear Train is a basic element of living and daily business. Use these PowerPoint slides for presentations relating to abstract, arrow, blank, business, chart, circular, circulation, concept, conceptual, diagram, executive, icon, idea, illustration, linear, flow, management, model, organization, procedure, process, progression, resource, stages, steps, strategy. The prominent colors used in the PowerPoint template are Blue light, Gray, Black Our Editable Ppt Template Circular Flow Of 4 Stages Time Management PowerPoint Image have fantastic ability. They will have an astounding effect on the audience.
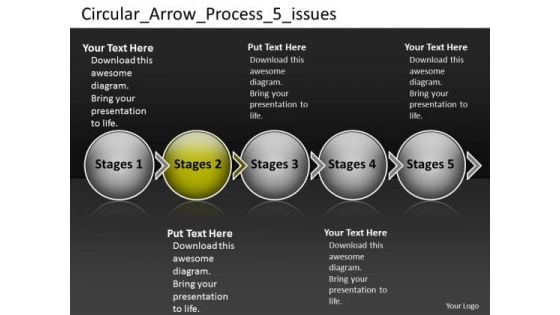
Circular Arrow Process 5 Issues Proto Typing PowerPoint Slides
We present our circular arrow process 5 issues proto typing PowerPoint Slides. Use our Business PowerPoint Templates because, Marketing Strategy Business Template: - Maximizing sales of your product is the intended destination. Use our Circle Charts PowerPoint Templates because, Different people with differing ideas and priorities perform together to score. Use our Arrows PowerPoint Templates because, Display your ideas and highlight their ability to accelerate the growth of your company and you. Use our Signs PowerPoint Templates because, Demonstrate to your audience how the best and most refined ideas pass through. Use our Process and Flows PowerPoint Templates because, you are buzzing with ideas. Use these PowerPoint slides for presentations relating to abstract arrow blank business chart circular circulation concept conceptual diagram executive flow icon idea illustration linear management model organization procedure process progression resource stages steps strategy. The prominent colors used in the PowerPoint template are Green, Gray, and White Identify likely ares of failure. Alert your team with our Circular Arrow Process 5 Issues Proto Typing PowerPoint Slides.
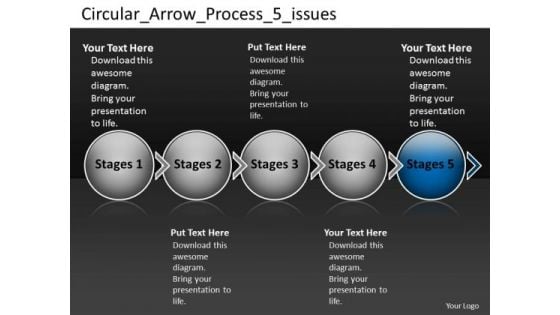
Circular Arrow Process 5 Issues Support Flow Chart PowerPoint Slides
We present our circular arrow process 5 issues support flow chart PowerPoint Slides. Use our Business PowerPoint Templates because, Marketing Strategy Business Template: - Maximizing sales of your product is the intended destination. Use our Circle Charts PowerPoint Templates because, the basic stages are in place, you need to build upon them with our PowerPoint templates. Use our Arrows PowerPoint Templates because, Business 3D Circular Puzzle: - Your business and plans for its growth consist of processes that are highly co-related. Use our Signs PowerPoint Templates because, Our Template designs are State of the Art. Use our Process and Flows PowerPoint Templates because, All elements of the venture are equally critical. Use these PowerPoint slides for presentations relating to abstract arrow blank business chart circular circulation concept conceptual diagram executive flow icon idea illustration linear management model organization procedure process progression resource stages steps strategy. The prominent colors used in the PowerPoint template are Blue, Gray, and White Structure your thoughts with our Circular Arrow Process 5 Issues Support Flow Chart PowerPoint Slides. Download without worries with our money back guaranteee.
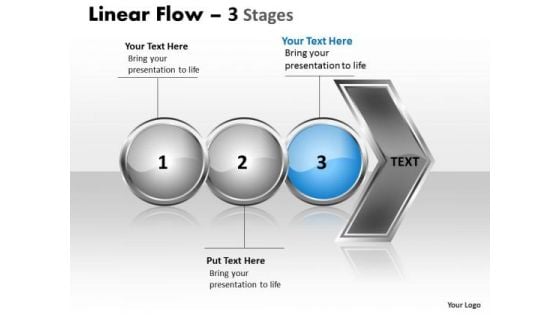
Usa Ppt Theme Horizontal Flow Of 3 Phase Diagram Communication Skills PowerPoint 4 Graphic
We present our USA PPT Theme Horizontal Flow of 3 phase diagram communication skills power point 4 Graphic. Use our Arrows PowerPoint Templates because, Vision Ave Future St Template: - There was a vision of a desired destination and the best road to take to reach that goal. Use our Circle Charts PowerPoint Templates because; Use our templates to lustrate your ability. Use our Business PowerPoint Templates because, Marketing Strategy Business Template:- Maximizing sales of your product is the intended destination. Use our Shapes PowerPoint Templates because, the plans are in your head, stage by stage, year by year. Use our Process and Flows PowerPoint Templates because; educate your team with your thoughts and logic. Use these PowerPoint slides for presentations relating to background, blog, business, chain, communication, community, concept, contact, design, interaction, internet, line, linear, location, logistic, map, modern, movement, network, pointer, reaction, social, stream, structure, system, team,. The prominent colors used in the PowerPoint template are Blue, Gray, and Black Awards will be the feathers in your cap. Accumulate accolades with our Usa Ppt Theme Horizontal Flow Of 3 Phase Diagram Communication Skills PowerPoint 4 Graphic.
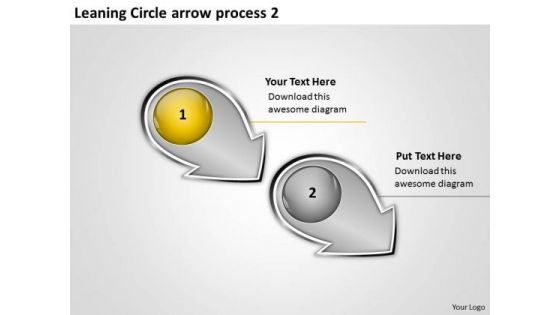
Leaning Circle Arrow Process 2 Ppt Production Flow Chart PowerPoint Slides
We present our leaning circle arrow process 2 ppt production flow chart PowerPoint Slides. Use our Finance PowerPoint Templates because, have always been a source of inspiration for us all. Use our Process and Flows PowerPoint Templates because; now imprint them on the minds of your audience via our slides. Use our Business PowerPoint Templates because, Marketing Strategy Business Template:- Maximizing sales of your product is the intended destination. Use our Circle Charts PowerPoint Templates because; explain the contribution of each of the elements and how they provide impetus to the next phase. Use our Shapes PowerPoint Templates because, you have analyzed the illness and know the need. Use these PowerPoint slides for presentations relating to Arrow, business, circle, circular, collection, connection, cursor, decoration, design, dimensional, direction, element, icon, illustration, information, modern, motion, perspective, process, recycle, recycling, reflective, shape, shiny, sign, symbol, technology. The prominent colors used in the PowerPoint template are Gray, Yellow, and White They say appropriate facial expressions aid communication. Our Leaning Circle Arrow Process 2 Ppt Production Flow Chart PowerPoint Slides can be effective too.
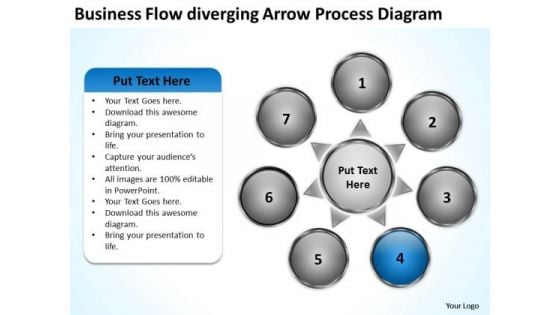
Flow Diverging Arrow Process Diagram Cycle Circular PowerPoint Templates
We present our flow diverging arrow process diagram cycle Circular PowerPoint templates.Present our Success PowerPoint Templates because your quest has taken you well onto the path of success. Use our Shapes PowerPoint Templates because this slide is Designed to help bullet-point your views and thoughts. Download our Business PowerPoint Templates because maximising sales of your product is the intended destination. Present our Circle Charts PowerPoint Templates because the graphic is a symbol of growth and success. Download and present our Process and Flows PowerPoint Templates because you are the Champion of your team shall anoint.Use these PowerPoint slides for presentations relating to Access, Arrow, Background, Banner, Business, Circle, Color, Colorful, Concept, Conceptual, Connection, Corporate, Creative, Cycle, Dark, Design, Different, Element, Empty, Graphic, Group, Illustration, Process, Progress, Shape, Strategy, Symbol, Template. The prominent colors used in the PowerPoint template are Blue, White, Gray. People tell us our flow diverging arrow process diagram cycle Circular PowerPoint templates are Magnificent. Professionals tell us our Color PowerPoint templates and PPT Slides look good visually. Customers tell us our flow diverging arrow process diagram cycle Circular PowerPoint templates are Liberated. Use our Concept PowerPoint templates and PPT Slides are Pretty. We assure you our flow diverging arrow process diagram cycle Circular PowerPoint templates are Reminiscent. Professionals tell us our Concept PowerPoint templates and PPT Slides are Bright. Make the boring bubbly with our Flow Diverging Arrow Process Diagram Cycle Circular PowerPoint Templates. Your thoughts will get them all agog and buzzing.
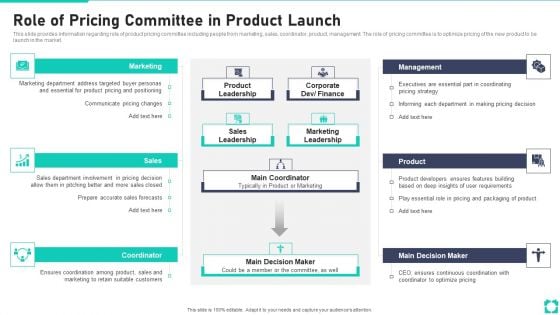
New Product Launch Playbook Role Of Pricing Committee In Product Launch Structure PDF
This slide provides information regarding role of product pricing committee including people from marketing, sales, coordinator, product, management. The role of pricing committee is to optimize pricing of the new product to be launch in the market. Deliver an awe inspiring pitch with this creative new product launch playbook role of pricing committee in product launch structure pdf bundle. Topics like executives are essential, informing each department, sales department involvement can be discussed with this completely editable template. It is available for immediate download depending on the needs and requirements of the user.
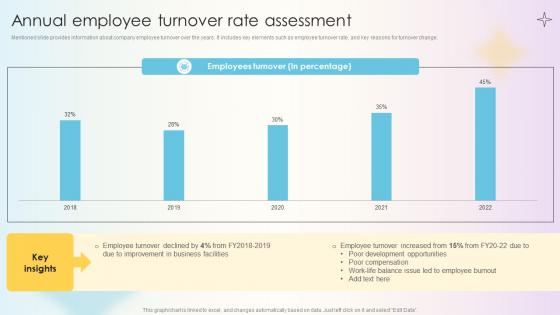
Managing Technical And Non Annual Employee Turnover Rate Assessment
Mentioned slide provides information about company employee turnover over the years. It includes key elements such as employee turnover rate, and key reasons for turnover change. Get a simple yet stunning designed Managing Technical And Non Annual Employee Turnover Rate Assessment. It is the best one to establish the tone in your meetings. It is an excellent way to make your presentations highly effective. So, download this PPT today from Slidegeeks and see the positive impacts. Our easy-to-edit Managing Technical And Non Annual Employee Turnover Rate Assessment can be your go-to option for all upcoming conferences and meetings. So, what are you waiting for Grab this template today. Mentioned slide provides information about company employee turnover over the years. It includes key elements such as employee turnover rate, and key reasons for turnover change.
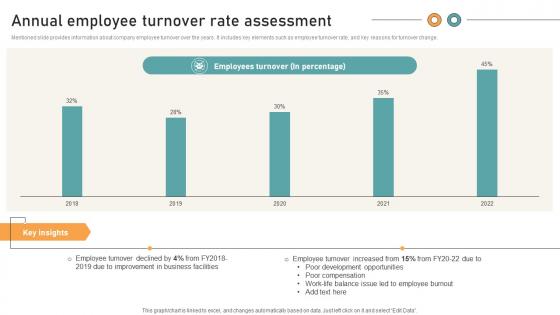
Comprehensive Guide For Website Annual Employee Turnover Rate Assessment
Mentioned slide provides information about company employee turnover over the years. It includes key elements such as employee turnover rate, and key reasons for turnover change. Do you have to make sure that everyone on your team knows about any specific topic I yes, then you should give Comprehensive Guide For Website Annual Employee Turnover Rate Assessment a try. Our experts have put a lot of knowledge and effort into creating this impeccable Comprehensive Guide For Website Annual Employee Turnover Rate Assessment. You can use this template for your upcoming presentations, as the slides are perfect to represent even the tiniest detail. You can download these templates from the Slidegeeks website and these are easy to edit. So grab these today Mentioned slide provides information about company employee turnover over the years. It includes key elements such as employee turnover rate, and key reasons for turnover change.
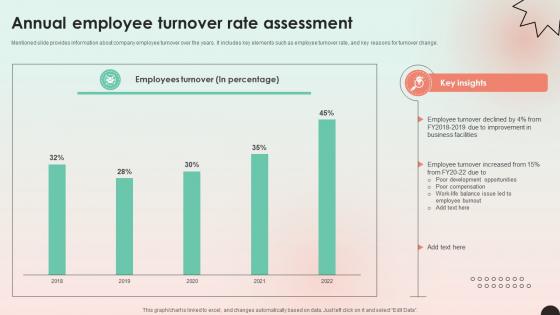
Web Consulting Business Annual Employee Turnover Rate Assessment
Mentioned slide provides information about company employee turnover over the years. It includes key elements such as employee turnover rate, and key reasons for turnover change. From laying roadmaps to briefing everything in detail, our templates are perfect for you. You can set the stage with your presentation slides. All you have to do is download these easy-to-edit and customizable templates. Web Consulting Business Annual Employee Turnover Rate Assessment will help you deliver an outstanding performance that everyone would remember and praise you for. Do download this presentation today. Mentioned slide provides information about company employee turnover over the years. It includes key elements such as employee turnover rate, and key reasons for turnover change.
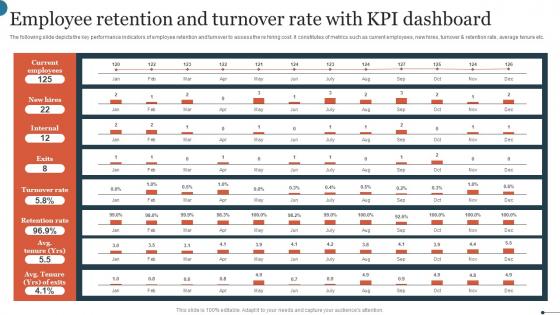
Employee Retention And Turnover Rate With KPI Dashboard Graphics Pdf
The following slide depicts the key performance indicators of employee retention and turnover to assess the re hiring cost. It constitutes of metrics such as current employees, new hires, turnover and retention rate, average tenure etc. Showcasing this set of slides titled Employee Retention And Turnover Rate With KPI Dashboard Graphics Pdf. The topics addressed in these templates are Current Employees, Turnover Rate, Retention Rate. All the content presented in this PPT design is completely editable. Download it and make adjustments in color, background, font etc. as per your unique business setting. The following slide depicts the key performance indicators of employee retention and turnover to assess the re hiring cost. It constitutes of metrics such as current employees, new hires, turnover and retention rate, average tenure etc.

Increasing Employee Turnover Expenses Over Implementing Personnel Downsizing Initiative
This slide shows increasing employee turnover rates due to increase in project management conflicts in the organization over the four quarters in a year Formulating a presentation can take up a lot of effort and time, so the content and message should always be the primary focus. The visuals of the PowerPoint can enhance the presenters message, so our Increasing Employee Turnover Expenses Over Implementing Personnel Downsizing Initiative was created to help save time. Instead of worrying about the design, the presenter can concentrate on the message while our designers work on creating the ideal templates for whatever situation is needed. Slidegeeks has experts for everything from amazing designs to valuable content, we have put everything into Increasing Employee Turnover Expenses Over Implementing Personnel Downsizing Initiative This slide shows increasing employee turnover rates due to increase in project management conflicts in the organization over the four quarters in a year

Human Resource Monthly Turnover Report PPT Template SS
This slide represents the monthly employee turnover report prepared by the human resource department. It includes details related to period, starting, ending, net change, change percent , termination and retention percent . Do you know about Slidesgeeks Human Resource Monthly Turnover Report PPT Template SS These are perfect for delivering any kind od presentation. Using it, create PowerPoint presentations that communicate your ideas and engage audiences. Save time and effort by using our pre-designed presentation templates that are perfect for a wide range of topic. Our vast selection of designs covers a range of styles, from creative to business, and are all highly customizable and easy to edit. Download as a PowerPoint template or use them as Google Slides themes. This slide represents the monthly employee turnover report prepared by the human resource department. It includes details related to period, starting, ending, net change, change percent , termination and retention percent .
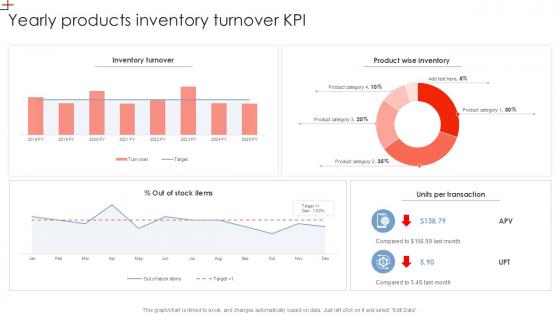
Yearly Products Inventory Turnover KPI PPT PowerPoint SS
From laying roadmaps to briefing everything in detail, our templates are perfect for you. You can set the stage with your presentation slides. All you have to do is download these easy-to-edit and customizable templates. Yearly Products Inventory Turnover KPI PPT PowerPoint SS will help you deliver an outstanding performance that everyone would remember and praise you for. Do download this presentation today. Our Yearly Products Inventory Turnover KPI PPT PowerPoint SS are topically designed to provide an attractive backdrop to any subject. Use them to look like a presentation pro.
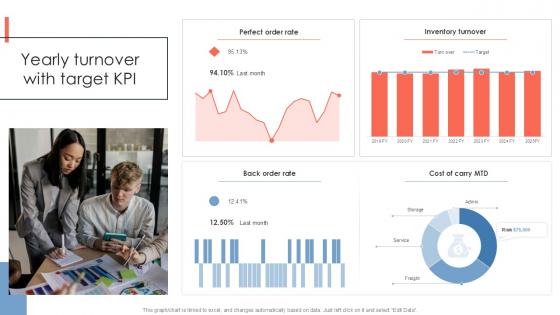
Yearly Turnover With Target KPI PPT Example SS
Present like a pro with Yearly Turnover With Target KPI PPT Example SS. Create beautiful presentations together with your team, using our easy-to-use presentation slides. Share your ideas in real-time and make changes on the fly by downloading our templates. So whether you are in the office, on the go, or in a remote location, you can stay in sync with your team and present your ideas with confidence. With Slidegeeks presentation got a whole lot easier. Grab these presentations today. Our Yearly Turnover With Target KPI PPT Example SS are topically designed to provide an attractive backdrop to any subject. Use them to look like a presentation pro.
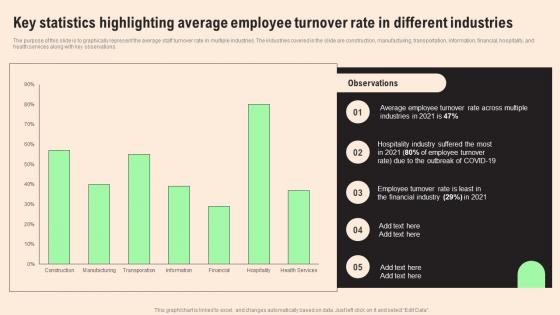
Key Statistics Highlighting Average Employee Turnover Rate In Different Industries Diagrams Pdf
The purpose of this slide is to graphically represent the average staff turnover rate in multiple industries. The industries covered in the slide are construction, manufacturing, transportation, information, financial, hospitality, and health services along with key observations. Boost your pitch with our creative Key Statistics Highlighting Average Employee Turnover Rate In Different Industries Diagrams Pdf. Deliver an awe inspiring pitch that will mesmerize everyone. Using these presentation templates you will surely catch everyones attention. You can browse the ppts collection on our website. We have researchers who are experts at creating the right content for the templates. So you do not have to invest time in any additional work. Just grab the template now and use them. The purpose of this slide is to graphically represent the average staff turnover rate in multiple industries. The industries covered in the slide are construction, manufacturing, transportation, information, financial, hospitality, and health services along with key observations.
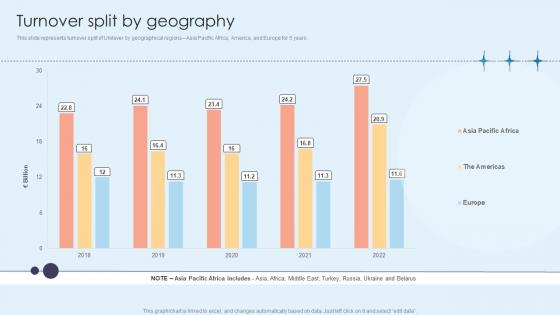
Turnover Split By Geography Home Care Solutions Company Profile CP SS V
This slide represents turnover split of Unilever by geographical regions Asia Pacific Africa, America, and Europe for 5 years.Retrieve professionally designed Turnover Split By Geography Home Care Solutions Company Profile CP SS V to effectively convey your message and captivate your listeners. Save time by selecting pre-made slideshows that are appropriate for various topics, from business to educational purposes. These themes come in many different styles, from creative to corporate, and all of them are easily adjustable and can be edited quickly. Access them as PowerPoint templates or as Google Slides themes. You do not have to go on a hunt for the perfect presentation because Slidegeeks got you covered from everywhere. This slide represents turnover split of Unilever by geographical regions Asia Pacific Africa, America, and Europe for 5 years.

Insurance Firm Start Up Financial Detailed Analysis Of Insurance Agency Business Income Formats Pdf
This slide represents graphs of gross profit of the business and earnings before interest tax and depreciation. The purpose of this slide is to give a brief about the business profitability and what the business will get before paying of any expenses related to interest, tax and depreciation with key highlights. Want to ace your presentation in front of a live audience Our Insurance Firm Start Up Financial Detailed Analysis Of Insurance Agency Business Income Formats Pdf can help you do that by engaging all the users towards you. Slidegeeks experts have put their efforts and expertise into creating these impeccable powerpoint presentations so that you can communicate your ideas clearly. Moreover, all the templates are customizable, and easy-to-edit and downloadable. Use these for both personal and commercial use. This slide represents graphs of gross profit of the business and earnings before interest tax and depreciation. The purpose of this slide is to give a brief about the business profitability and what the business will get before paying of any expenses related to interest, tax and depreciation with key highlights.
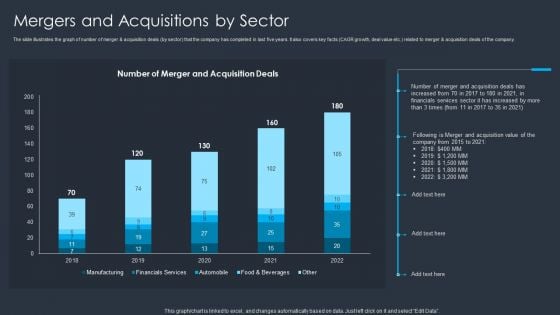
Merger And Acquisition Buying Strategy For Business Growth Mergers And Acquisitions By Sector Designs PDF
The slide illustrates the graph of number of merger and acquisition deals by sector that the company has completed in last five years. It also covers key facts CAGR growth, deal value etc. related to merger and acquisition deals of the company. Deliver an awe inspiring pitch with this creative Merger And Acquisition Buying Strategy For Business Growth Mergers And Acquisitions By Sector Designs PDF bundle. Topics like Acquisition Value, Financials Services Sector can be discussed with this completely editable template. It is available for immediate download depending on the needs and requirements of the user.
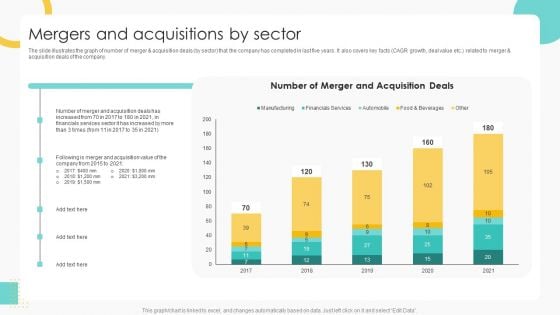
Buy Side Merger And Acquisition Pitch Book Mergers And Acquisitions By Sector Summary PDF
The slide illustrates the graph of number of merger and acquisition deals by sector that the company has completed in last five years. It also covers key facts CAGR growth, deal value etc. related to merger and acquisition deals of the company. Deliver an awe inspiring pitch with this creative Buy Side Merger And Acquisition Pitch Book Mergers And Acquisitions By Sector Summary PDF bundle. Topics like Financials Services, Acquisition Value can be discussed with this completely editable template. It is available for immediate download depending on the needs and requirements of the user.
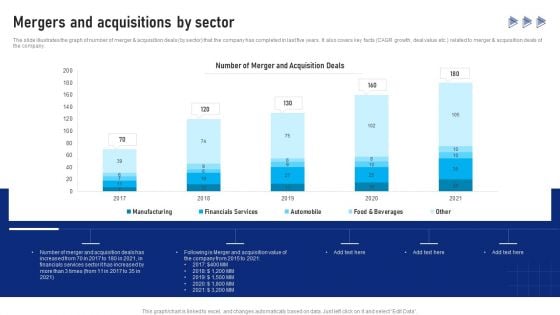
Buy Side Advisory Services In M And A Mergers And Acquisitions By Sector Introduction PDF
The slide illustrates the graph of number of merger and acquisition deals by sector that the company has completed in last five years. It also covers key facts CAGR growth, deal value etc. related to merger and acquisition deals of the company.There are so many reasons you need a Buy Side Advisory Services In M And A Mergers And Acquisitions By Sector Introduction PDF. The first reason is you can not spend time making everything from scratch, Thus, Slidegeeks has made presentation templates for you too. You can easily download these templates from our website easily.
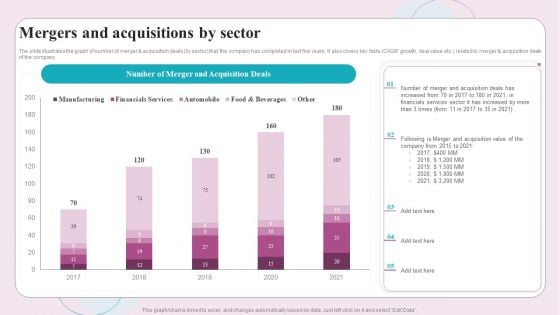
Buy Side M And A Service Mergers And Acquisitions By Sector Ppt Professional Deck PDF
The slide illustrates the graph of number of merger and acquisition deals by sector that the company has completed in last five years. It also covers key facts CAGR growth, deal value etc. related to merger and acquisition deals of the company. If your project calls for a presentation, then Slidegeeks is your go-to partner because we have professionally designed, easy-to-edit templates that are perfect for any presentation. After downloading, you can easily edit Buy Side M And A Service Mergers And Acquisitions By Sector Ppt Professional Deck PDF and make the changes accordingly. You can rearrange slides or fill them with different images. Check out all the handy templates
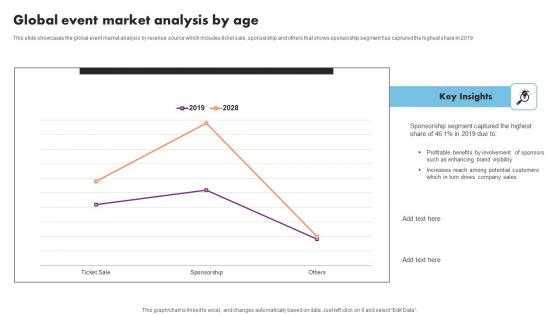
Global Event Market Analysis By Age Event Management Business Plan Go To Market Strategy Microsoft Pdf
This slide showcases the global event market analysis by revenue source which includes ticket sale, sponsorship and others that shows sponsorship segment has caprured the highest share in 2019 Are you in need of a template that can accommodate all of your creative concepts This one is crafted professionally and can be altered to fit any style. Use it with Google Slides or PowerPoint. Include striking photographs, symbols, depictions, and other visuals. Fill, move around, or remove text boxes as desired. Test out color palettes and font mixtures. Edit and save your work, or work with colleagues. Download Global Event Market Analysis By Age Event Management Business Plan Go To Market Strategy Microsoft Pdf and observe how to make your presentation outstanding. Give an impeccable presentation to your group and make your presentation unforgettable. This slide showcases the global event market analysis by revenue source which includes ticket sale, sponsorship and others that shows sponsorship segment has caprured the highest share in 2019
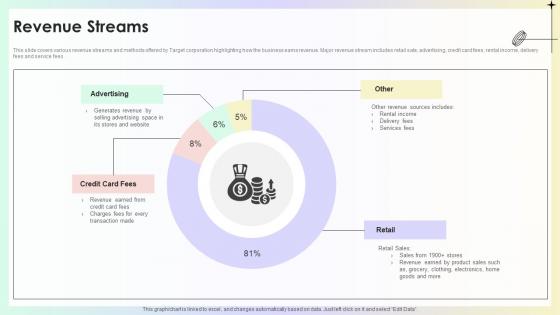
Revenue Streams Target Store Investor Funding Pitch Deck
This slide covers various revenue streams and methods offered by Target corporation highlighting how the business earns revenue. Major revenue stream includes retail sale, advertising, credit card fees, rental income, delivery fees and service fees. This modern and well-arranged Revenue Streams Target Store Investor Funding Pitch Deck provides lots of creative possibilities. It is very simple to customize and edit with the Powerpoint Software. Just drag and drop your pictures into the shapes. All facets of this template can be edited with Powerpoint, no extra software is necessary. Add your own material, put your images in the places assigned for them, adjust the colors, and then you can show your slides to the world, with an animated slide included. This slide covers various revenue streams and methods offered by Target corporation highlighting how the business earns revenue. Major revenue stream includes retail sale, advertising, credit card fees, rental income, delivery fees and service fees.
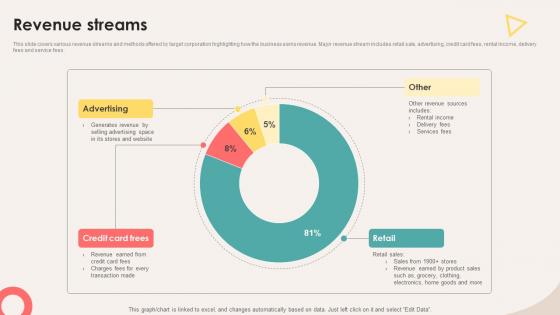
Revenue Streams Retail Store Investor Elevator Pitch Deck
This slide covers various revenue streams and methods offered by target corporation highlighting how the business earns revenue. Major revenue stream includes retail sale, advertising, credit card fees, rental income, delivery fees and service fees. This modern and well-arranged Revenue Streams Retail Store Investor Elevator Pitch Deck provides lots of creative possibilities. It is very simple to customize and edit with the Powerpoint Software. Just drag and drop your pictures into the shapes. All facets of this template can be edited with Powerpoint, no extra software is necessary. Add your own material, put your images in the places assigned for them, adjust the colors, and then you can show your slides to the world, with an animated slide included. This slide covers various revenue streams and methods offered by target corporation highlighting how the business earns revenue. Major revenue stream includes retail sale, advertising, credit card fees, rental income, delivery fees and service fees.
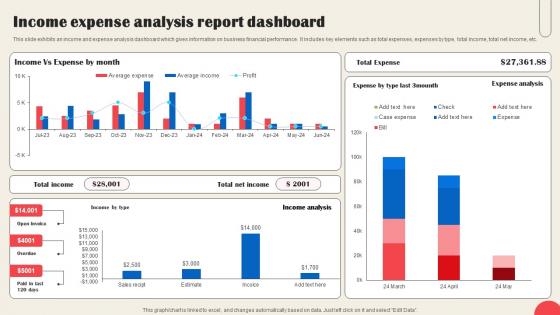
Income Expense Analysis Report Dashboard Sample Pdf
This slide exhibits an income and expense analysis dashboard which gives information on business financial performance. It includes key elements such as total expenses, expenses by type, total income, total net income, etc. Pitch your topic with ease and precision using this Income Expense Analysis Report Dashboard Sample Pdf This layout presents information on Income Expense, Analysis Report Dashboard It is also available for immediate download and adjustment. So, changes can be made in the color, design, graphics or any other component to create a unique layout. This slide exhibits an income and expense analysis dashboard which gives information on business financial performance. It includes key elements such as total expenses, expenses by type, total income, total net income, etc.
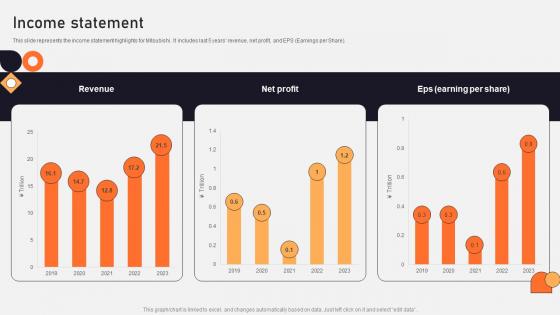
Income Statement Vehicle Manufacturing Company Profile CP SS V
This slide represents the income statement highlights for Mitsubishi . It includes last 5 years revenue, net profit, and EPS Earnings per Share. Crafting an eye-catching presentation has never been more straightforward. Let your presentation shine with this tasteful yet straightforward Income Statement Vehicle Manufacturing Company Profile CP SS V template. It offers a minimalistic and classy look that is great for making a statement. The colors have been employed intelligently to add a bit of playfulness while still remaining professional. Construct the ideal Income Statement Vehicle Manufacturing Company Profile CP SS V that effortlessly grabs the attention of your audience Begin now and be certain to wow your customers This slide represents the income statement highlights for Mitsubishi . It includes last 5 years revenue, net profit, and EPS Earnings per Share.
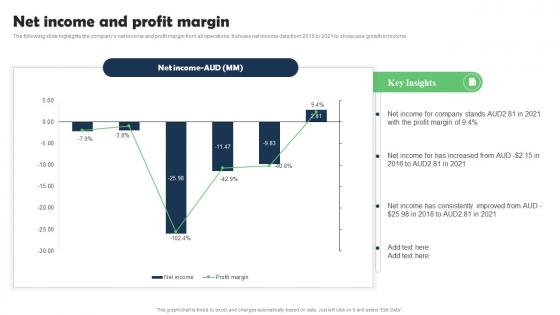
Net Income And Profit Marketing Research Services Management Business Information Pdf
The following slide highlights the companys net income and profit margin from all operations. It shows net income data from 2016 to 2021 to showcase growth in income. Explore a selection of the finest Net Income And Profit Marketing Research Services Management Business Information Pdf here. With a plethora of professionally designed and pre-made slide templates, you can quickly and easily find the right one for your upcoming presentation. You can use our Net Income And Profit Marketing Research Services Management Business Information Pdf to effectively convey your message to a wider audience. Slidegeeks has done a lot of research before preparing these presentation templates. The content can be personalized and the slides are highly editable. Grab templates today from Slidegeeks. The following slide highlights the companys net income and profit margin from all operations. It shows net income data from 2016 to 2021 to showcase growth in income.
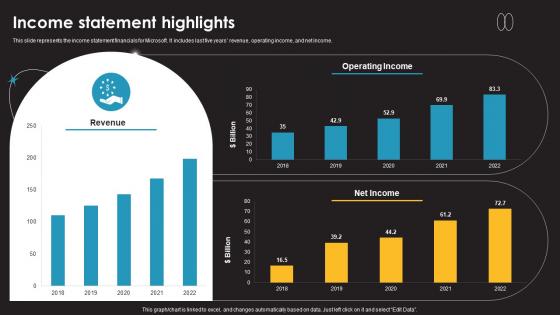
Income Statement Highlights Information Technology Services Provider Company Profile CP SS V
This slide represents the income statement financials for Microsoft. It includes last five years revenue, operating income, and net income.If you are looking for a format to display your unique thoughts, then the professionally designed Income Statement Highlights Information Technology Services Provider Company Profile CP SS V is the one for you. You can use it as a Google Slides template or a PowerPoint template. Incorporate impressive visuals, symbols, images, and other charts. Modify or reorganize the text boxes as you desire. Experiment with shade schemes and font pairings. Alter, share or cooperate with other people on your work. Download Income Statement Highlights Information Technology Services Provider Company Profile CP SS V and find out how to give a successful presentation. Present a perfect display to your team and make your presentation unforgettable. This slide represents the income statement financials for Microsoft. It includes last five years revenue, operating income, and net income.
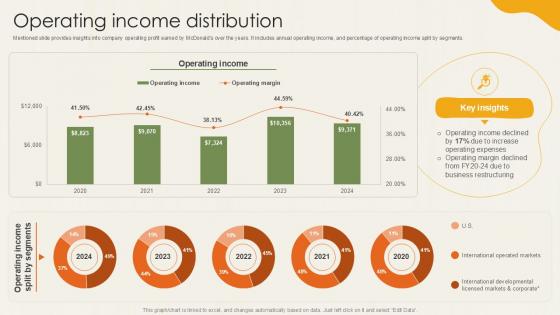
Operating Income Distribution Food Retailer Company Profile Ppt Presentation CP SS V
Mentioned slide provides insights into company operating profit earned by McDonalds over the years. It includes annual operating income, and percentage of operating income split by segments. Explore a selection of the finest Operating Income Distribution Food Retailer Company Profile Ppt Presentation CP SS V here. With a plethora of professionally designed and pre-made slide templates, you can quickly and easily find the right one for your upcoming presentation. You can use our Operating Income Distribution Food Retailer Company Profile Ppt Presentation CP SS V to effectively convey your message to a wider audience. Slidegeeks has done a lot of research before preparing these presentation templates. The content can be personalized and the slides are highly editable. Grab templates today from Slidegeeks. Mentioned slide provides insights into company operating profit earned by McDonalds over the years. It includes annual operating income, and percentage of operating income split by segments.
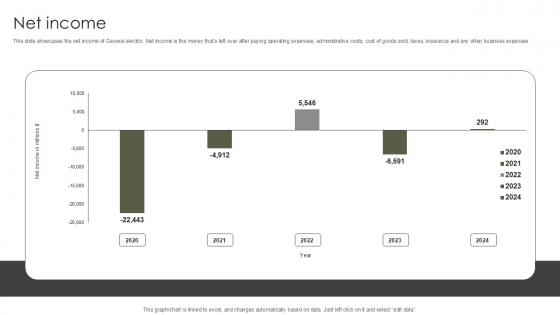
Net Income Military Aircraft Engine Manufacturing PPT Presentation CP SS V
This slide showcases the net income of General electric. Net income is the money thats left over after paying operating expenses, administrative costs, cost of goods sold, taxes, insurance and any other business expenses. Slidegeeks has constructed Net Income Military Aircraft Engine Manufacturing PPT Presentation CP SS V after conducting extensive research and examination. These presentation templates are constantly being generated and modified based on user preferences and critiques from editors. Here, you will find the most attractive templates for a range of purposes while taking into account ratings and remarks from users regarding the content. This is an excellent jumping-off point to explore our content and will give new users an insight into our top-notch PowerPoint Templates. This slide showcases the net income of General electric. Net income is the money thats left over after paying operating expenses, administrative costs, cost of goods sold, taxes, insurance and any other business expenses
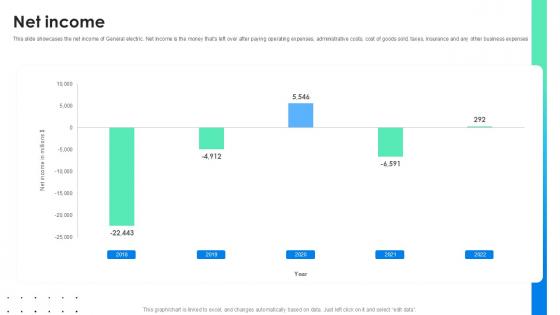
Net Income Global Energy Company Profile PPT Sample CP SS V
This slide showcases the net income of General electric. Net income is the money thats left over after paying operating expenses, administrative costs, cost of goods sold, taxes, insurance and any other business expenses. Slidegeeks has constructed Net Income Global Energy Company Profile PPT Sample CP SS V after conducting extensive research and examination. These presentation templates are constantly being generated and modified based on user preferences and critiques from editors. Here, you will find the most attractive templates for a range of purposes while taking into account ratings and remarks from users regarding the content. This is an excellent jumping-off point to explore our content and will give new users an insight into our top-notch PowerPoint Templates. This slide showcases the net income of General electric. Net income is the money thats left over after paying operating expenses, administrative costs, cost of goods sold, taxes, insurance and any other business expenses
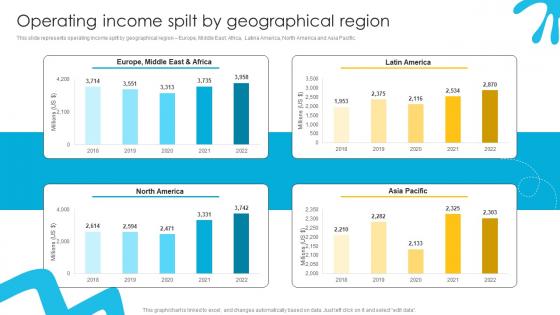
Operating Income Spilt By Geographical Liquid Refreshment Manufacturer Company Profile Ppt Example CP SS V
This slide represents operating income spilt by geographical region Europe, Middle East, Africa, Latina America, North America and Asia Pacific. Explore a selection of the finest Operating Income Spilt By Geographical Liquid Refreshment Manufacturer Company Profile Ppt Example CP SS V here. With a plethora of professionally designed and pre-made slide templates, you can quickly and easily find the right one for your upcoming presentation. You can use our Operating Income Spilt By Geographical Liquid Refreshment Manufacturer Company Profile Ppt Example CP SS V to effectively convey your message to a wider audience. Slidegeeks has done a lot of research before preparing these presentation templates. The content can be personalized and the slides are highly editable. Grab templates today from Slidegeeks. This slide represents operating income spilt by geographical region Europe, Middle East, Africa, Latina America, North America and Asia Pacific.
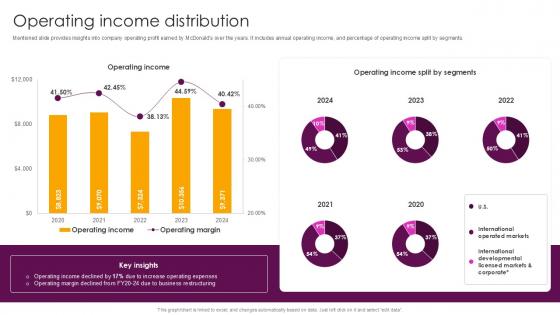
Operating Income Distribution Food And Beverages Company Profile Ppt Slide CP SS V
Mentioned slide provides insights into company operating profit earned by McDonalds over the years. It includes annual operating income, and percentage of operating income split by segments. Here you can discover an assortment of the finest PowerPoint and Google Slides templates. With these templates, you can create presentations for a variety of purposes while simultaneously providing your audience with an eye-catching visual experience. Download Operating Income Distribution Food And Beverages Company Profile Ppt Slide CP SS V to deliver an impeccable presentation. These templates will make your job of preparing presentations much quicker, yet still, maintain a high level of quality. Slidegeeks has experienced researchers who prepare these templates and write high-quality content for you. Later on, you can personalize the content by editing the Operating Income Distribution Food And Beverages Company Profile Ppt Slide CP SS V Mentioned slide provides insights into company operating profit earned by McDonalds over the years. It includes annual operating income, and percentage of operating income split by segments.
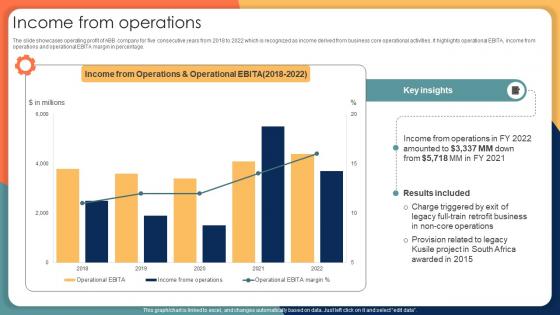
Income From Operations Engineering Solution Provider Company Profile CP SS V
The slide showcases operating profit of ABB company for five consecutive years from 2018 to 2022 which is recognized as income derived from business core operational activities. It highlights operational EBITA, income from operations and operational EBITA margin in percentage. Coming up with a presentation necessitates that the majority of the effort goes into the content and the message you intend to convey. The visuals of a PowerPoint presentation can only be effective if it supplements and supports the story that is being told. Keeping this in mind our experts created Income From Operations Engineering Solution Provider Company Profile CP SS V to reduce the time that goes into designing the presentation. This way, you can concentrate on the message while our designers take care of providing you with the right template for the situation. The slide showcases operating profit of ABB company for five consecutive years from 2018 to 2022 which is recognized as income derived from business core operational activities. It highlights operational EBITA, income from operations and operational EBITA margin in percentage.
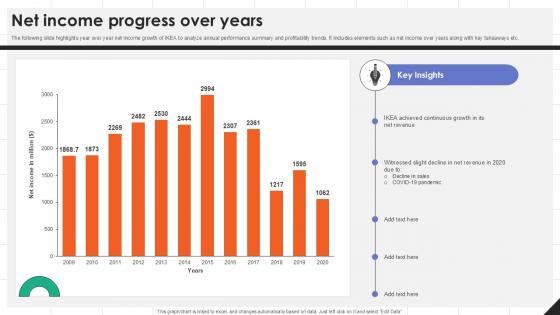
Net Income Progress Over Years IKEAs Successful Market Expansion PPT Example Strategy SS V
The following slide highlights year over year net income growth of IKEA to analyze annual performance summary and profitability trends. It includes elements such as net income over years along with key takeaways etc. Are you in need of a template that can accommodate all of your creative concepts This one is crafted professionally and can be altered to fit any style. Use it with Google Slides or PowerPoint. Include striking photographs, symbols, depictions, and other visuals. Fill, move around, or remove text boxes as desired. Test out color palettes and font mixtures. Edit and save your work, or work with colleagues. Download Net Income Progress Over Years IKEAs Successful Market Expansion PPT Example Strategy SS V and observe how to make your presentation outstanding. Give an impeccable presentation to your group and make your presentation unforgettable. The following slide highlights year over year net income growth of IKEA to analyze annual performance summary and profitability trends. It includes elements such as net income over years along with key takeaways etc.

Annual Revenue And Net Income Global Innovation And Business Solutions Company Profile CP SS V
This slide represents on financial highlights of Accenture which represents revenue and net income for last five years from 2018 to 2022.Boost your pitch with our creative Annual Revenue And Net Income Global Innovation And Business Solutions Company Profile CP SS V. Deliver an awe-inspiring pitch that will mesmerize everyone. Using these presentation templates you will surely catch everyones attention. You can browse the ppts collection on our website. We have researchers who are experts at creating the right content for the templates. So you do not have to invest time in any additional work. Just grab the template now and use them. This slide represents on financial highlights of Accenture which represents revenue and net income for last five years from 2018 to 2022.
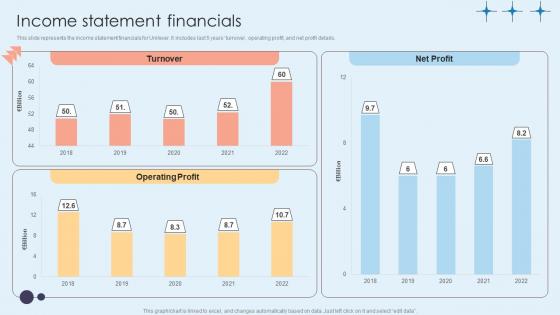
Income Statement Financials Home Care Solutions Company Profile CP SS V
This slide represents the income statement financials for Unilever. It includes last 5 yearsturnover, operating profit, and net profit details.Welcome to our selection of the Income Statement Financials Home Care Solutions Company Profile CP SS V. These are designed to help you showcase your creativity and bring your sphere to life. Planning and Innovation are essential for any business that is just starting out. This collection contains the designs that you need for your everyday presentations. All of our PowerPoints are 100 percent editable, so you can customize them to suit your needs. This multi-purpose template can be used in various situations. Grab these presentation templates today. This slide represents the income statement financials for Unilever. It includes last 5 yearsturnover, operating profit, and net profit details.

Annual Revenue And Net Income Global Consulting And Technology Services Company Profile CP SS V
This slide represents on financial highlights of Accenture which represents revenue and net income for last five years from 2018 to 2022.Boost your pitch with our creative Annual Revenue And Net Income Global Consulting And Technology Services Company Profile CP SS V. Deliver an awe-inspiring pitch that will mesmerize everyone. Using these presentation templates you will surely catch everyones attention. You can browse the ppts collection on our website. We have researchers who are experts at creating the right content for the templates. So you do not have to invest time in any additional work. Just grab the template now and use them. This slide represents on financial highlights of Accenture which represents revenue and net income for last five years from 2018 to 2022.
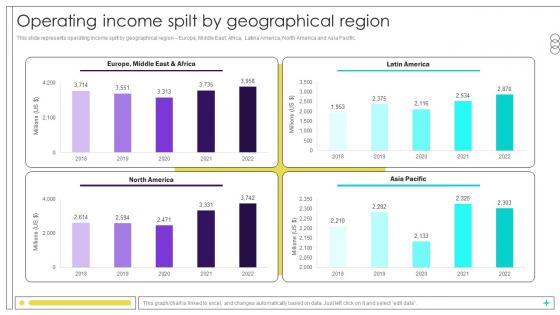
Operating Income Spilt By Geographical Region Beverage Manufacturer Company Profile Ppt Powerpoint CP SS V
The best PPT templates are a great way to save time, energy, and resources. Slidegeeks have 100 percent editable powerpoint slides making them incredibly versatile. With these quality presentation templates, you can create a captivating and memorable presentation by combining visually appealing slides and effectively communicating your message. Download Operating Income Spilt By Geographical Region Beverage Manufacturer Company Profile Ppt Powerpoint CP SS V from Slidegeeks and deliver a wonderful presentation. This slide represents operating income spilt by geographical region Europe, Middle East, Africa, Latina America, North America and Asia Pacific.
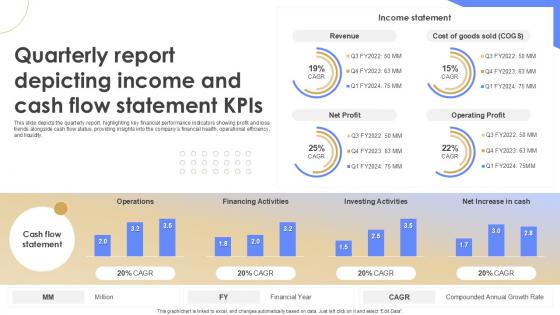
Quarterly Report Depicting Income And Cash Flow Statement KPIS Quarterly Report Ppt Example
This slide depicts the quarterly report, highlighting key financial performance indicators showing profit and loss trends alongside cash flow status, providing insights into the companys financial health, operational efficiency, and liquidity. Do you have an important presentation coming up Are you looking for something that will make your presentation stand out from the rest Look no further than Quarterly Report Depicting Income And Cash Flow Statement KPIS Quarterly Report Ppt Example With our professional designs, you can trust that your presentation will pop and make delivering it a smooth process. And with Slidegeeks, you can trust that your presentation will be unique and memorable. So why wait Grab Quarterly Report Depicting Income And Cash Flow Statement KPIS Quarterly Report Ppt Example today and make your presentation stand out from the rest This slide depicts the quarterly report, highlighting key financial performance indicators showing profit and loss trends alongside cash flow status, providing insights into the companys financial health, operational efficiency, and liquidity.
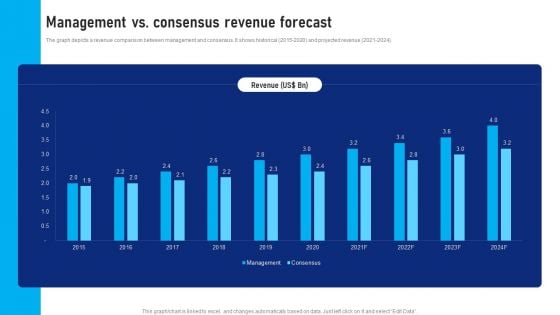
Buy Side Advisory Services In M And A Management Vs Consensus Revenue Forecast Ideas PDF
The graph depicts a revenue comparison between management and consensus. It shows historical 2015 to 2020 and projected revenue 2021 to 2024.Want to ace your presentation in front of a live audience Our Buy Side Advisory Services In M And A Management Vs Consensus Revenue Forecast Ideas PDF can help you do that by engaging all the users towards you. Slidegeeks experts have put their efforts and expertise into creating these impeccable powerpoint presentations so that you can communicate your ideas clearly. Moreover, all the templates are customizable, and easy-to-edit and downloadable. Use these for both personal and commercial use.
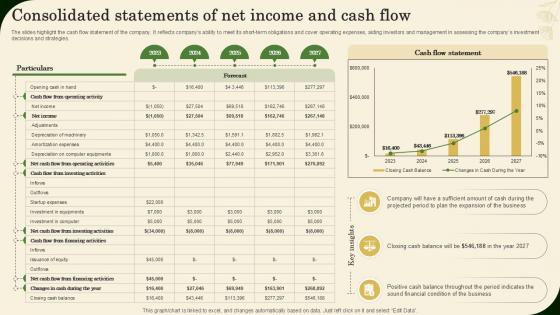
Consolidated Statements Of Net Income And Cash Flow Landscaping Business Plan Ppt Template BP SS V
The slides highlight the cash flow statement of the company. It reflects companys ability to meet its short-term obligations and cover operating expenses, aiding investors and management in assessing the companys investment decisions and strategies. Get a simple yet stunning designed Consolidated Statements Of Net Income And Cash Flow Landscaping Business Plan Ppt Template BP SS V It is the best one to establish the tone in your meetings. It is an excellent way to make your presentations highly effective. So, download this PPT today from Slidegeeks and see the positive impacts. Our easy-to-edit Consolidated Statements Of Net Income And Cash Flow Landscaping Business Plan Ppt Template BP SS V can be your go-to option for all upcoming conferences and meetings. So, what are you waiting for Grab this template today. The slides highlight the cash flow statement of the company. It reflects companys ability to meet its short-term obligations and cover operating expenses, aiding investors and management in assessing the companys investment decisions and strategies.

Company Profit And Loss Dashboard With Income Statement Strategic Approaches To Corporate Financial
This slide provides a KPI dashboard that enables an organization to track revenue, expenses, and profit incurred in a specific period. It includes gross profit margin, OPEX ratio, operating profit margin, and net profit margin. Want to ace your presentation in front of a live audience Our Company Profit And Loss Dashboard With Income Statement Strategic Approaches To Corporate Financial can help you do that by engaging all the users towards you. Slidegeeks experts have put their efforts and expertise into creating these impeccable powerpoint presentations so that you can communicate your ideas clearly. Moreover, all the templates are customizable, and easy-to-edit and downloadable. Use these for both personal and commercial use. This slide provides a KPI dashboard that enables an organization to track revenue, expenses, and profit incurred in a specific period. It includes gross profit margin, OPEX ratio, operating profit margin, and net profit margin.
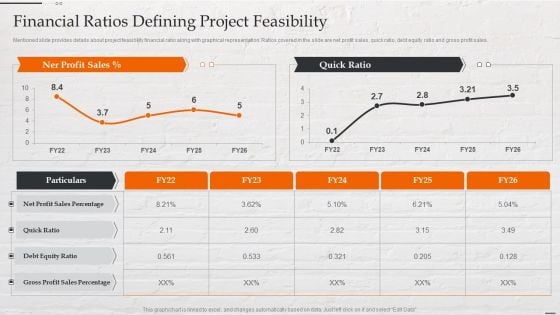
Capital Investment Options Financial Ratios Defining Project Feasibility Guidelines PDF
Mentioned slide provides details about project feasibility financial ratio along with graphical representation. Ratios covered in the slide are net profit sales, quick ratio, debt equity ratio and gross profit sales. Deliver an awe inspiring pitch with this creative Capital Investment Options Financial Ratios Defining Project Feasibility Guidelines PDF bundle. Topics like Net Profit Sales, Quick Ratio, Debt Equity Ratio can be discussed with this completely editable template. It is available for immediate download depending on the needs and requirements of the user.
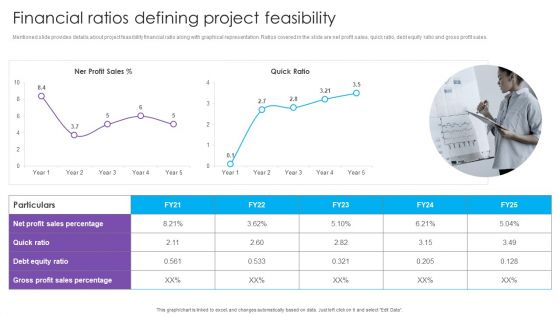
Financial Ratios Defining Project Feasibility Real Estate Project Funding Clipart PDF
Mentioned slide provides details about project feasibility financial ratio along with graphical representation. Ratios covered in the slide are net profit sales, quick ratio, debt equity ratio and gross profit sales.Deliver an awe inspiring pitch with this creative Financial Ratios Defining Project Feasibility Real Estate Project Funding Clipart PDF bundle. Topics like Profit Sales, Debt Equity, Gross Profit can be discussed with this completely editable template. It is available for immediate download depending on the needs and requirements of the user.
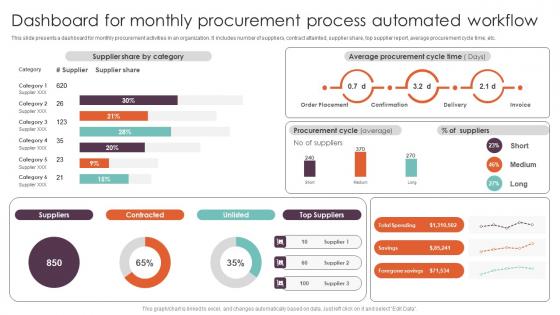
Dashboard For Monthly Procurement Process Techniques Executing Workflow Guidelines Pdf
This slide presents a dashboard for monthly procurement activities in an organization. It includes number of suppliers, contract attainted, supplier share, top supplier report, average procurement cycle time, etc. Present like a pro with Dashboard For Monthly Procurement Process Techniques Executing Workflow Guidelines Pdf Create beautiful presentations together with your team, using our easy-to-use presentation slides. Share your ideas in real-time and make changes on the fly by downloading our templates. So whether you are in the office, on the go, or in a remote location, you can stay in sync with your team and present your ideas with confidence. With Slidegeeks presentation got a whole lot easier. Grab these presentations today. This slide presents a dashboard for monthly procurement activities in an organization. It includes number of suppliers, contract attainted, supplier share, top supplier report, average procurement cycle time, etc.
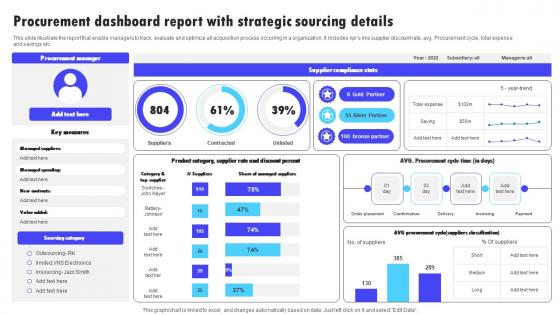
Procurement Dashboard Report With Strategic Sourcing Details Information Pdf
This slide illustrate the report that enable managers to track, evaluate and optimize all acquisition process occurring in a organization. It includes kpis like supplier discount rate, avg. Procurement cycle, total expense and savings etc. Pitch your topic with ease and precision using this Procurement Dashboard Report With Strategic Sourcing Details Information Pdf. This layout presents information on Supplier Compliance Stats, Procurement Manager, Sourcing Category. It is also available for immediate download and adjustment. So, changes can be made in the color, design, graphics or any other component to create a unique layout. This slide illustrate the report that enable managers to track, evaluate and optimize all acquisition process occurring in a organization. It includes kpis like supplier discount rate, avg. Procurement cycle, total expense and savings etc.
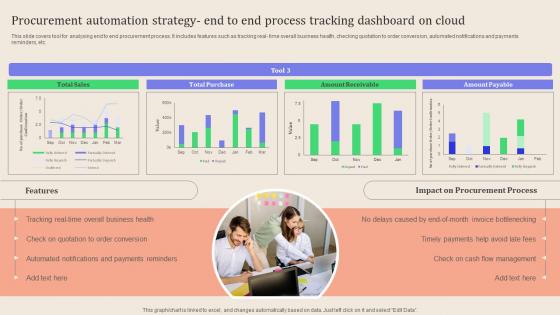
Leveraging Logistics Automation Procurement Automation Strategy End To Summary Pdf
This slide covers tool for analysing end to end procurement process. It includes features such as tracking real time overall business health, checking quotation to order conversion, automated notifications and payments reminders, etc. Presenting this PowerPoint presentation, titled Leveraging Logistics Automation Procurement Automation Strategy End To Summary Pdf, with topics curated by our researchers after extensive research. This editable presentation is available for immediate download and provides attractive features when used. Download now and captivate your audience. Presenting this Leveraging Logistics Automation Procurement Automation Strategy End To Summary Pdf. Our researchers have carefully researched and created these slides with all aspects taken into consideration. This is a completely customizable Leveraging Logistics Automation Procurement Automation Strategy End To Summary Pdf that is available for immediate downloading. Download now and make an impact on your audience. Highlight the attractive features available with our PPTs. This slide covers tool for analysing end to end procurement process. It includes features such as tracking real time overall business health, checking quotation to order conversion, automated notifications and payments reminders, etc.
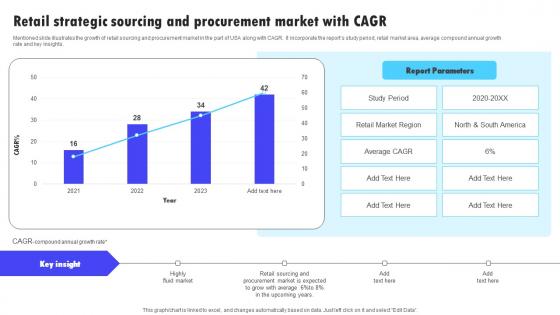
Retail Strategic Sourcing And Procurement Market With Cagr Infographics Pdf
Mentioned slide illustrates the growth of retail sourcing and procurement market in the part of USA along with CAGR. It incorporate the reports study period, retail market area, average compound annual growth rate and key insights. Showcasing this set of slides titled Retail Strategic Sourcing And Procurement Market With Cagr Infographics Pdf. The topics addressed in these templates are Reports Study Period, Retail Market Area, Average Compound0. All the content presented in this PPT design is completely editable. Download it and make adjustments in color, background, font etc. as per your unique business setting. Mentioned slide illustrates the growth of retail sourcing and procurement market in the part of USA along with CAGR. It incorporate the reports study period, retail market area, average compound annual growth rate and key insights.
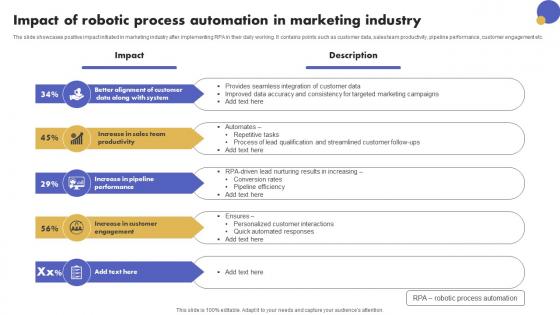
Impact Of Robotic Process Automation In Marketing Industry Graphics Pdf
The slide showcases positive impact initiated in marketing industry after implementing RPA in their daily working. It contains points such as customer data, sales team productivity, pipeline performance, customer engagement etc.Showcasing this set of slides titled Impact Of Robotic Process Automation In Marketing Industry Graphics Pdf The topics addressed in these templates are Provides Seamless, Targeted Marketing Campaigns, Qualification Streamlined All the content presented in this PPT design is completely editable. Download it and make adjustments in color, background, font etc. as per your unique business setting. The slide showcases positive impact initiated in marketing industry after implementing RPA in their daily working. It contains points such as customer data, sales team productivity, pipeline performance, customer engagement etc.
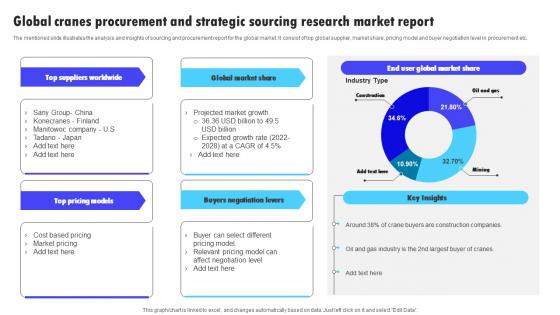
Global Cranes Procurement And Strategic Sourcing Research Market Report Inspiration Pdf
The mentioned slide illustrates the analysis and insights of sourcing and procurement report for the global market. It consist of top global supplier, market share, pricing model and buyer negotiation level in procurement etc. Showcasing this set of slides titled Global Cranes Procurement And Strategic Sourcing Research Market Report Inspiration Pdf. The topics addressed in these templates are Top Global Supplier, Market Share, Pricing Model. All the content presented in this PPT design is completely editable. Download it and make adjustments in color, background, font etc. as per your unique business setting. The mentioned slide illustrates the analysis and insights of sourcing and procurement report for the global market. It consist of top global supplier, market share, pricing model and buyer negotiation level in procurement etc.
New Hires Data Tracker Dashboard Workforce Procurement And Aptitude Evaluation Ppt Presentation
This slide shows dashboard including date related to new hires for recruitment. It include data related to new hires per month, new hires for various departments and by sources, etc. Are you searching for a New Hires Data Tracker Dashboard Workforce Procurement And Aptitude Evaluation Ppt Presentation that is uncluttered, straightforward, and original Its easy to edit, and you can change the colors to suit your personal or business branding. For a presentation that expresses how much effort you have put in, this template is ideal With all of its features, including tables, diagrams, statistics, and lists, its perfect for a business plan presentation. Make your ideas more appealing with these professional slides. Download New Hires Data Tracker Dashboard Workforce Procurement And Aptitude Evaluation Ppt Presentation from Slidegeeks today. This slide shows dashboard including date related to new hires for recruitment. It include data related to new hires per month, new hires for various departments and by sources, etc.
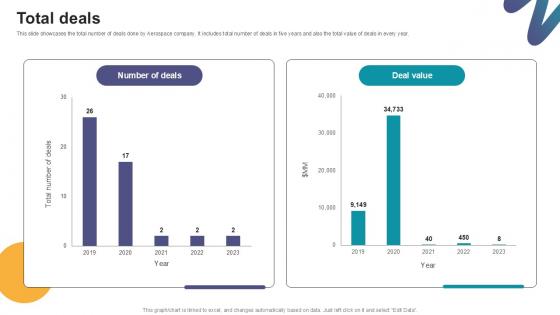
Total Deals Digital Marketings Strategies PPT Template CP SS V
This slide showcases the total number of deals done by Aerospace company. It includes total number of deals in five years and also the total value of deals in every year. From laying roadmaps to briefing everything in detail, our templates are perfect for you. You can set the stage with your presentation slides. All you have to do is download these easy-to-edit and customizable templates. Total Deals Digital Marketings Strategies PPT Template CP SS V will help you deliver an outstanding performance that everyone would remember and praise you for. Do download this presentation today. This slide showcases the total number of deals done by Aerospace company. It includes total number of deals in five years and also the total value of deals in every year.
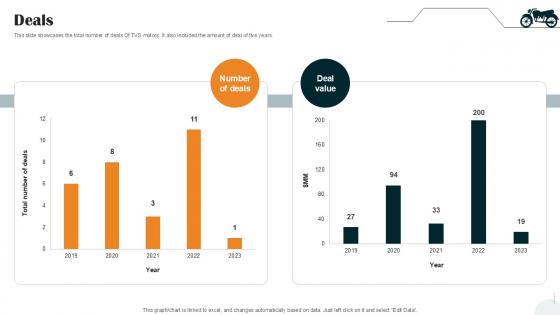
Deals Vehicle Manufacturer Company Profile PPT Example CP SS V
This slide showcases the total number of deals Of TVS motors. It also included the amount of deal of five years. Present like a pro with Deals Vehicle Manufacturer Company Profile PPT Example CP SS V. Create beautiful presentations together with your team, using our easy-to-use presentation slides. Share your ideas in real-time and make changes on the fly by downloading our templates. So whether you are in the office, on the go, or in a remote location, you can stay in sync with your team and present your ideas with confidence. With Slidegeeks presentation got a whole lot easier. Grab these presentations today. This slide showcases the total number of deals Of TVS motors. It also included the amount of deal of five years.
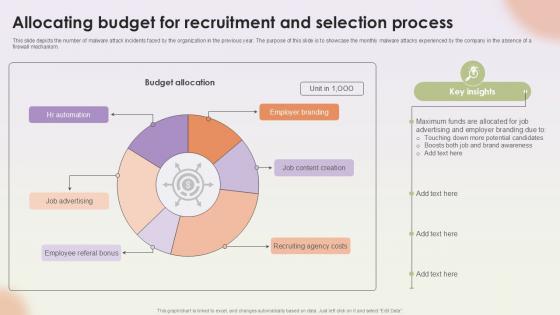
Allocating Budget For Recruitment Workforce Procurement And Aptitude Evaluation Ppt Slides
This slide depicts the number of malware attack incidents faced by the organization in the previous year. The purpose of this slide is to showcase the monthly malware attacks experienced by the company in the absence of a firewall mechanism. Boost your pitch with our creative Allocating Budget For Recruitment Workforce Procurement And Aptitude Evaluation Ppt Slides. Deliver an awe-inspiring pitch that will mesmerize everyone. Using these presentation templates you will surely catch everyones attention. You can browse the ppts collection on our website. We have researchers who are experts at creating the right content for the templates. So you do not have to invest time in any additional work. Just grab the template now and use them. This slide depicts the number of malware attack incidents faced by the organization in the previous year. The purpose of this slide is to showcase the monthly malware attacks experienced by the company in the absence of a firewall mechanism.
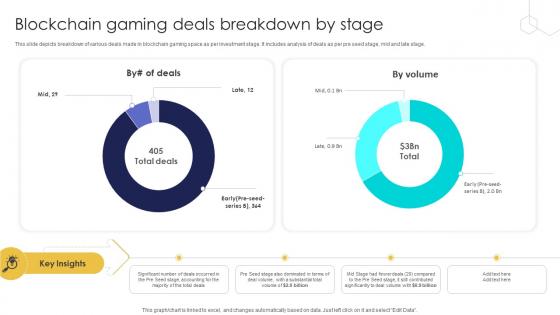
Unlocking The Potential Of Blockchain Gaming Deals Breakdown By Stage BCT SS V
This slide depicts breakdown of various deals made in blockchain gaming space as per investment stage. It includes analysis of deals as per pre seed stage, mid and late stage. Do you have an important presentation coming up Are you looking for something that will make your presentation stand out from the rest Look no further than Unlocking The Potential Of Blockchain Gaming Deals Breakdown By Stage BCT SS V. With our professional designs, you can trust that your presentation will pop and make delivering it a smooth process. And with Slidegeeks, you can trust that your presentation will be unique and memorable. So why wait Grab Unlocking The Potential Of Blockchain Gaming Deals Breakdown By Stage BCT SS V today and make your presentation stand out from the rest This slide depicts breakdown of various deals made in blockchain gaming space as per investment stage. It includes analysis of deals as per pre seed stage, mid and late stage.
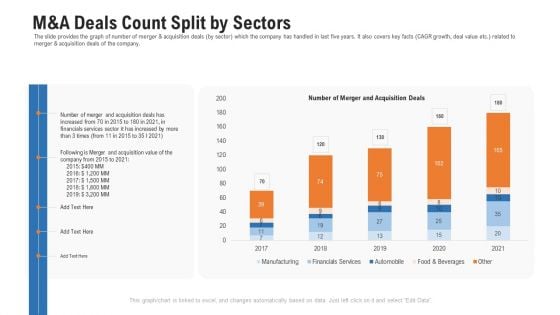
Pitch Deck For Procurement Deal M And A Deals Count Split By Sectors Ppt Styles Ideas PDF
The slide provides the graph of number of merger and acquisition deals by sector which the company has handled in last five years. It also covers key facts CAGR growth, deal value etc. related to merger and acquisition deals of the company. Deliver an awe inspiring pitch with this creative pitch deck for procurement deal M and A deals count split by sectors ppt styles ideas pdf bundle. Topics like financials services, manufacturing, merger and acquisition deals can be discussed with this completely editable template. It is available for immediate download depending on the needs and requirements of the user.
Retail Assortment Dashboard Depicting Store Performance Ppt Icon Structure PDF
This slide shows product assortment dashboard depicting store performance which can benefit managers in reviewing the current situation of outlets and make decisions according to reached benchmarks. It includes details about achieved sales, rate of conversion, weekday vs. Weekend sales, daily trend, etc. Showcasing this set of slides titled Retail Assortment Dashboard Depicting Store Performance Ppt Icon Structure PDF. The topics addressed in these templates are Achieved Sales, Rate Of Conversion, Daily Trend, Outlet Sales. All the content presented in this PPT design is completely editable. Download it and make adjustments in color, background, font etc. as per your unique business setting.


 Continue with Email

 Home
Home


