Sales Icons
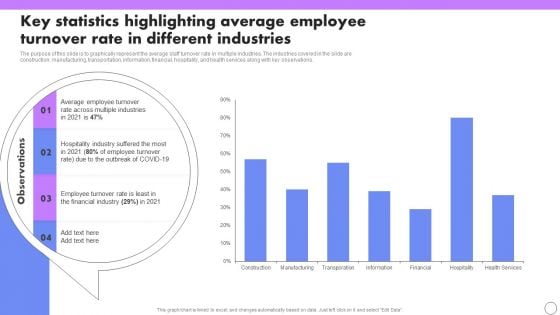
Key Statistics Highlighting Average Employee Turnover Rate In Different Industries Formats PDF
The purpose of this slide is to graphically represent the average staff turnover rate in multiple industries. The industries covered in the slide are construction, manufacturing, transportation, information, financial, hospitality, and health services along with key observations. Want to ace your presentation in front of a live audience Our Key Statistics Highlighting Average Employee Turnover Rate In Different Industries Formats PDF can help you do that by engaging all the users towards you. Slidegeeks experts have put their efforts and expertise into creating these impeccable powerpoint presentations so that you can communicate your ideas clearly. Moreover, all the templates are customizable, and easy-to-edit and downloadable. Use these for both personal and commercial use.
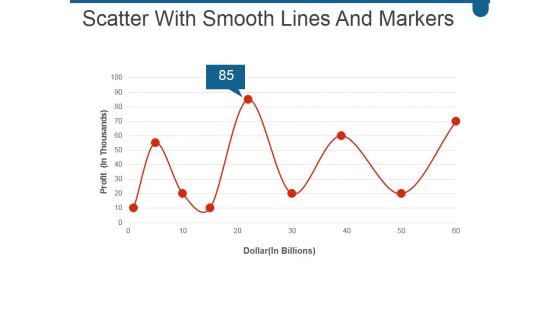
Scatter With Smooth Lines And Markers Ppt PowerPoint Presentation Professional Visual Aids
This is a scatter with smooth lines and markers ppt powerpoint presentation professional visual aids. This is a nine stage process. The stages in this process are business, marketing, success, growth, line.
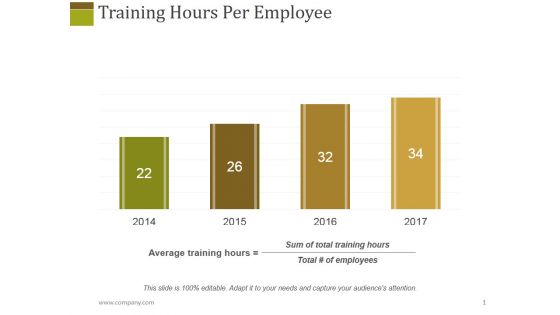
Training Hours Per Employee Ppt PowerPoint Presentation Styles Influencers
This is a training hours per employee ppt powerpoint presentation styles influencers. This is a four stage process. The stages in this process are average training hours, sum of total training hours, year, growth.

Stage Gate Product Life Cycle Ppt PowerPoint Presentation Complete Deck With Slides
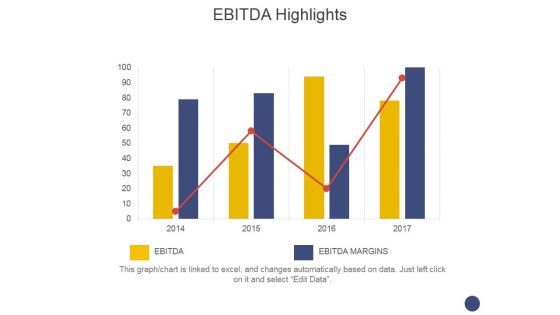
Ebitda Highlights Template 1 Ppt PowerPoint Presentation Gallery Graphics Tutorials
This is a ebitda highlights template 1 ppt powerpoint presentation gallery graphics tutorials. This is a two stage process. The stages in this process are business, growth, finance, graph, management.
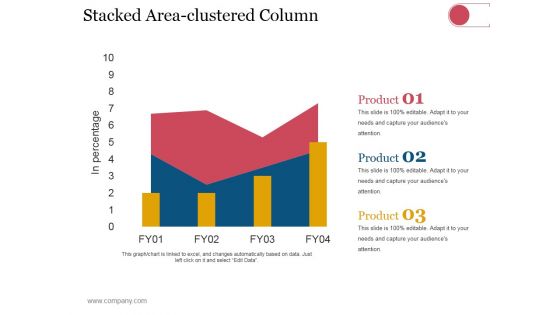
Stacked Area Clustered Column Ppt PowerPoint Presentation Styles Gridlines
This is a stacked area clustered column ppt powerpoint presentation styles gridlines. This is a three stage process. The stages in this process are dollars, in percentage, finance, growth strategy, business, strategy.
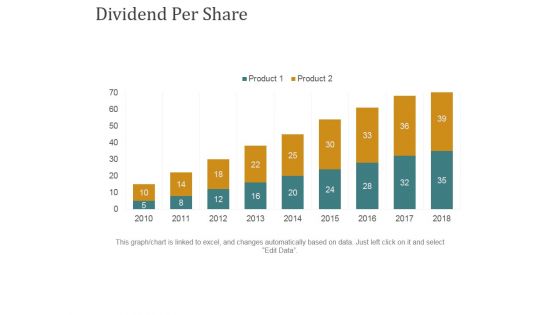
Dividend Per Share Ppt PowerPoint Presentation Summary Rules
This is a dividend per share ppt powerpoint presentation summary rules. This is a nine stage process. The stages in this process are business, bar graph, finance, marketing, strategy, growth.
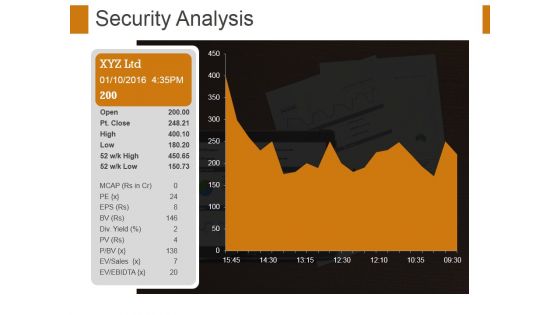
Security Analysis Ppt PowerPoint Presentation File Format Ideas
This is a security analysis ppt powerpoint presentation file format ideas. This is a one stage process. The stages in this process are security analysis, growth, strategy, management, business.
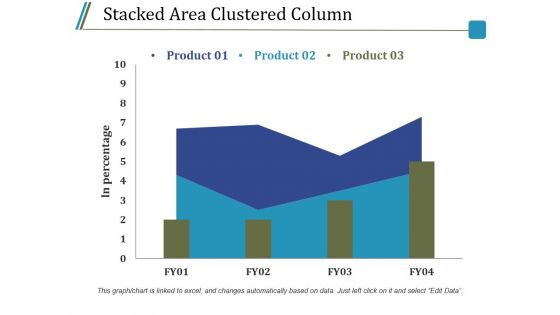
Stacked Area Clustered Column Ppt PowerPoint Presentation Model Guidelines
This is a stacked area clustered column ppt powerpoint presentation model guidelines. This is a three stage process. The stages in this process are product, in percentage, bar graph, growth, success.
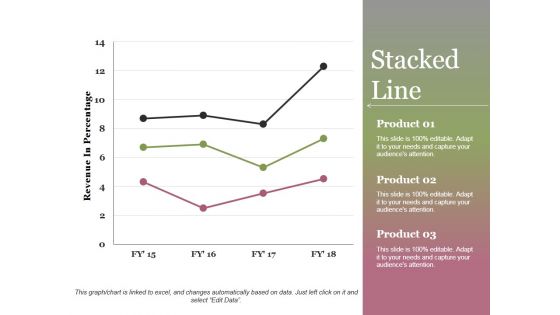
Stacked Line Ppt PowerPoint Presentation Show
This is a stacked line ppt powerpoint presentation show. This is a three stage process. The stages in this process are revenue in percentage, product, stacked line, growth, success.
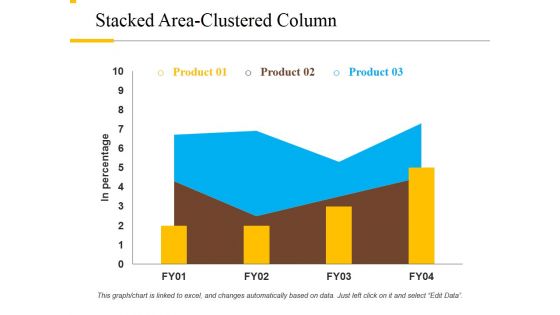
Stacked Area Clustered Column Ppt PowerPoint Presentation File Background Designs
This is a stacked area clustered column ppt powerpoint presentation file background designs. This is a three stage process. The stages in this process are product, in percentage, growth, success, bar graph.
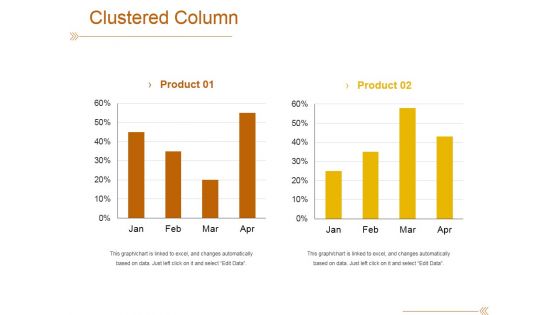
Clustered Column Template 1 Ppt PowerPoint Presentation Outline File Formats
This is a clustered column template 1 ppt powerpoint presentation outline file formats. This is a two stage process. The stages in this process are product, bar graph, success, growth, finance.
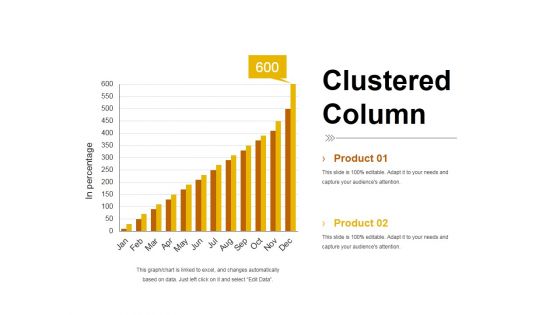
Clustered Column Template 2 Ppt PowerPoint Presentation Summary Smartart
This is a clustered column template 2 ppt powerpoint presentation summary smartart. This is a two stage process. The stages in this process are product, bar graph, in percentage, clustered column, growth.
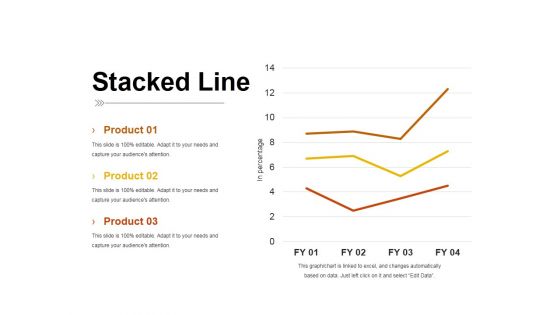
Stacked Line Ppt PowerPoint Presentation Inspiration Pictures
This is a stacked line ppt powerpoint presentation inspiration pictures. This is a three stage process. The stages in this process are product, stacked line, in percentage, business, growth.
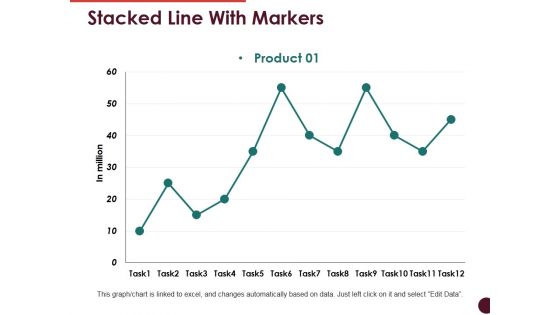
Stacked Line With Markers Ppt PowerPoint Presentation Show Templates
This is a stacked line with markers ppt powerpoint presentation show templates. This is a one stage process. The stages in this process are product, bar graph, growth, success, business.
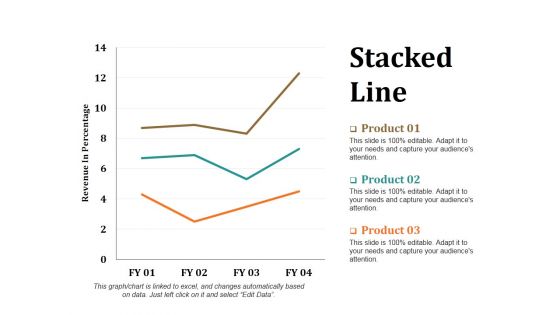
Stacked Line Ppt PowerPoint Presentation Layouts Portrait
This is a stacked line ppt powerpoint presentation layouts portrait. This is a three stage process. The stages in this process are revenue in percentage, stacked line, product, growth, success.
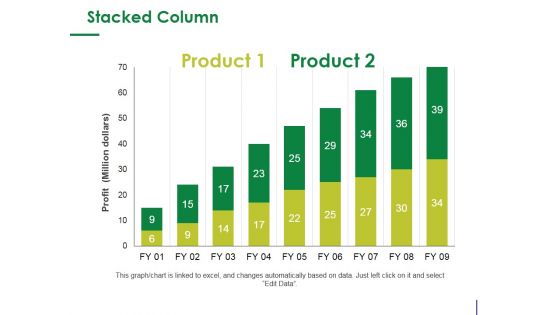
Stacked Column Ppt PowerPoint Presentation Infographic Template Design Ideas
This is a stacked column ppt powerpoint presentation infographic template design ideas. This is a two stage process. The stages in this process are product, profit, bar graph, growth, success.
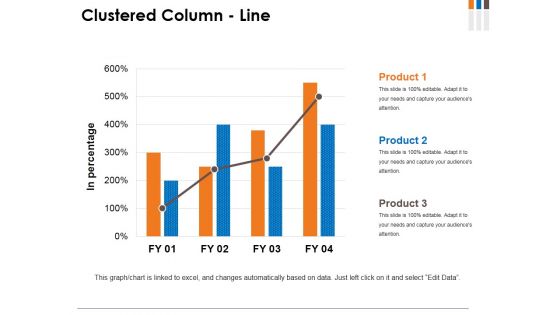
Clustered Column Line Ppt PowerPoint Presentation Summary Background Image
This is a clustered column line ppt powerpoint presentation summary background image. This is a four stage process. The stages in this process are in percentage, product, graph, growth, success.
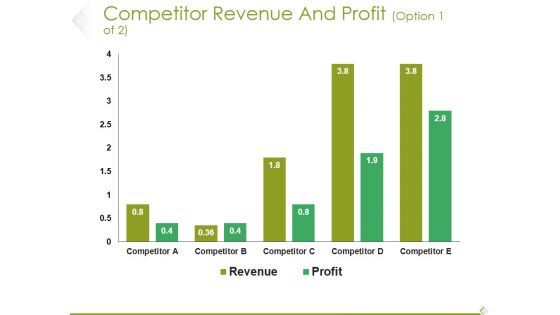
Competitor Revenue And Profit Template 2 Ppt PowerPoint Presentation Infographic Template Format Ideas
This is a competitor revenue and profit template 2 ppt powerpoint presentation infographic template format ideas. This is a five stage process. The stages in this process are competitor, revenue, profit, graph, growth.
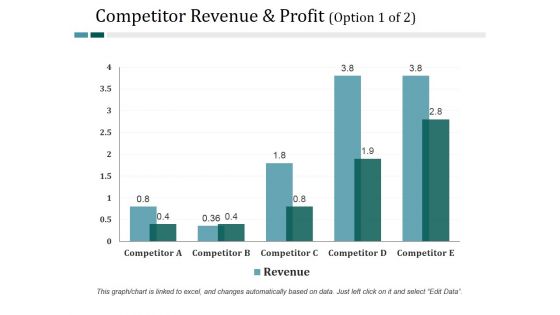
Competitor Revenue And Profit Template 1 Ppt PowerPoint Presentation Professional Example File
This is a competitor revenue and profit template 1 ppt powerpoint presentation professional example file. This is a five stage process. The stages in this process are business, finance, marketing, strategy, analysis, growth.
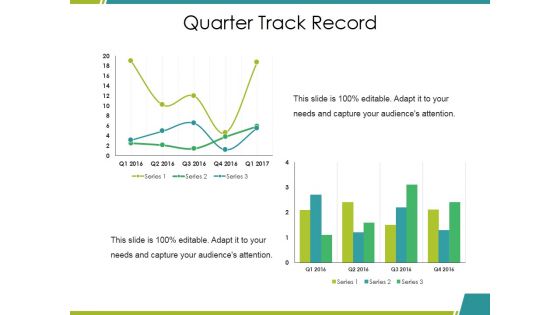
Quarter Track Record Ppt PowerPoint Presentation File Clipart Images
This is a quarter track record ppt powerpoint presentation file clipart images. This is a two stage process. The stages in this process are bar graph, growth, success, business, marketing.
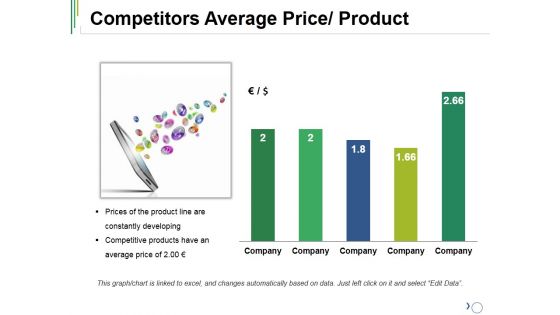
Competitors Average Price Product Ppt PowerPoint Presentation Layouts Infographic Template
This is a competitors average price product ppt powerpoint presentation layouts infographic template. This is a five stage process. The stages in this process are company, bar graph, success, growth, business.
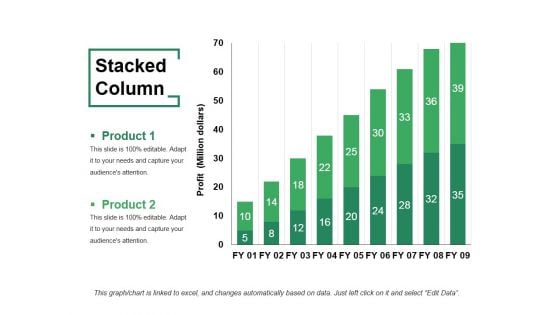
Stacked Column Ppt PowerPoint Presentation Layouts Example
This is a stacked column ppt powerpoint presentation layouts example. This is a two stage process. The stages in this process are product, stacked column, bar graph, growth, success.
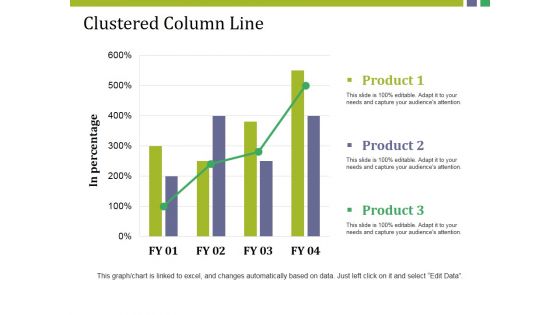
Clustered Column Line Ppt PowerPoint Presentation Pictures Example
This is a clustered column line ppt powerpoint presentation pictures example. This is a three stage process. The stages in this process are product, in percentage, bar graph, growth, success.
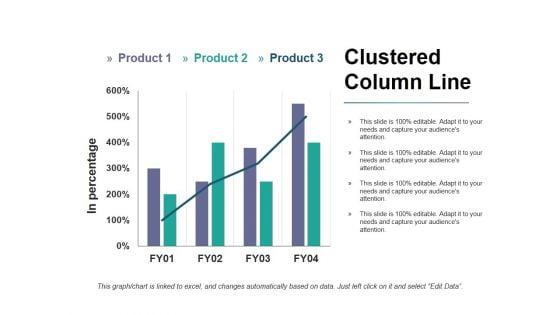
Clustered Column Line Ppt PowerPoint Presentation Infographic Template Pictures
This is a clustered column line ppt powerpoint presentation infographic template pictures. This is a three stage process. The stages in this process are product, in percentage, bar graph, growth, success.
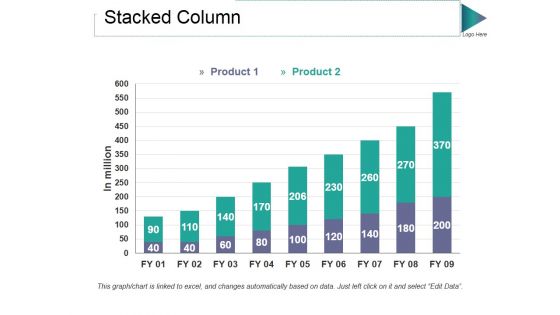
Stacked Column Ppt PowerPoint Presentation Styles Graphic Tips
This is a stacked column ppt powerpoint presentation styles graphic tips. This is a two stage process. The stages in this process are product, in million, bar graph, growth, success.
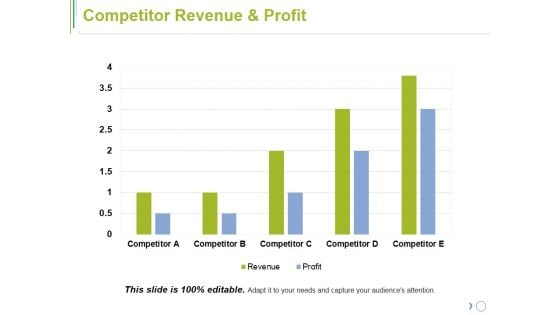
Competitor Revenue And Profit Ppt PowerPoint Presentation Slides Influencers
This is a competitor revenue and profit ppt powerpoint presentation slides influencers. This is a five stage process. The stages in this process are business, marketing, strategy, planning, growth.
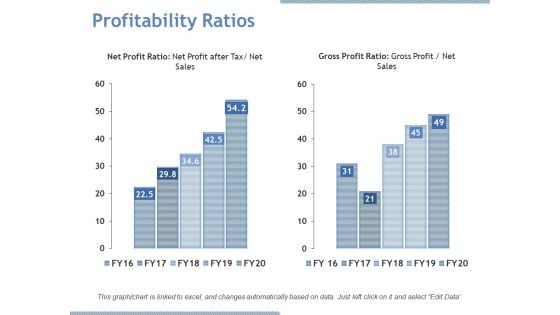
Profitability Ratios Ppt PowerPoint Presentation File Portrait
This is a profitability ratios ppt powerpoint presentation file portrait. This is a two stage process. The stages in this process are net profit ratio, gross profit ratio, growth.
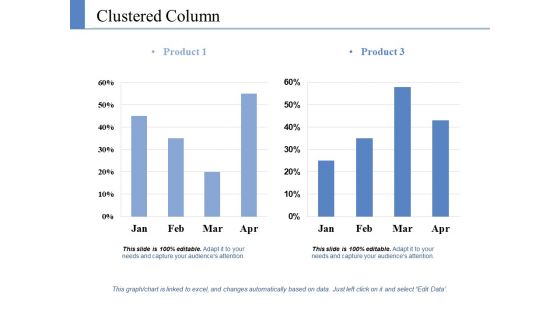
Clustered Column Ppt PowerPoint Presentation Pictures Graphics Template
This is a clustered column ppt powerpoint presentation pictures graphics template. This is a two stage process. The stages in this process are product, growth, success, business, bar graph.
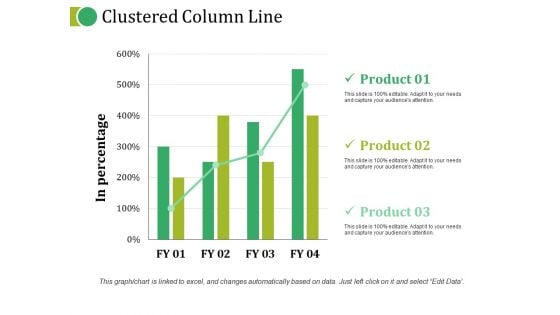
Clustered Column Line Ppt PowerPoint Presentation Topics
This is a clustered column line ppt powerpoint presentation topics. This is a three stage process. The stages in this process are product, in percentage, growth, bar graph, business.
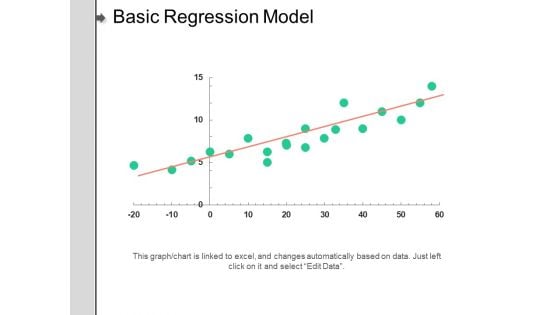
Basic Regression Model Ppt PowerPoint Presentation Pictures Layout Ideas
This is a basic regression model ppt powerpoint presentation pictures layout ideas. This is a one stage process. The stages in this process are linear periodization, linear growth, linear progression.
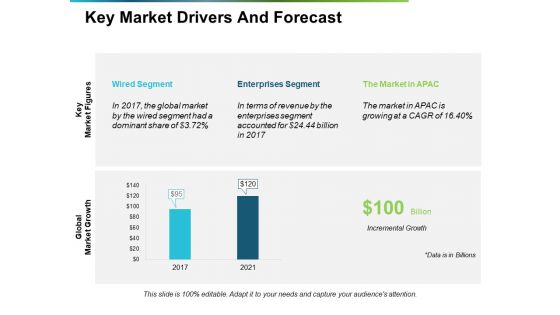
Key Market Drivers And Forecast Ppt PowerPoint Presentation Summary Templates
This is a key market drivers and forecast ppt powerpoint presentation summary templates. This is a two stage process. The stages in this process are key market drivers, forecast, growth, bar graph, business.
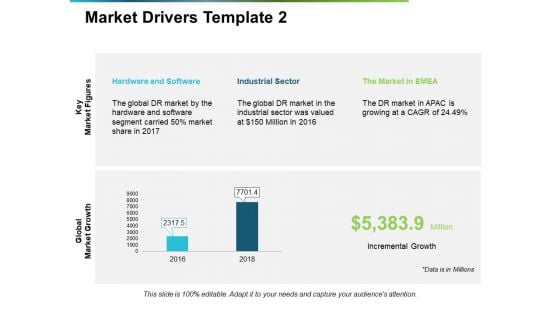
Market Drivers Hardware And Software Ppt PowerPoint Presentation Inspiration Graphics Design
This is a market drivers hardware and software ppt powerpoint presentation inspiration graphics design. This is a two stage process. The stages in this process are key market drivers, forecast, growth, bar graph, business.
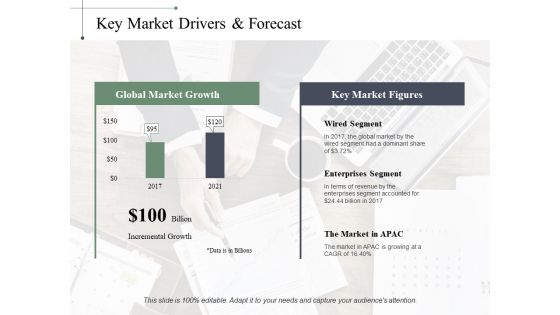
Key Market Drivers Forecast Ppt PowerPoint Presentation Inspiration Graphic Tips
This is a key market drivers forecast ppt powerpoint presentation inspiration graphic tips. This is a two stage process. The stages in this process are wired segment, enterprises segment, incremental growth, business, management.
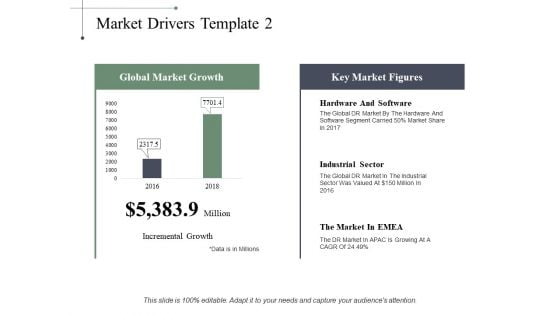
Market Drivers Industrial Sector Ppt PowerPoint Presentation File Microsoft
This is a market drivers industrial sector ppt powerpoint presentation file microsoft. This is a two stage process. The stages in this process are industrial sector, incremental growth, marketing, management, strategy.
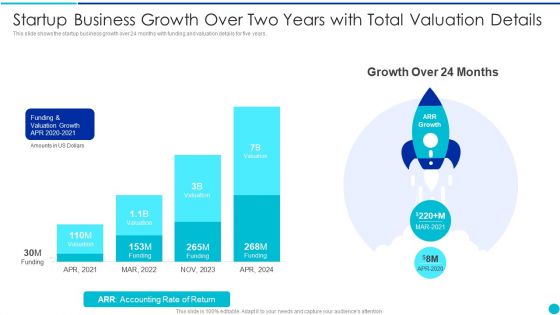
Valuing A Pre Revenue Startup Business Startup Business Growth Over Two Years With Total Valuation Details Summary PDF
This slide shows the startup business growth over 24 months with funding and valuation details for five years. Deliver an awe inspiring pitch with this creative valuing a pre revenue startup business startup business growth over two years with total valuation details summary pdf bundle. Topics like startup business growth over two years with total valuation details can be discussed with this completely editable template. It is available for immediate download depending on the needs and requirements of the user.

Introduction To Pharmaceutical Marketing Accelerating Market Share And Profitability MKT SS V
This slide showcases the introduction to pharmaceutical marketing. It includes role of marketing in pharma industry such as identifying target market, building implementing marketing campaigns and keep always updated with industry trends and development. Explore a selection of the finest Introduction To Pharmaceutical Marketing Accelerating Market Share And Profitability MKT SS V here. With a plethora of professionally designed and pre-made slide templates, you can quickly and easily find the right one for your upcoming presentation. You can use our Introduction To Pharmaceutical Marketing Accelerating Market Share And Profitability MKT SS V to effectively convey your message to a wider audience. Slidegeeks has done a lot of research before preparing these presentation templates. The content can be personalized and the slides are highly editable. Grab templates today from Slidegeeks. This slide showcases the introduction to pharmaceutical marketing. It includes role of marketing in pharma industry such as identifying target market, building implementing marketing campaigns and keep always updated with industry trends and development.
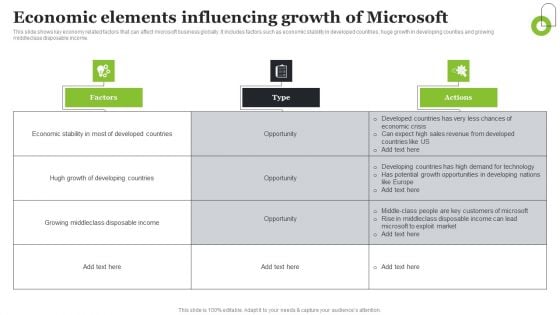
Microsoft Strategic Plan To Become Market Leader Economic Elements Influencing Growth Of Microsoft Infographics PDF
This slide shows key economy related factors that can affect microsoft business globally. It includes factors such as economic stability in developed countries, huge growth in developing counties and growing middleclass disposable income. This Microsoft Strategic Plan To Become Market Leader Economic Elements Influencing Growth Of Microsoft Infographics PDF from Slidegeeks makes it easy to present information on your topic with precision. It provides customization options, so you can make changes to the colors, design, graphics, or any other component to create a unique layout. It is also available for immediate download, so you can begin using it right away. Slidegeeks has done good research to ensure that you have everything you need to make your presentation stand out. Make a name out there for a brilliant performance.
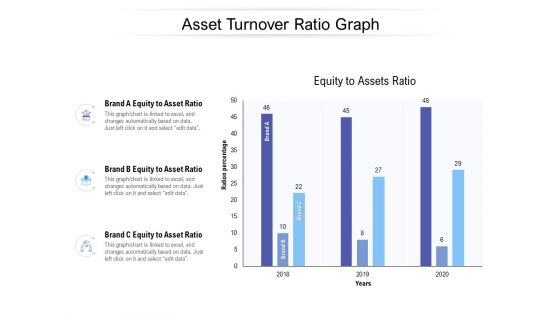
Asset Turnover Ratio Graph Ppt PowerPoint Presentation Outline Graphics Template PDF
Presenting this set of slides with name asset turnover ratio graph ppt powerpoint presentation outline graphics template pdf. The topics discussed in these slides are brand a equity to asset ratio, brand b equity to asset ratio, brand c equity to asset ratio. This is a completely editable PowerPoint presentation and is available for immediate download. Download now and impress your audience.
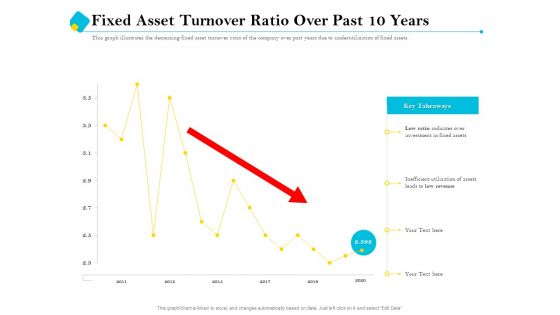
Assessment Of Fixed Assets Fixed Asset Turnover Ratio Over Past 10 Years Formats PDF
Presenting this set of slides with name assessment of fixed assets fixed asset turnover ratio over past 10 years formats pdf. The topics discussed in these slides are inefficient, utilization, assets, revenue. This is a completely editable PowerPoint presentation and is available for immediate download. Download now and impress your audience.
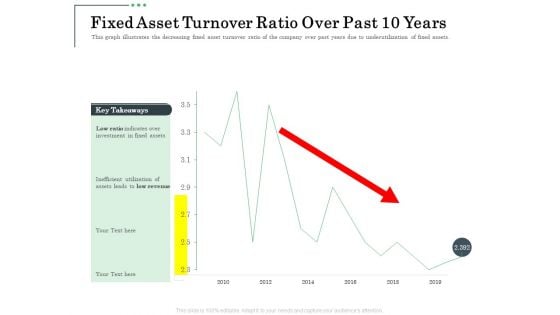
Non Current Assets Reassessment Fixed Asset Turnover Ratio Over Past 10 Years Elements PDF
Presenting this set of slides with name non current assets reassessment fixed asset turnover ratio over past 10 years elements pdf. The topics discussed in these slides are inefficient, utilization, assets, revenue. This is a completely editable PowerPoint presentation and is available for immediate download. Download now and impress your audience.
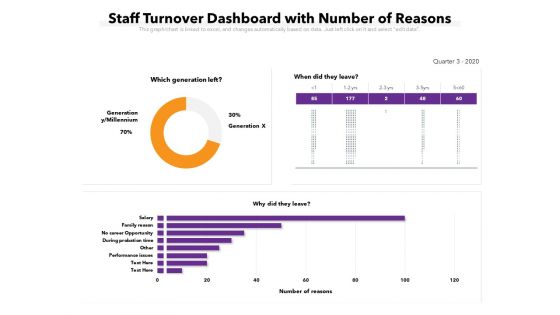
Staff Turnover Dashboard With Number Of Reasons Ppt PowerPoint Presentation Ideas Graphics Download PDF
Presenting this set of slides with name staff turnover dashboard with number of reasons ppt powerpoint presentation ideas graphics download pdf. The topics discussed in these slides are performance issues, other, during probation time, no career opportunity, family reason, salary. This is a completely editable PowerPoint presentation and is available for immediate download. Download now and impress your audience.
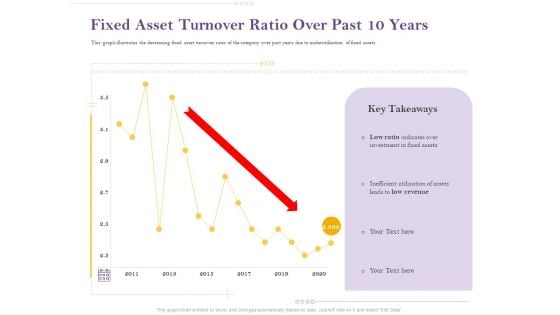
Capital Consumption Adjustment Fixed Asset Turnover Ratio Over Past 10 Years Graphics PDF
Presenting this set of slides with name capital consumption adjustment fixed asset turnover ratio over past 10 years graphics pdf. The topics discussed in these slides are inefficient, utilization, assets, revenue. This is a completely editable PowerPoint presentation and is available for immediate download. Download now and impress your audience.
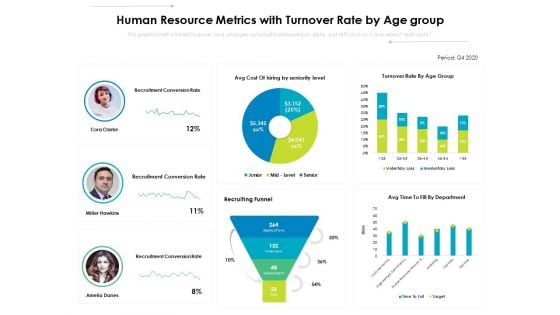
Human Resource Metrics With Turnover Rate By Age Group Ppt PowerPoint Presentation Inspiration Sample PDF
Presenting this set of slides with name human resource metrics with turnover rate by age group ppt powerpoint presentation inspiration sample pdf. The topics discussed in these slides are recruitment conversion rate, recruiting funnel, assessment, application, interview, hires. This is a completely editable PowerPoint presentation and is available for immediate download. Download now and impress your audience.
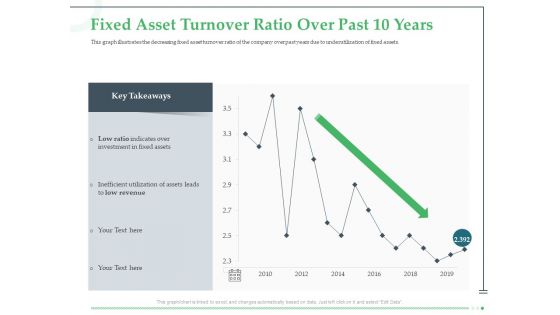
Funds Requisite Evaluation Fixed Asset Turnover Ratio Over Past 10 Years Sample PDF
Presenting this set of slides with name funds requisite evaluation fixed asset turnover ratio over past 10 years sample pdf. The topics discussed in these slides are inefficient, utilization, assets, revenue. This is a completely editable PowerPoint presentation and is available for immediate download. Download now and impress your audience.
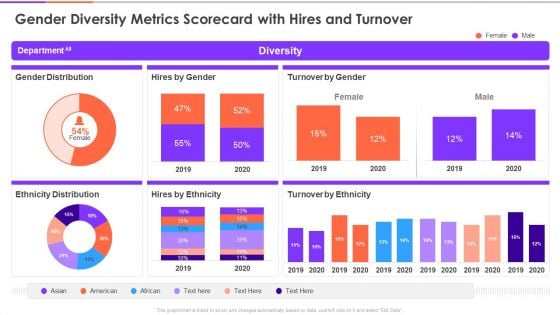
Enterprise Diversity Metrics And Scorecard Gender Diversity Metrics Scorecard With Hires And Turnover Infographics PDF
Deliver and pitch your topic in the best possible manner with this enterprise diversity metrics and scorecard gender diversity metrics scorecard with hires and turnover infographics pdf. Use them to share invaluable insights on gender distribution, ethnicity distribution, hires by ethnicity and impress your audience. This template can be altered and modified as per your expectations. So, grab it now.
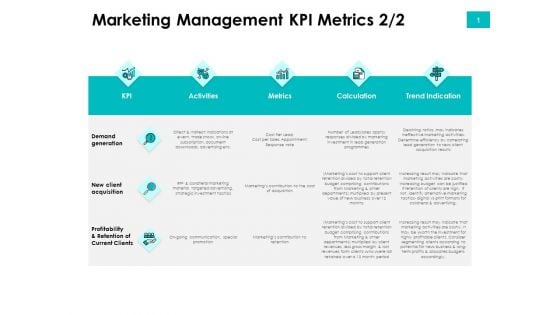
Effectivity Associated To Target Market Marketing Management Kpi Metrics Metrics Ppt Inspiration Rules PDF
Deliver an awe inspiring pitch with this creative effectivity associated to target market marketing management kpi metrics metrics ppt inspiration rules pdf bundle. Topics like communication, marketing, trend indication, calculation, metrics can be discussed with this completely editable template. It is available for immediate download depending on the needs and requirements of the user.
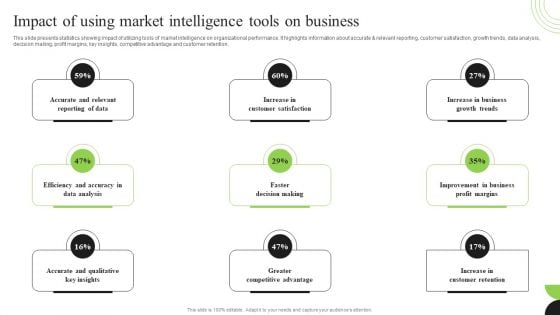
Guidebook For Executing Business Market Intelligence Impact Of Using Market Intelligence Formats PDF
This slide presents statistics showing impact of utilizing tools of market intelligence on organizational performance. It highlights information about accurate and relevant reporting, customer satisfaction, growth trends, data analysis, decision making, profit margins, key insights, competitive advantage and customer retention. This Guidebook For Executing Business Market Intelligence Impact Of Using Market Intelligence Formats PDF is perfect for any presentation, be it in front of clients or colleagues. It is a versatile and stylish solution for organizing your meetings. The product features a modern design for your presentation meetings. The adjustable and customizable slides provide unlimited possibilities for acing up your presentation. Slidegeeks has done all the homework before launching the product for you. So, do not wait, grab the presentation templates today
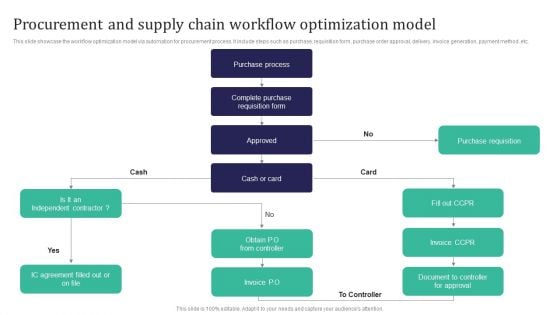
Integration Automation Procurement And Supply Chain Workflow Optimization Model Microsoft PDF
This slide showcase the workflow optimization model via automation for procurement process. It include steps such as purchase, requisition form, purchase order approval, delivery, invoice generation, payment method ,etc. Welcome to our selection of the Integration Automation Procurement And Supply Chain Workflow Optimization Model Microsoft PDF. These are designed to help you showcase your creativity and bring your sphere to life. Planning and Innovation are essential for any business that is just starting out. This collection contains the designs that you need for your everyday presentations. All of our PowerPoints are 100 percent editable, so you can customize them to suit your needs. This multi-purpose template can be used in various situations. Grab these presentation templates today.
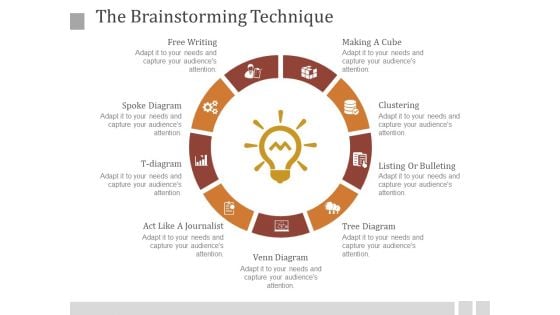
The Brainstorming Technique Ppt PowerPoint Presentation Images
This is a the brainstorming technique ppt powerpoint presentation images. This is a nine stage process. The stages in this process are free writing, spoke diagram, t diagram, act like a journalist, venn diagram, tree diagram, listing or bulletin, clustering, making a cube.
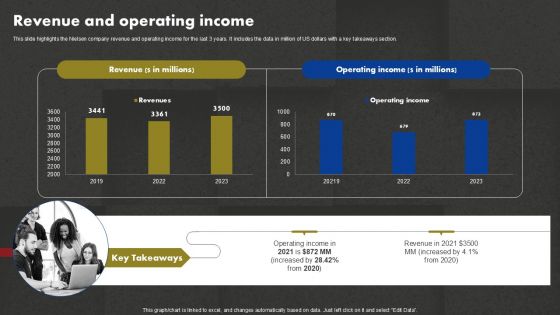
Data And Customer Analysis Company Outline Revenue And Operating Income Diagrams PDF
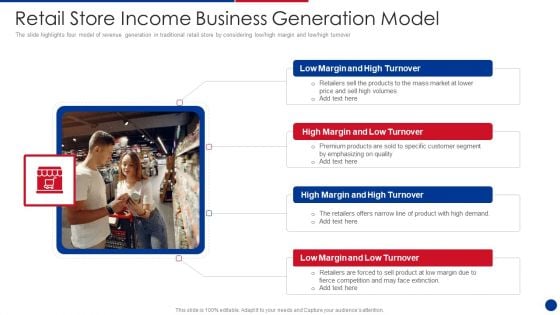
Retail Store Income Business Generation Model Infographics PDF
The slide highlights four model of revenue generation in traditional retail store by considering low high margin and low high turnover Presenting Retail Store Income Business Generation Model Infographics PDF to dispense important information. This template comprises four stages. It also presents valuable insights into the topics including Market, Customer, Margin. This is a completely customizable PowerPoint theme that can be put to use immediately. So, download it and address the topic impactfully
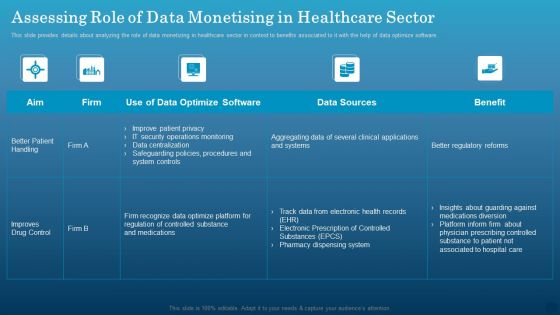
Data Monetization Approach To Drive Business Growth Assessing Role Of Data Monetising In Healthcare Sector Diagrams PDF
This slide provides details about analyzing the role of data monetizing in healthcare sector in context to benefits associated to it with the help of data optimize software. Do you know about Slidesgeeks Data Monetization Approach To Drive Business Growth Assessing Role Of Data Monetising In Healthcare Sector Diagrams PDF These are perfect for delivering any kind od presentation. Using it, create PowerPoint presentations that communicate your ideas and engage audiences. Save time and effort by using our pre designed presentation templates that are perfect for a wide range of topic. Our vast selection of designs covers a range of styles, from creative to business, and are all highly customizable and easy to edit. Download as a PowerPoint template or use them as Google Slides themes.
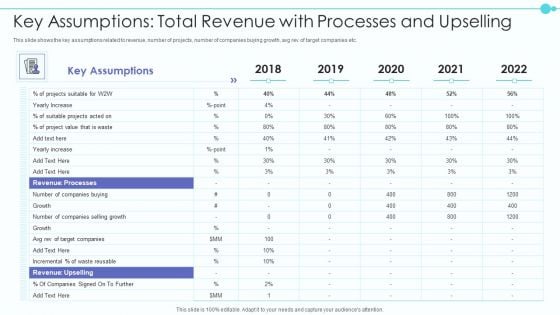
Business Model Of New Consultancy Firm Key Assumptions Total Revenue Sample PDF
This slide shows the key assumptions related to revenue, number of projects, number of companies buying growth, avg rev of target companies etc. Deliver and pitch your topic in the best possible manner with this business model of new consultancy firm key assumptions total revenue sample pdf. Use them to share invaluable insights on revenue processes, revenue upselling, key assumptions and impress your audience. This template can be altered and modified as per your expectations. So, grab it now.

Direct Marketing Techniques To Enhance Business Presence Table Of Contents Diagrams PDF
The Direct Marketing Techniques To Enhance Business Presence Table Of Contents Diagrams PDF is a compilation of the most recent design trends as a series of slides. It is suitable for any subject or industry presentation, containing attractive visuals and photo spots for businesses to clearly express their messages. This template contains a variety of slides for the user to input data, such as structures to contrast two elements, bullet points, and slides for written information. Slidegeeks is prepared to create an impression.
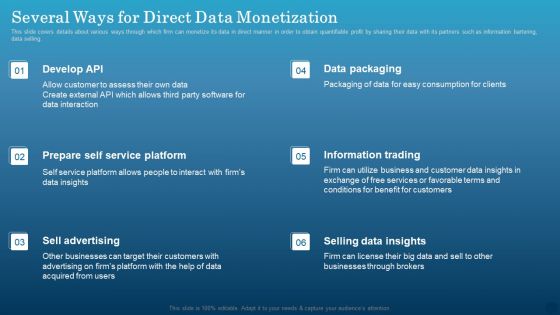
Data Monetization Approach To Drive Business Growth Several Ways For Direct Data Monetization Pictures PDF
This slide covers details about various ways through which firm can monetize its data in direct manner in order to obtain quantifiable profit by sharing their data with its partners such as information bartering, data selling. Explore a selection of the finest Data Monetization Approach To Drive Business Growth Several Ways For Direct Data Monetization Pictures PDF here. With a plethora of professionally designed and pre made slide templates, you can quickly and easily find the right one for your upcoming presentation. You can use our Data Monetization Approach To Drive Business Growth Several Ways For Direct Data Monetization Pictures PDF to effectively convey your message to a wider audience. Slidegeeks has done a lot of research before preparing these presentation templates. The content can be personalized and the slides are highly editable. Grab templates today from Slidegeeks.
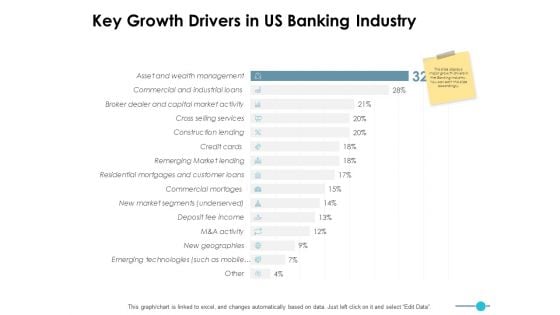
Key Growth Drivers In Us Banking Industry Ppt PowerPoint Presentation Pictures Outline
This is a key growth drivers in us banking industry ppt powerpoint presentation pictures outline. The topics discussed in this diagram are marketing, business, management, planning, strategy This is a completely editable PowerPoint presentation, and is available for immediate download.
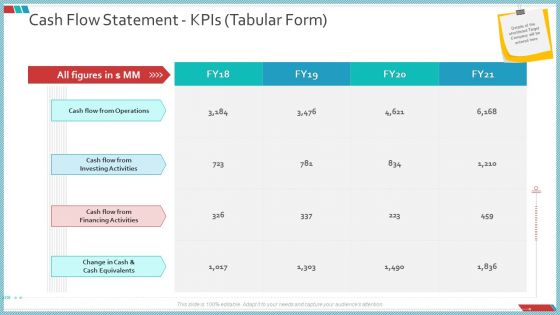
Enterprise Action Plan For Growth Cash Flow Statement Kpis Tabular Form Topics PDF
This is a enterprise action plan for growth business due diligence process diagrams pdf template with various stages. Focus and dispense information on five stages using this creative set, that comes with editable features. It contains large content boxes
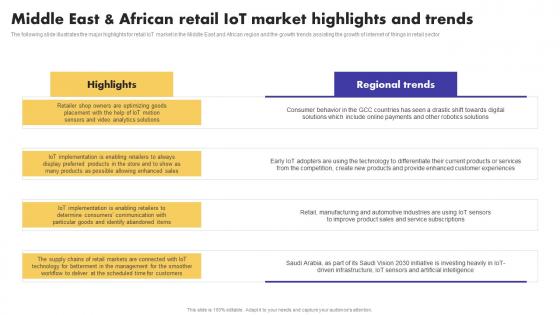
IoT Application In Global Middle East And African Retail IoT Market Highlights Infographics Pdf
The following slide illustrates the major highlights for retail IoT market in the Middle East and African region and the growth trends assisting the growth of internet of things in retail sector. Formulating a presentation can take up a lot of effort and time, so the content and message should always be the primary focus. The visuals of the PowerPoint can enhance the presenters message, so our IoT Application In Global Middle East And African Retail IoT Market Highlights Infographics Pdf was created to help save time. Instead of worrying about the design, the presenter can concentrate on the message while our designers work on creating the ideal templates for whatever situation is needed. Slidegeeks has experts for everything from amazing designs to valuable content, we have put everything into IoT Application In Global Middle East And African Retail IoT Market Highlights Infographics Pdf The following slide illustrates the major highlights for retail IoT market in the Middle East and African region and the growth trends assisting the growth of internet of things in retail sector
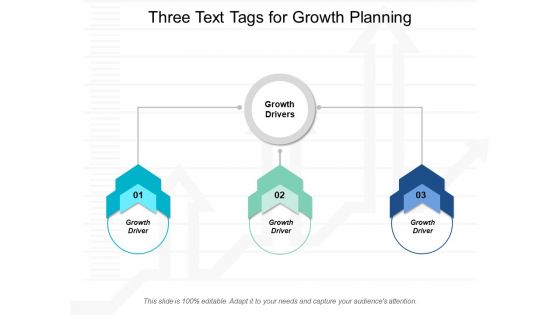
Three Text Tags For Growth Planning Ppt Powerpoint Presentation Styles Show
This is a three text tags for growth planning ppt powerpoint presentation styles show. This is a three stage process. The stages in this process are growth opportunity, growth drivers, market drivers.


 Continue with Email

 Home
Home


