Sales Kpi
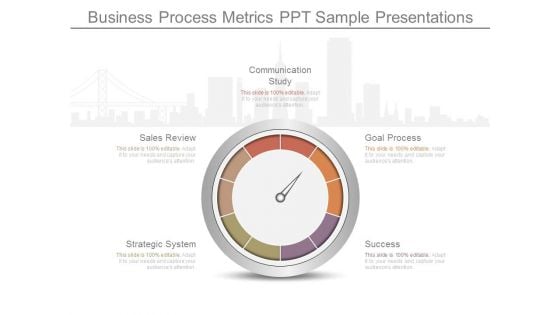
Business Process Metrics Ppt Sample Presentations
This is a business process metrics ppt sample presentations. This is a five stage process. The stages in this process are communication study, goal process, success, strategic system, sales review.
Implementing Change Management Strategy To Transform Business Processes Dashboard Depicting Kpis To Track Icons PDF
This slide covers the dashboard that depicts metrics to track company sales performance that focuses on number of sales, cost breakdown, accumulated revenues, incremental sales, etc. Boost your pitch with our creative Implementing Change Management Strategy To Transform Business Processes Dashboard Depicting Kpis To Track Icons PDF. Deliver an awe-inspiring pitch that will mesmerize everyone. Using these presentation templates you will surely catch everyones attention. You can browse the ppts collection on our website. We have researchers who are experts at creating the right content for the templates. So you do not have to invest time in any additional work. Just grab the template now and use them.
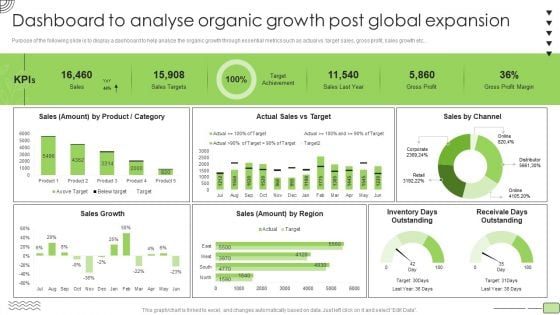
Organic Business Growth Strategies Dashboard To Analyse Organic Growth Post Global Expansion Background PDF
Purpose of the following slide is to display a dashboard to help analyze the organic growth through essential metrics such as actual vs. target sales, gross profit, sales growth etc. Deliver and pitch your topic in the best possible manner with this Organic Business Growth Strategies Dashboard To Analyse Organic Growth Post Global Expansion Background PDF. Use them to share invaluable insights on Sales, Product, Target and impress your audience. This template can be altered and modified as per your expectations. So, grab it now.
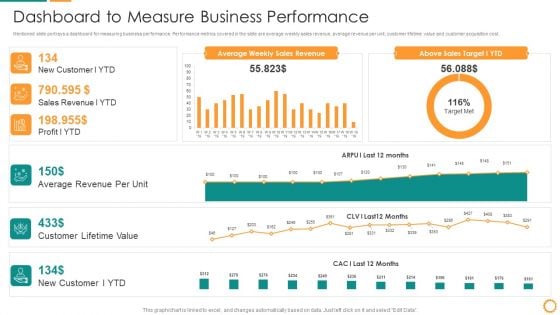
IT Consolidation Post Mergers And Acquisition Dashboard To Measure Business Performance Clipart PDF
Mentioned slide portrays a dashboard for measuring business performance. Performance metrics covered in the slide are average weekly sales revenue, average revenue per unit, customer lifetime value and customer acquisition cost. Deliver and pitch your topic in the best possible manner with this IT Consolidation Post Mergers And Acquisition Dashboard To Measure Business Performance Clipart PDF. Use them to share invaluable insights on Average Revenue, Customer Lifetime Value, Sales Revenue, Sales Target and impress your audience. This template can be altered and modified as per your expectations. So, grab it now.
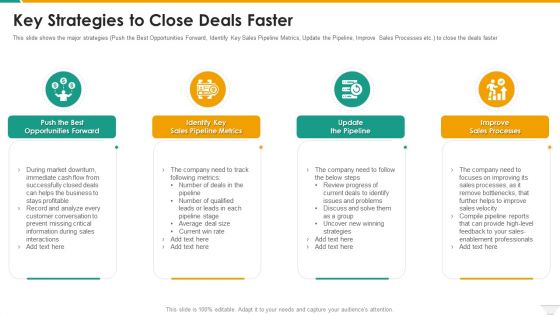
Key Strategies To Close Deals Faster Diagrams PDF
This slide shows the major strategies Push the Best Opportunities Forward, Identify Key Sales Pipeline Metrics, Update the Pipeline, Improve Sales Processes etc. to close the deals faster This is a Key Strategies To Close Deals Faster Diagrams PDF template with various stages. Focus and dispense information on four stages using this creative set, that comes with editable features. It contains large content boxes to add your information on topics like Opportunities, Sales, Metrics, Average. You can also showcase facts, figures, and other relevant content using this PPT layout. Grab it now.
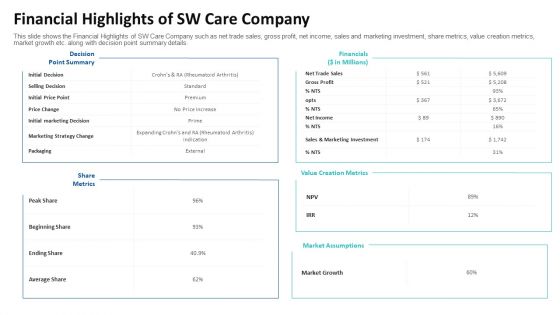
Financial Highlights Of SW Care Company Ppt File Template PDF
This slide shows the Financial Highlights of SW Care Company such as net trade sales, gross profit, net income, sales and marketing investment, share metrics, value creation metrics, market growth etc. along with decision point summary details. Deliver an awe inspiring pitch with this creative financial highlights of sw care company ppt file template pdf bundle. Topics like gross profit, investment, sales, price can be discussed with this completely editable template. It is available for immediate download depending on the needs and requirements of the user.
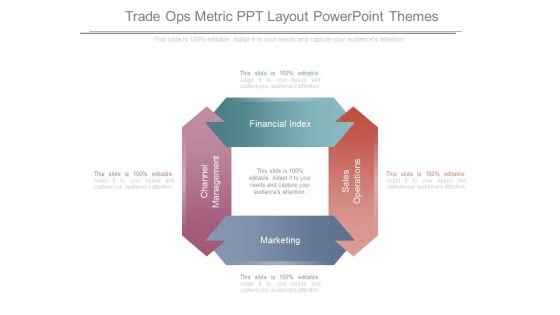
Trade Ops Metric Ppt Layout Powerpoint Themes
This is a trade ops metric ppt layout powerpoint themes. This is a four stage process. The stages in this process are channel management, marketing, sales operations, financial index.
Dashboard For Tracking Referral Implementing Social Media Tactics For Boosting WOM Icons Pdf
This slide covers the KPI dashboard for brands to evaluate the performance of referral marketing campaigns. It includes metrics such as referral participation rate, referred customers, referral conversion rate, total revenue generated, etc.Do you have an important presentation coming up Are you looking for something that will make your presentation stand out from the rest Look no further than Dashboard For Tracking Referral Implementing Social Media Tactics For Boosting WOM Icons Pdf. With our professional designs, you can trust that your presentation will pop and make delivering it a smooth process. And with Slidegeeks, you can trust that your presentation will be unique and memorable. So why wait Grab Dashboard For Tracking Referral Implementing Social Media Tactics For Boosting WOM Icons Pdf today and make your presentation stand out from the rest This slide covers the KPI dashboard for brands to evaluate the performance of referral marketing campaigns. It includes metrics such as referral participation rate, referred customers, referral conversion rate, total revenue generated, etc.
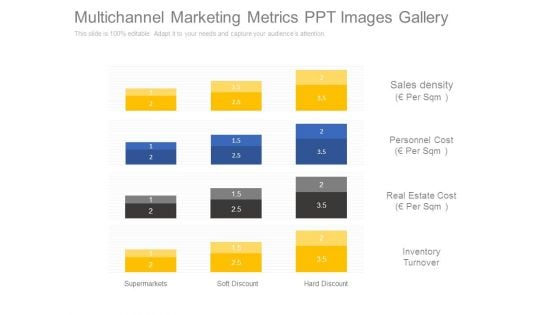
Multichannel Marketing Metrics Ppt Images Gallery
This is a multichannel marketing metrics ppt images gallery. This is a four stage process. The stages in this process are sales density, personnel cost, real estate cost, inventory turnover, supermarkets, soft discount, hard discount.
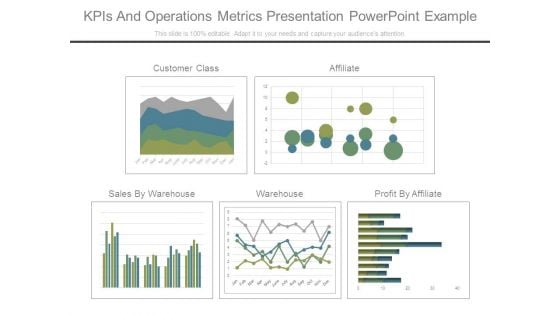
Kpis And Operations Metrics Presentation Powerpoint Example
This is a kpis and operations metrics presentation powerpoint example. This is a five stage process. The stages in this process are customer class, affiliate, sales by warehouse, warehouse, profit by affiliate.
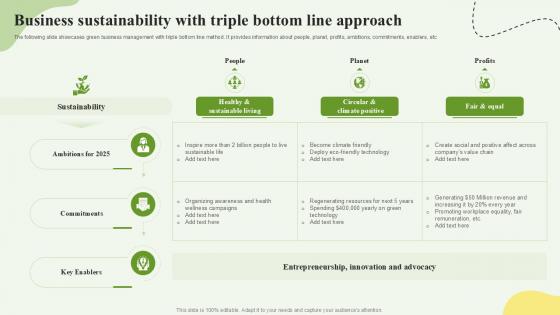
Business Sustainability With Triple Bottom Line Approach Ppt Example SS
This slide mentions the KPI dashboard for pharmaceutical companies. The purpose of this slide is analysis the 6 months gross selling of the company that can be utilized by the managers to determine actual revenue and profits. It includes details regarding discounts, unit sold per segment, profit by product, monthly revenue, etc. Get a simple yet stunning designed Business Sustainability With Triple Bottom Line Approach Ppt Example SS It is the best one to establish the tone in your meetings. It is an excellent way to make your presentations highly effective. So, download this PPT today from Slidegeeks and see the positive impacts. Our easy-to-edit Business Sustainability With Triple Bottom Line Approach Ppt Example SS can be your go-to option for all upcoming conferences and meetings. So, what are you waiting for Grab this template today. This slide mentions the KPI dashboard for pharmaceutical companies. The purpose of this slide is analysis the 6 months gross selling of the company that can be utilized by the managers to determine actual revenue and profits. It includes details regarding discounts, unit sold per segment, profit by product, monthly revenue, etc.

Brand Promotion Communication Strategy Dashboard For Analyzing Brand Perception Introduction PDF
This slide covers the dashboard for tracking brand reputation. It also includes metrics such as new customer lifetime value, customer acquisition cost, target met, above sales target, average weekly sales revenue, etc. Deliver an awe inspiring pitch with this creative Brand Promotion Communication Strategy Dashboard For Analyzing Brand Perception Introduction PDF bundle. Topics like New customer YTD, Sales revenue YTD, Profit YTD can be discussed with this completely editable template. It is available for immediate download depending on the needs and requirements of the user.
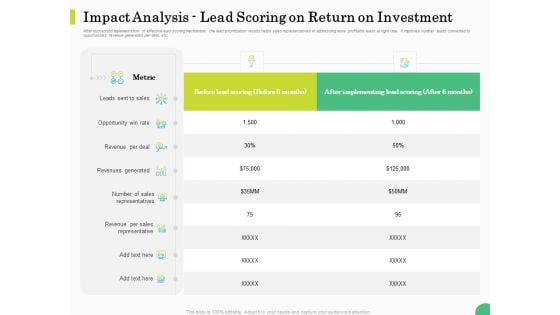
Evaluating Rank Prospects Impact Analysis Lead Scoring On Return On Investment Ppt Professional Skills PDF
After successful implementation of effective lead scoring mechanism, the lead prioritization results helps sales representatives in addressing more profitable leads at right time. It improves number leads converted to opportunities revenue generated per deal, etc. Deliver an awe-inspiring pitch with this creative evaluating rank prospects impact analysis lead scoring on return on investment ppt professional skills pdf bundle. Topics like metric, leads sent to sales, opportunity win rate, revenue per deal, revenues generated, revenue per sales representative can be discussed with this completely editable template. It is available for immediate download depending on the needs and requirements of the user.
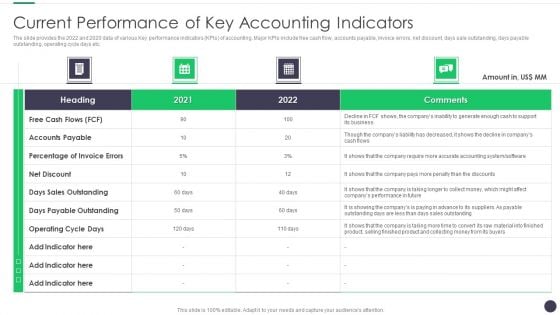
Finance And Accounting Online Conversion Plan Current Performance Of Key Accounting Indicators Template PDF
The slide provides the 2022 and 2020 data of various Key performance indicators KPIs of accounting. Major KPIs include free cash flow, accounts payable, invoice errors, net discount, days sale outstanding, days payable outstanding, operating cycle days etc. Deliver and pitch your topic in the best possible manner with this Finance And Accounting Online Conversion Plan Current Performance Of Key Accounting Indicators Template PDF. Use them to share invaluable insights on Sales Outstanding, Payable Outstanding, Accounts Payable and impress your audience. This template can be altered and modified as per your expectations. So, grab it now.
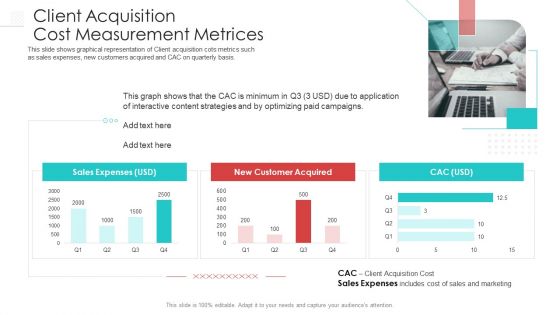
Client Acquisition Cost Measurement Metrices Guidelines PDF
This slide shows graphical representation of Client acquisition cots metrics such as sales expenses, new customers acquired and CAC on quarterly basis. Deliver an awe inspiring pitch with this creative client acquisition cost measurement metrices guidelines pdf bundle. Topics like sales expenses, new customer acquired can be discussed with this completely editable template. It is available for immediate download depending on the needs and requirements of the user.
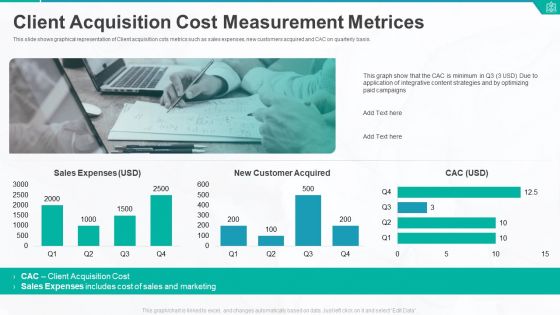
Client Acquisition Cost Measurement Metrices Ppt Pictures Slide PDF
This slide shows graphical representation of Client acquisition cots metrics such as sales expenses, new customers acquired and CAC on quarterly basis. Deliver and pitch your topic in the best possible manner with this client acquisition cost measurement metrices ppt pictures slide pdf. Use them to share invaluable insights on sales expenses, new customer acquired, client acquisition cost and impress your audience. This template can be altered and modified as per your expectations. So, grab it now.
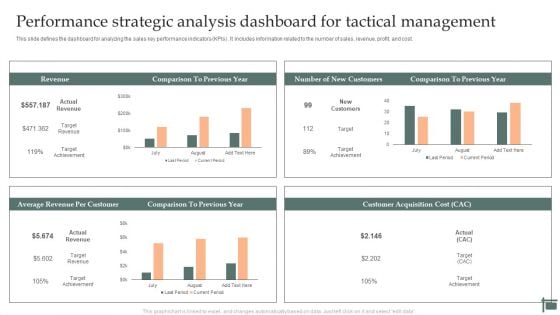
Performance Strategic Analysis Dashboard For Tactical Management Rules PDF
This slide defines the dashboard for analyzing the sales key performance indicators KPIs. It includes information related to the number of sales, revenue, profit, and cost. Showcasing this set of slides titled Performance Strategic Analysis Dashboard For Tactical Management Rules PDF. The topics addressed in these templates are Revenue, New Customers, Average Revenue, Per Customer. All the content presented in this PPT design is completely editable. Download it and make adjustments in color, background, font etc. as per your unique business setting.
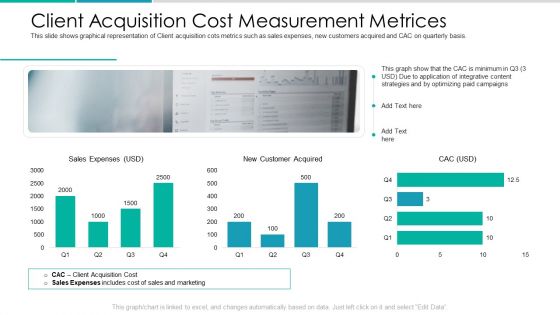
Client Acquisition Cost For Customer Retention Client Acquisition Cost Measurement Metrices Pictures PDF
This slide shows graphical representation of Client acquisition cots metrics such as sales expenses, new customers acquired and CAC on quarterly basis. Deliver and pitch your topic in the best possible manner with this client acquisition cost for customer retention client acquisition cost measurement metrices pictures pdf. Use them to share invaluable insights on campaigns, strategies, marketing, cost, sales and impress your audience. This template can be altered and modified as per your expectations. So, grab it now.
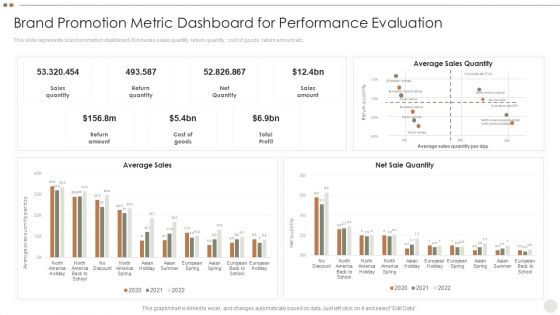
Online Promotional Techniques To Increase Brand Promotion Metric Dashboard For Performance Evaluation Brochure PDF
This slide represents brand promotion dashboard. It includes sales quantity, return quantity, cost of goods, return amount etc.Deliver an awe inspiring pitch with this creative Online Promotional Techniques To Increase Brand Promotion Metric Dashboard For Performance Evaluation Brochure PDF bundle. Topics like Sales Quantity, Return Quantity, Net Quantity can be discussed with this completely editable template. It is available for immediate download depending on the needs and requirements of the user.
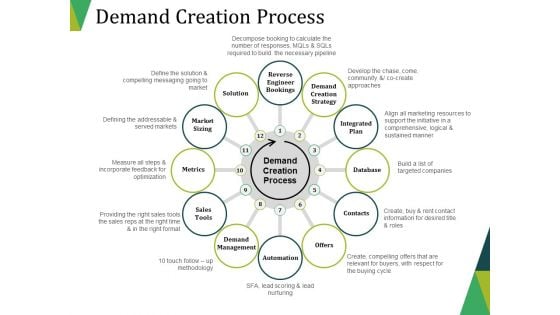
Demand Creation Process Ppt PowerPoint Presentation Design Templates
This is a demand creation process ppt powerpoint presentation design templates. This is a twelve stage process. The stages in this process are market sizing, metrics, sales tools, demand management, automation, offers, contacts.
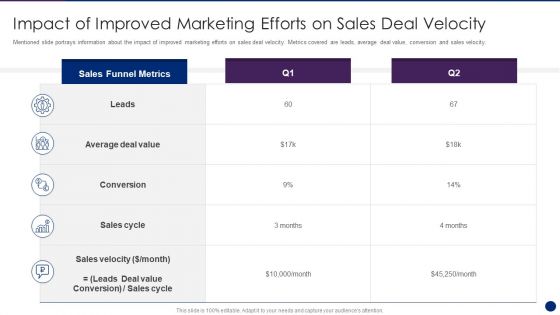
Interpreting Market Kinetics Influence Customer Purchasing Impact Of Improved Marketing Background PDF
Mentioned slide portrays information about the impact of improved marketing efforts on sales deal velocity. Metrics covered are leads, average deal value, conversion and sales velocity. Deliver an awe inspiring pitch with this creative interpreting market kinetics influence customer purchasing impact of improved marketing background pdf bundle. Topics like global tech market outlook purchases of tech goods and services can be discussed with this completely editable template. It is available for immediate download depending on the needs and requirements of the user.
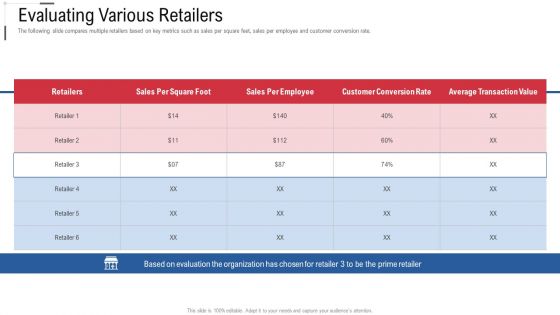
Evaluating Various Retailers Online Trade Marketing And Promotion Rules PDF
The following slide compares multiple retailers based on key metrics such as sales per square feet, sales per employee and customer conversion rate. Deliver and pitch your topic in the best possible manner with this evaluating various retailers online trade marketing and promotion rules pdf. Use them to share invaluable insights on evaluating various retailers and impress your audience. This template can be altered and modified as per your expectations. So, grab it now.
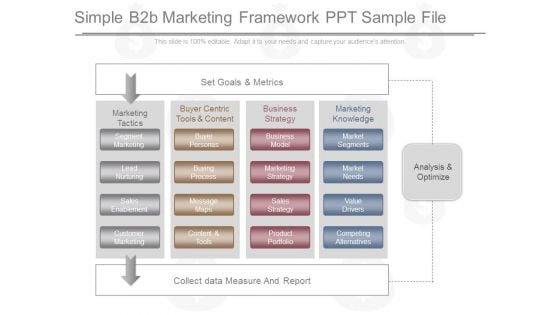
Simple B2b Marketing Framework Ppt Sample File
This is a simple b2b marketing framework ppt sample file. This is a four stage process. The stages in this process are set goals and metrics, marketing tactics, segment marketing, lead nurturing, sales enablement, customer marketing, buyer centric tools and content, buyer personas, buying process, message maps, content and tools, business strategy, business model, marketing strategy, sales strategy, product portfolio, marketing knowledge, market segments, market needs, value drivers, competing alternatives, analysis and optimize.
Kpis Deriving Demand Driven Manufacturing Operations Icons PDF
This slide represents the metrics which drive actions for demand driven manufacturing operations. It includes details related to operations, supplier, customer sales and quality. Showcasing this set of slides titled Kpis Deriving Demand Driven Manufacturing Operations Icons PDF. The topics addressed in these templates are Operations, Supplier, Customer Or Sales, Quality. All the content presented in this PPT design is completely editable. Download it and make adjustments in color, background, font etc. as per your unique business setting.
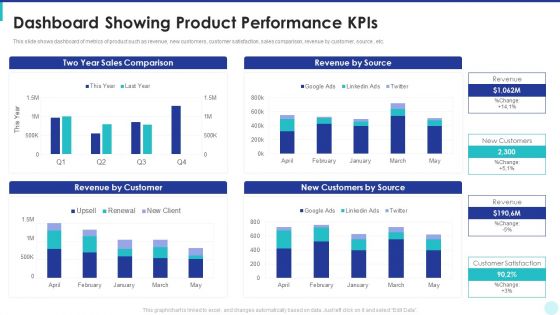
Optimization Of Product Development Life Cycle Dashboard Showing Product Performance Kpis Topics PDF
This slide shows dashboard of metrics of product such as revenue, new customers, customer satisfaction, sales comparison, revenue by customer, source , etc. Deliver an awe inspiring pitch with this creative optimization of product development life cycle dashboard showing product performance kpis topics pdf bundle. Topics like sales comparison, revenue by source, revenue by customer, customers by source can be discussed with this completely editable template. It is available for immediate download depending on the needs and requirements of the user.
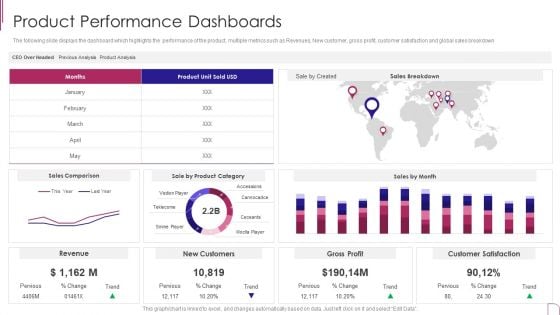
Yearly Product Performance Assessment Repor Product Performance Dashboards Designs PDF
The following slide displays the dashboard which highlights the performance of the product, multiple metrics such as Revenues, New customer, gross profit, customer satisfaction and global sales breakdown.Deliver and pitch your topic in the best possible manner with this Yearly Product Performance Assessment Repor Product Performance Dashboards Designs PDF Use them to share invaluable insights on Gross Profit, Customer Satisfaction, Sales Comparison and impress your audience. This template can be altered and modified as per your expectations. So, grab it now.
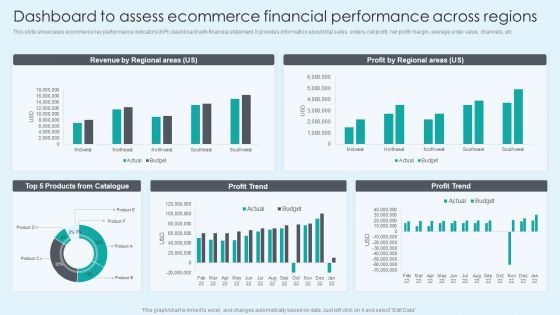
Dashboard To Assess Ecommerce Financial Performance Across Regions Themes PDF
This slide showcases ecommerce key performance indicators KPI dashboard with financial statement. It provides information about total sales, orders, net profit, net profit margin, average order value, channels, etc. Here you can discover an assortment of the finest PowerPoint and Google Slides templates. With these templates, you can create presentations for a variety of purposes while simultaneously providing your audience with an eye catching visual experience. Download Dashboard To Assess Ecommerce Financial Performance Across Regions Themes PDF to deliver an impeccable presentation. These templates will make your job of preparing presentations much quicker, yet still, maintain a high level of quality. Slidegeeks has experienced researchers who prepare these templates and write high quality content for you. Later on, you can personalize the content by editing the Dashboard To Assess Ecommerce Financial Performance Across Regions Themes PDF.
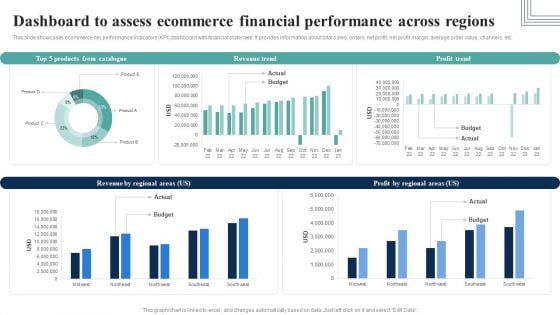
Dashboard To Assess Ecommerce Financial Performance Across Regions Infographics PDF
This slide showcases ecommerce key performance indicators KPI dashboard with financial statement. It provides information about total sales, orders, net profit, net profit margin, average order value, channels, etc.Here you can discover an assortment of the finest PowerPoint and Google Slides templates. With these templates, you can create presentations for a variety of purposes while simultaneously providing your audience with an eye-catching visual experience. Download Dashboard To Assess Ecommerce Financial Performance Across Regions Infographics PDF to deliver an impeccable presentation. These templates will make your job of preparing presentations much quicker, yet still, maintain a high level of quality. Slidegeeks has experienced researchers who prepare these templates and write high-quality content for you. Later on, you can personalize the content by editing the Dashboard To Assess Ecommerce Financial Performance Across Regions Infographics PDF.
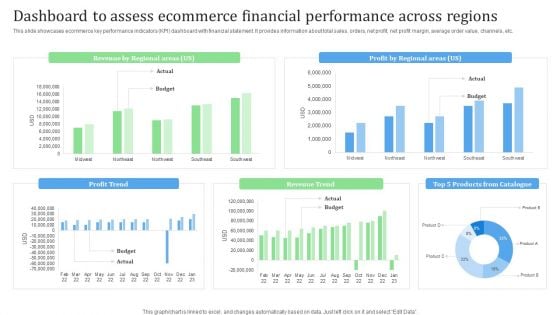
Dashboard To Assess Ecommerce Financial Performance Across Regions Financial Management Strategies Clipart PDF
This slide showcases ecommerce key performance indicators KPI dashboard with financial statement. It provides information about total sales, orders, net profit, net profit margin, average order value, channels, etc.Present like a pro with Dashboard To Assess Ecommerce Financial Performance Across Regions Financial Management Strategies Clipart PDF Create beautiful presentations together with your team, using our easy-to-use presentation slides. Share your ideas in real-time and make changes on the fly by downloading our templates. So whether you are in the office, on the go, or in a remote location, you can stay in sync with your team and present your ideas with confidence. With Slidegeeks presentation got a whole lot easier. Grab these presentations today.
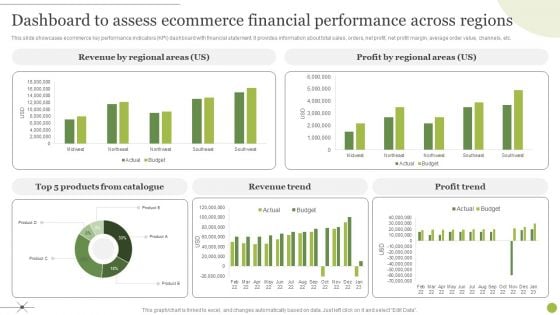
Managing E Commerce Business Accounting Dashboard To Assess Ecommerce Financial Performance Across Regions Graphics PDF
This slide showcases ecommerce key performance indicators KPI dashboard with financial statement. It provides information about total sales, orders, net profit, net profit margin, average order value, channels, etc. Do you have to make sure that everyone on your team knows about any specific topic I yes, then you should give Managing E Commerce Business Accounting Dashboard To Assess Ecommerce Financial Performance Across Regions Graphics PDF a try. Our experts have put a lot of knowledge and effort into creating this impeccable Managing E Commerce Business Accounting Dashboard To Assess Ecommerce Financial Performance Across Regions Graphics PDF. You can use this template for your upcoming presentations, as the slides are perfect to represent even the tiniest detail. You can download these templates from the Slidegeeks website and these are easy to edit. So grab these today.
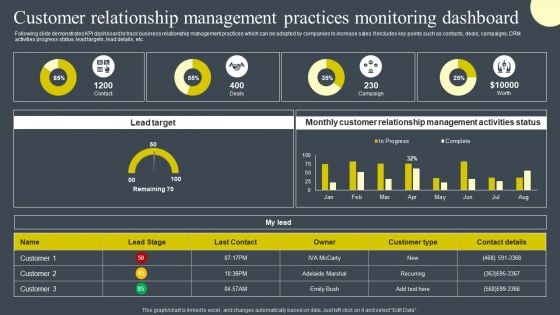
Customer Relationship Management Practices Monitoring Dashboard Designs PDF
Following slide demonstrates KPI dashboard to track business relationship management practices which can be adopted by companies to increase sales. It includes key points such as contacts, deals, campaigns, CRM activities progress status, lead targets, lead details, etc. Are you in need of a template that can accommodate all of your creative concepts This one is crafted professionally and can be altered to fit any style. Use it with Google Slides or PowerPoint. Include striking photographs, symbols, depictions, and other visuals. Fill, move around, or remove text boxes as desired. Test out color palettes and font mixtures. Edit and save your work, or work with colleagues. Download Customer Relationship Management Practices Monitoring Dashboard Designs PDF and observe how to make your presentation outstanding. Give an impeccable presentation to your group and make your presentation unforgettable.
Business Event Return On Investment Tracking Tools And Metrics Portrait Pdf
The slide displays event ROI metrics and tools that aid in determining net value and costs contributing to an events success. It contains business goals such as brand awareness. Sales revenue, event engagement, recruitment etc. event goals, ROI metrics, ROI tools, etc. Pitch your topic with ease and precision using this Business Event Return On Investment Tracking Tools And Metrics Portrait Pdf This layout presents information on Building Brand Awareness, Driving Sales Revenue, Driving Recruitment It is also available for immediate download and adjustment. So, changes can be made in the color, design, graphics or any other component to create a unique layout. The slide displays event ROI metrics and tools that aid in determining net value and costs contributing to an events success. It contains business goals such as brand awareness. Sales revenue, event engagement, recruitment etc. event goals, ROI metrics, ROI tools, etc.

Financial Metrics Of Commercial Vehicles Luxury Automobile Vehicles PPT Slide CP SS V
This slide showcases the financial metrics of commercial vehicles. It includes metrics such as sales volume in units, revenue in crores, domestic market share and EBITDA percent and Y-O-Y growth. Make sure to capture your audiences attention in your business displays with our gratis customizable Financial Metrics Of Commercial Vehicles Luxury Automobile Vehicles PPT Slide CP SS V. These are great for business strategies, office conferences, capital raising or task suggestions. If you desire to acquire more customers for your tech business and ensure they stay satisfied, create your own sales presentation with these plain slides. This slide showcases the financial metrics of commercial vehicles. It includes metrics such as sales volume in units, revenue in crores, domestic market share and EBITDA percent and Y-O-Y growth.

Key Performance Indicators Of ABC Carbonated Drink Company With Future Targets Introduction PDF
The slide shows the key Performance Indicator KPIs which will help the company to track the success rate of implemented strategies. Some of the KPIs are Sales Volume, Average Selling Time, On-Shelf Product Availability, Cash to Cash Cycle Time, Customer Satisfaction Level etc. Deliver an awe-inspiring pitch with this creative key performance indicators of abc carbonated drink company with future targets introduction pdf. bundle. Topics like key performance indicators, sales volume, average, warehouses worldwide, administrative expenses can be discussed with this completely editable template. It is available for immediate download depending on the needs and requirements of the user.
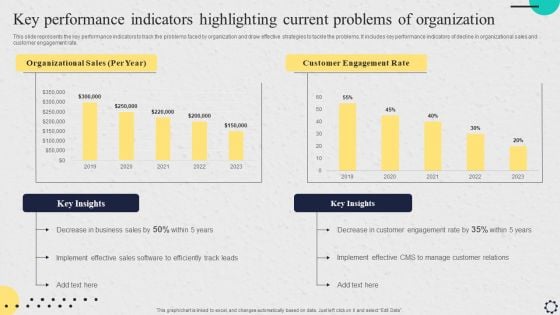
Software Implementation Strategy Key Performance Indicators Highlighting Current Problems Of Organization Professional PDF
This slide represents the key performance indicators to track the problems faced by organization and draw effective strategies to tackle the problems. It includes key performance indicators of decline in organizational sales and customer engagement rate. Make sure to capture your audiences attention in your business displays with our gratis customizable Software Implementation Strategy Key Performance Indicators Highlighting Current Problems Of Organization Professional PDF. These are great for business strategies, office conferences, capital raising or task suggestions. If you desire to acquire more customers for your tech business and ensure they stay satisfied, create your own sales presentation with these plain slides.
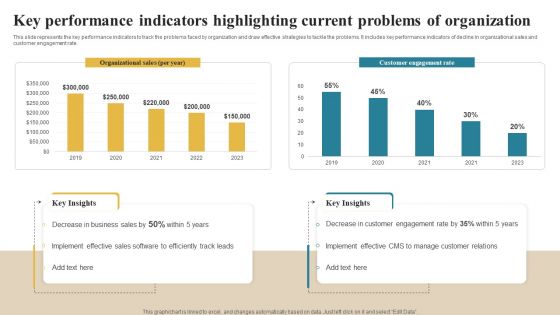
Software Implementation Technique Key Performance Indicators Highlighting Current Problems Elements PDF
This slide represents the key performance indicators to track the problems faced by organization and draw effective strategies to tackle the problems. It includes key performance indicators of decline in organizational sales and customer engagement rate. Make sure to capture your audiences attention in your business displays with our gratis customizable Software Implementation Technique Key Performance Indicators Highlighting Current Problems Elements PDF. These are great for business strategies, office conferences, capital raising or task suggestions. If you desire to acquire more customers for your tech business and ensure they stay satisfied, create your own sales presentation with these plain slides.
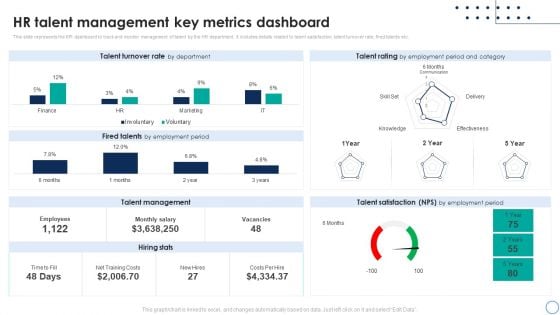
Business Analytics Application HR Talent Management Key Metrics Dashboard Rules PDF
This slide represents the KPI dashboard to track and monitor management of talent by the HR department. It includes details related to talent satisfaction, talent turnover rate, fired talents etc. This Business Analytics Application HR Talent Management Key Metrics Dashboard Rules PDF is perfect for any presentation, be it in front of clients or colleagues. It is a versatile and stylish solution for organizing your meetings. The Business Analytics Application HR Talent Management Key Metrics Dashboard Rules PDF features a modern design for your presentation meetings. The adjustable and customizable slides provide unlimited possibilities for acing up your presentation. Slidegeeks has done all the homework before launching the product for you. So, dont wait, grab the presentation templates today.
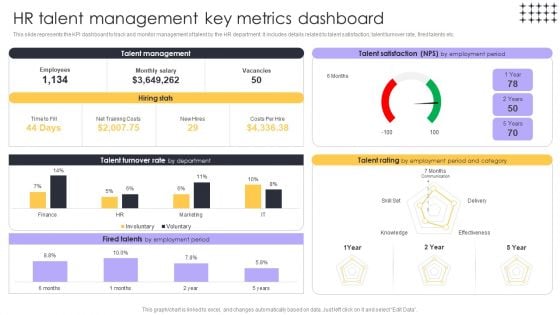
Tools For HR Business Analytics HR Talent Management Key Metrics Structure PDF
This slide represents the KPI dashboard to track and monitor management of talent by the HR department. It includes details related to talent satisfaction, talent turnover rate, fired talents etc. This modern and well-arranged Tools For HR Business Analytics HR Talent Management Key Metrics Structure PDF provides lots of creative possibilities. It is very simple to customize and edit with the Powerpoint Software. Just drag and drop your pictures into the shapes. All facets of this template can be edited with Powerpoint, no extra software is necessary. Add your own material, put your images in the places assigned for them, adjust the colors, and then you can show your slides to the world, with an animated slide included.
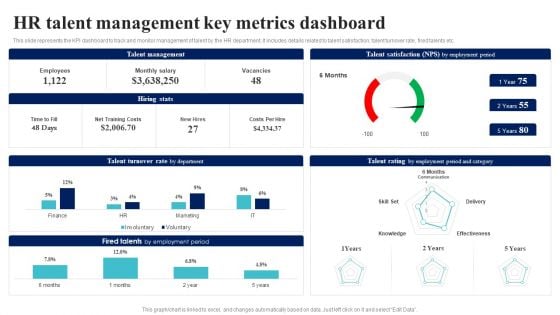
BI Implementation To Enhance Hiring Process Hr Talent Management Key Metrics Dashboard Brochure PDF
This slide represents the KPI dashboard to track and monitor management of talent by the HR department. It includes details related to talent satisfaction, talent turnover rate, fired talents etc.This BI Implementation To Enhance Hiring Process Hr Talent Management Key Metrics Dashboard Brochure PDF is perfect for any presentation, be it in front of clients or colleagues. It is a versatile and stylish solution for organizing your meetings. The BI Implementation To Enhance Hiring Process Hr Talent Management Key Metrics Dashboard Brochure PDF features a modern design for your presentation meetings. The adjustable and customizable slides provide unlimited possibilities for acing up your presentation. Slidegeeks has done all the homework before launching the product for you. So, do not wait, grab the presentation templates today.
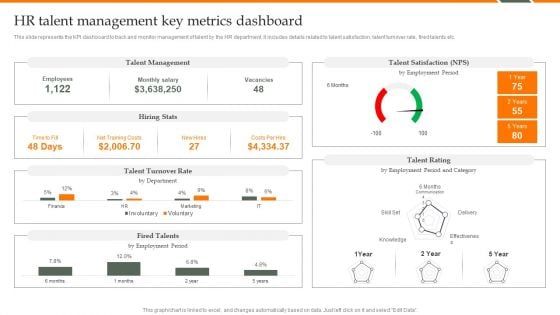
Human Resource Analytics HR Talent Management Key Metrics Dashboard Brochure PDF
This slide represents the KPI dashboard to track and monitor management of talent by the HR department. It includes details related to talent satisfaction, talent turnover rate, fired talents etc. Coming up with a presentation necessitates that the majority of the effort goes into the content and the message you intend to convey. The visuals of a PowerPoint presentation can only be effective if it supplements and supports the story that is being told. Keeping this in mind our experts created Human Resource Analytics HR Talent Management Key Metrics Dashboard Brochure PDF to reduce the time that goes into designing the presentation. This way, you can concentrate on the message while our designers take care of providing you with the right template for the situation.
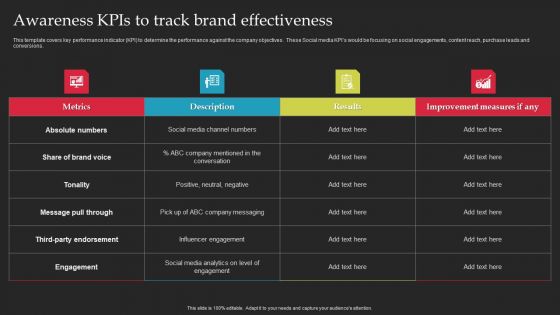
Brand Launch Checklist Awareness Kpis To Track Brand Effectiveness Ideas PDF
This template covers key performance indicator KPI to determine the performance against the company objectives. These Social media KPIs would be focusing on social engagements, content reach, purchase leads and conversions. Slidegeeks is one of the best resources for PowerPoint templates. You can download easily and regulate Brand Launch Checklist Awareness Kpis To Track Brand Effectiveness Ideas PDF for your personal presentations from our wonderful collection. A few clicks is all it takes to discover and get the most relevant and appropriate templates. Use our Templates to add a unique zing and appeal to your presentation and meetings. All the slides are easy to edit and you can use them even for advertisement purposes.
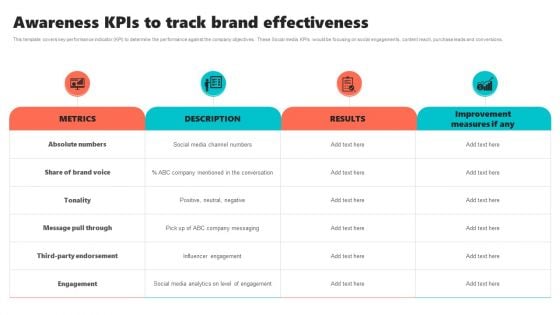
New Brand Introduction Plan Awareness Kpis To Track Brand Effectiveness Clipart PDF
This template covers key performance indicator KPI to determine the performance against the company objectives. These Social media KPIs would be focusing on social engagements, content reach, purchase leads and conversions. This modern and well-arranged New Brand Introduction Plan Awareness Kpis To Track Brand Effectiveness Clipart PDF provides lots of creative possibilities. It is very simple to customize and edit with the Powerpoint Software. Just drag and drop your pictures into the shapes. All facets of this template can be edited with Powerpoint no extra software is necessary. Add your own material, put your images in the places assigned for them, adjust the colors, and then you can show your slides to the world, with an animated slide included.
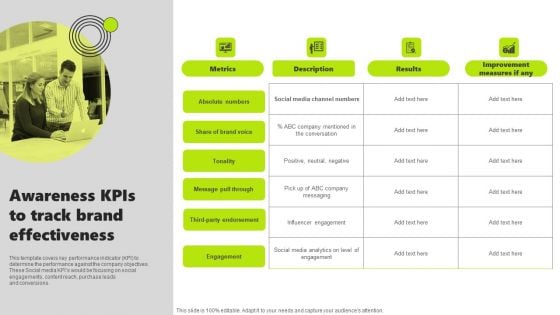
Rebrand Kick Off Plan Awareness Kpis To Track Brand Effectiveness Formats PDF
This template covers key performance indicator KPI to determine the performance against the company objectives. These Social media KPIs would be focusing on social engagements, content reach, purchase leads and conversions. Are you in need of a template that can accommodate all of your creative concepts This one is crafted professionally and can be altered to fit any style. Use it with Google Slides or PowerPoint. Include striking photographs, symbols, depictions, and other visuals. Fill, move around, or remove text boxes as desired. Test out color palettes and font mixtures. Edit and save your work, or work with colleagues. Download Rebrand Kick Off Plan Awareness Kpis To Track Brand Effectiveness Formats PDF and observe how to make your presentation outstanding. Give an impeccable presentation to your group and make your presentation unforgettable.
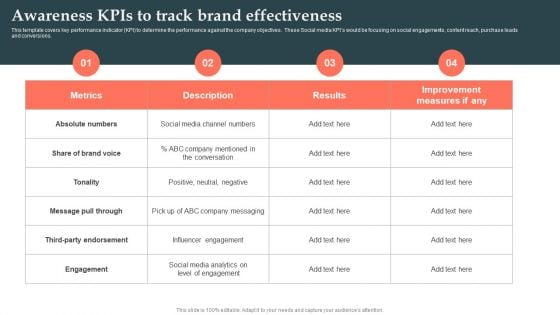
Product Launch Strategy Awareness Kpis To Track Brand Effectiveness Ppt Styles Inspiration PDF
This template covers key performance indicator KPI to determine the performance against the company objectives. These Social media KPIs would be focusing on social engagements, content reach, purchase leads and conversions. Here you can discover an assortment of the finest PowerPoint and Google Slides templates. With these templates, you can create presentations for a variety of purposes while simultaneously providing your audience with an eye catching visual experience. Download Product Launch Strategy Awareness Kpis To Track Brand Effectiveness Ppt Styles Inspiration PDF to deliver an impeccable presentation. These templates will make your job of preparing presentations much quicker, yet still, maintain a high level of quality. Slidegeeks has experienced researchers who prepare these templates and write high quality content for you. Later on, you can personalize the content by editing the Product Launch Strategy Awareness Kpis To Track Brand Effectiveness Ppt Styles Inspiration PDF.
Referral Program Performance Tracking Dashboard Consumer Contact Point Guide Icons PDF
This slide covers the KPI dashboard for analyzing referral campaign results. It includes metrics such as total revenue generated, monthly recurring revenue, new customers, clicks, cancelled customers, paying customers, etc. Are you in need of a template that can accommodate all of your creative concepts This one is crafted professionally and can be altered to fit any style. Use it with Google Slides or PowerPoint. Include striking photographs, symbols, depictions, and other visuals. Fill, move around, or remove text boxes as desired. Test out color palettes and font mixtures. Edit and save your work, or work with colleagues. Download Referral Program Performance Tracking Dashboard Consumer Contact Point Guide Icons PDF and observe how to make your presentation outstanding. Give an impeccable presentation to your group and make your presentation unforgettable.

ATS Administration To Improve Asset Management Dashboard To Track System Guidelines PDF
This slide covers KPI dashboard to track system performance. It involves detail such as total number of assets, value of assets and purchases in fiscal year. Get a simple yet stunning designed ATS Administration To Improve Asset Management Dashboard To Track System Guidelines PDF. It is the best one to establish the tone in your meetings. It is an excellent way to make your presentations highly effective. So, download this PPT today from Slidegeeks and see the positive impacts. Our easy-to-edit ATS Administration To Improve Asset Management Dashboard To Track System Guidelines PDF can be your go-to option for all upcoming conferences and meetings. So, what are you waiting for Grab this template today.
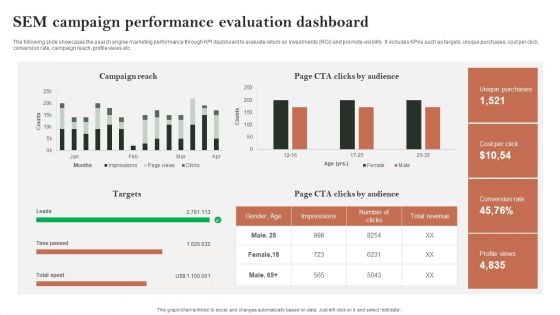
Search Engine Marketing Sem Campaign Performance Evaluation Dashboard Mockup PDF
The following slide showcases the search engine marketing performance through KPI dashboard to evaluate return on investments ROI and promote visibility. It includes KPAs such as targets, unique purchases, cost per click, conversion rate, campaign reach, profile views etc. Crafting an eye-catching presentation has never been more straightforward. Let your presentation shine with this tasteful yet straightforward Search Engine Marketing Sem Campaign Performance Evaluation Dashboard Mockup PDF template. It offers a minimalistic and classy look that is great for making a statement. The colors have been employed intelligently to add a bit of playfulness while still remaining professional. Construct the ideal Search Engine Marketing Sem Campaign Performance Evaluation Dashboard Mockup PDF that effortlessly grabs the attention of your audience Begin now and be certain to wow your customers.
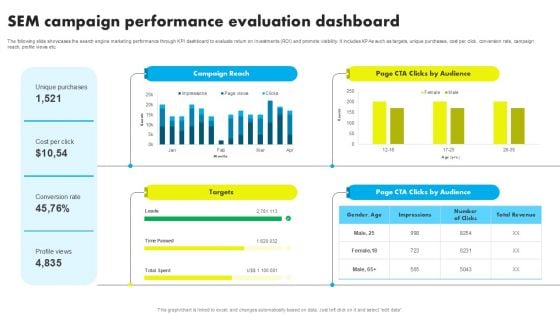
SEM Campaign Performance Evaluation Dashboard Ppt Icon Graphics Tutorials PDF
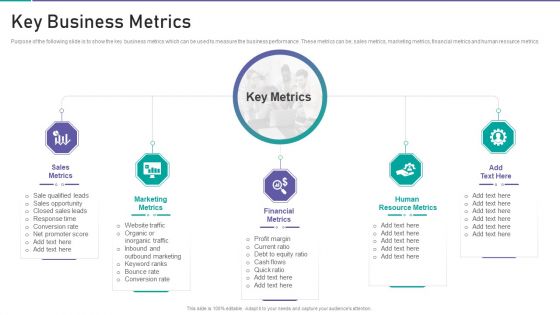
Corporate Organization Playbook Key Business Metrics Ppt Inspiration Elements PDF
Purpose of the following slide is to show the key business metrics which can be used to measure the business performance. These metrics can be sales metrics, marketing metrics, financial metrics and human resource metrics. Presenting corporate organization playbook key business metrics ppt inspiration elements pdf to provide visual cues and insights. Share and navigate important information on five stages that need your due attention. This template can be used to pitch topics like sales metrics, marketing metrics, financial metrics, human resource metrics. In addtion, this PPT design contains high resolution images, graphics, etc, that are easily editable and available for immediate download.
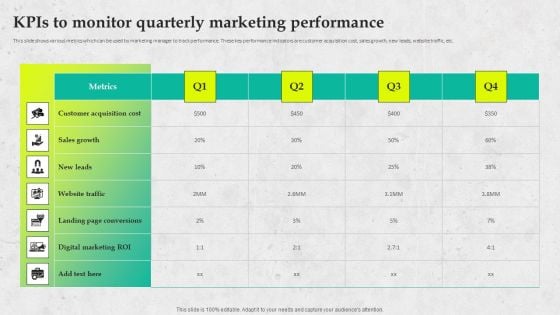
Service Promotion Plan Kpis To Monitor Quarterly Marketing Performance Diagrams PDF
This slide shows various metrics which can be used by marketing manager to track performance. These key performance indicators are customer acquisition cost, sales growth, new leads, website traffic, etc. Make sure to capture your audiences attention in your business displays with our gratis customizable Service Promotion Plan Kpis To Monitor Quarterly Marketing Performance Diagrams PDF. These are great for business strategies, office conferences, capital raising or task suggestions. If you desire to acquire more customers for your tech business and ensure they stay satisfied, create your own sales presentation with these plain slides.
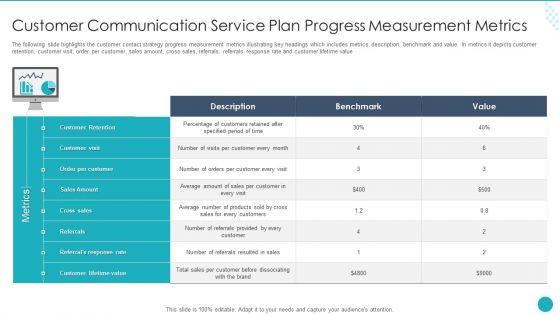
Customer Communication Service Plan Progress Measurement Metrics Diagrams PDF
The following slide highlights the customer contact strategy progress measurement metrics illustrating key headings which includes metrics, description, benchmark and value. In metrics it depicts customer retention, customer visit, order per customer, sales amount, cross sales, referrals, referrals response rate and customer lifetime value Persuade your audience using this one. This PPT design covers one stages, thus making it a great tool to use. It also caters to a variety of topics including Customer Retention, Customer Visit, Order Per Customer. Download this PPT design now to present a convincing pitch that not only emphasizes the topic but also showcases your presentation skills.
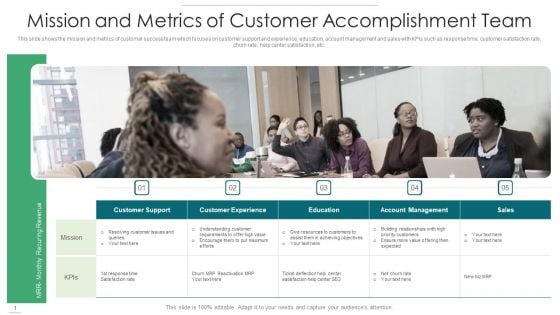
Mission And Metrics Of Customer Accomplishment Team Demonstration PDF
This slide shows the mission and metrics of customer success team which focuses on customer support and experience, education, account management and sales with KPIs such as response time, customer satisfaction rate, churn rate, help center satisfaction, etc. Presenting mission and metrics of customer accomplishment team demonstration pdf to dispense important information. This template comprises five stages. It also presents valuable insights into the topics including customer support, customer experience, education, account management, sales. This is a completely customizable PowerPoint theme that can be put to use immediately. So, download it and address the topic impactfully.
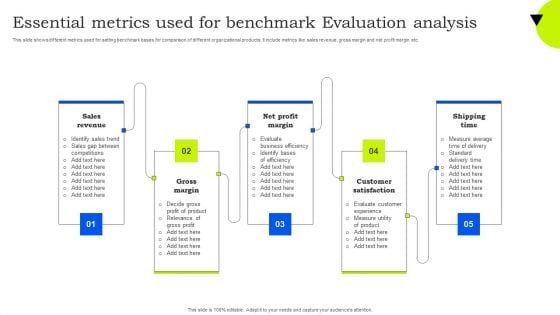
Essential Metrics Used For Benchmark Evaluation Analysis Ideas PDF
This slide shows different metrics used for setting benchmark bases for comparison of different organizational products. It include metrics like sales revenue, gross margin and net profit margin etc. Presenting Essential Metrics Used For Benchmark Evaluation Analysis Ideas PDF to dispense important information. This template comprises five stages. It also presents valuable insights into the topics including Sales Revenue, Gross Margin, Net Profit Margin. This is a completely customizable PowerPoint theme that can be put to use immediately. So, download it and address the topic impactfully.
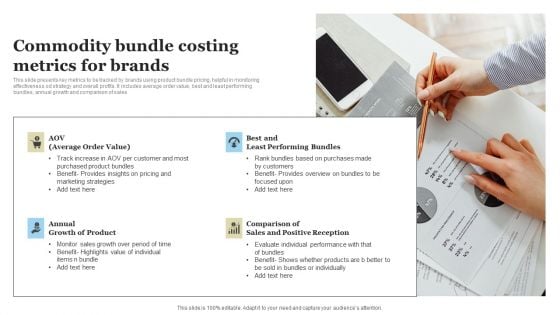
Commodity Bundle Costing Metrics For Brands Structure PDF
This slide presents key metrics to be tracked by brands using product bundle pricing, helpful in monitoring effectiveness od strategy and overall profits. It includes average order value, best and least performing bundles, annual growth and comparison of sales. Presenting Commodity Bundle Costing Metrics For Brands Structure PDF to dispense important information. This template comprises four stages. It also presents valuable insights into the topics including AOV, Best Least Performing Bundles, Annual Growth Of Product, Comparison Sales Positive Reception. This is a completely customizable PowerPoint theme that can be put to use immediately. So, download it and address the topic impactfully.
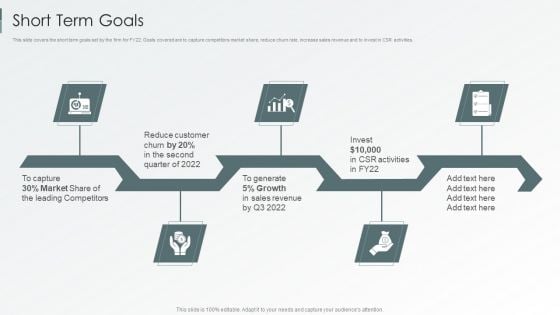
Enterprise Sustainability Performance Metrics Short Term Goals Summary PDF
This slide covers the short term goals set by the firm for FY22. Goals covered are to capture competitors market share, reduce churn rate, increase sales revenue and to invest in CSR activities.This is a Enterprise Sustainability Performance Metrics Short Term Goals Summary PDF template with various stages. Focus and dispense information on five stages using this creative set, that comes with editable features. It contains large content boxes to add your information on topics like Leading Competitors, Sales Revenue, Reduce Customer. You can also showcase facts, figures, and other relevant content using this PPT layout. Grab it now.

Metrics To Measure Business Performance Short Term Goals Ppt Portfolio Good PDF
This slide covers the short term goals set by the firm for FY20. Goals covered are to capture competitors market share, reduce churn rate, increase sales revenue and to invest in CSR activities. This is a Metrics To Measure Business Performance Short Term Goals Ppt Portfolio Good PDF template with various stages. Focus and dispense information on five stages using this creative set, that comes with editable features. It contains large content boxes to add your information on topics like Reduce Customer Churn, Growth, Invest, Sales Revenue. You can also showcase facts, figures, and other relevant content using this PPT layout. Grab it now.
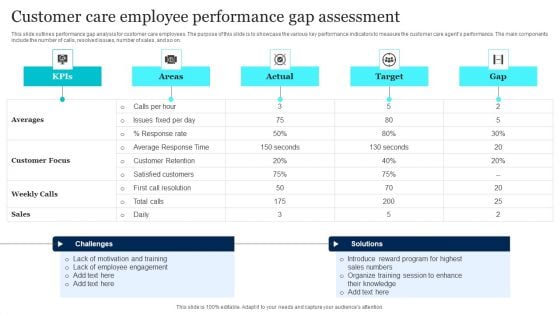
Customer Care Employee Performance Gap Assessment Download PDF
This slide outlines performance gap analysis for customer care employees. The purpose of this slide is to showcase the various key performance indicators to measure the customer care agents performance. The main components include the number of calls, resolved issues, number of sales, and so on. Pitch your topic with ease and precision using this Customer Care Employee Performance Gap Assessment Download PDF. This layout presents information on Employee Engagement, Organize Training, Sales Numbers. It is also available for immediate download and adjustment. So, changes can be made in the color, design, graphics or any other component to create a unique layout.
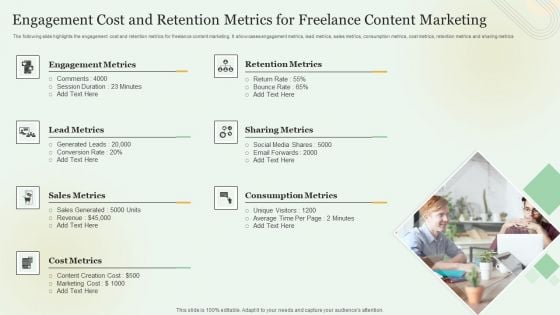
Engagement Cost And Retention Metrics For Freelance Content Marketing Summary PDF
The following slide highlights the engagement cost and retention metrics for freelance content marketing. It showcases engagement metrics, lead metrics, sales metrics, consumption metrics, cost metrics, retention metrics and sharing metrics. Presenting Engagement Cost And Retention Metrics For Freelance Content Marketing Summary PDF to dispense important information. This template comprises seven stages. It also presents valuable insights into the topics including Engagement Metrics, Lead Metrics, Sales Metrics. This is a completely customizable PowerPoint theme that can be put to use immediately. So, download it and address the topic impactfully.
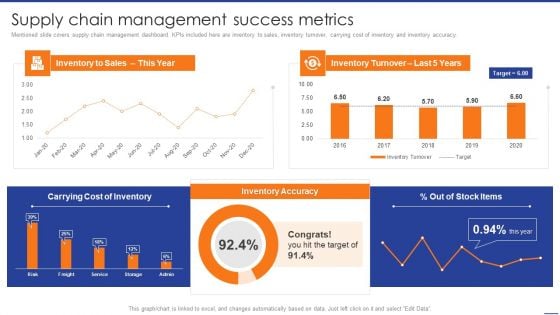
Digital Transformation Of Supply Supply Chain Management Success Metrics Download PDF
Mentioned slide covers supply chain management dashboard. KPIs included here are inventory to sales, inventory turnover, carrying cost of inventory and inventory accuracy. Slidegeeks is here to make your presentations a breeze with Digital Transformation Of Supply Supply Chain Management Success Metrics Download PDF With our easy-to-use and customizable templates, you can focus on delivering your ideas rather than worrying about formatting. With a variety of designs to choose from, youre sure to find one that suits your needs. And with animations and unique photos, illustrations, and fonts, you can make your presentation pop. So whether youre giving a sales pitch or presenting to the board, make sure to check out Slidegeeks first.
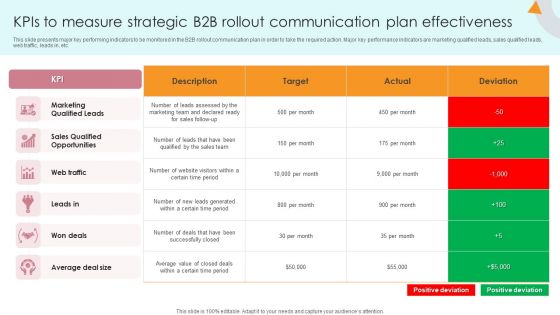
Kpis To Measure Strategic B2B Rollout Communication Plan Effectiveness Summary PDF
This slide presents major key performing indicators to be monitored in the B2B rollout communication plan in order to take the required action. Major key performance indicators are marketing qualified leads, sales qualified leads, web traffic, leads in, etc. Showcasing this set of slides titled Kpis To Measure Strategic B2B Rollout Communication Plan Effectiveness Summary PDF. The topics addressed in these templates are Marketing Qualified Leads, Sales Qualified Opportunities, Web Traffic. All the content presented in this PPT design is completely editable. Download it and make adjustments in color, background, font etc. as per your unique business setting.


 Continue with Email

 Home
Home


