Sales Management
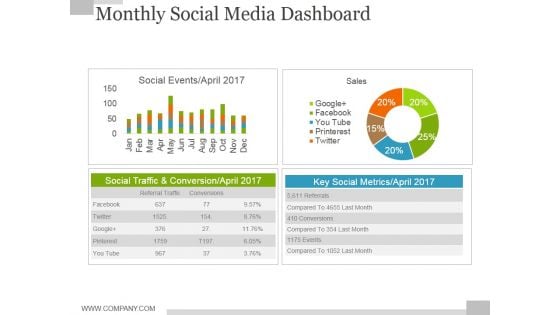
Monthly Social Media Dashboard Ppt PowerPoint Presentation Model Slide
This is a monthly social media dashboard ppt powerpoint presentation model slide. This is a four stage process. The stages in this process are sales, social events, business, finance, key social metrics.
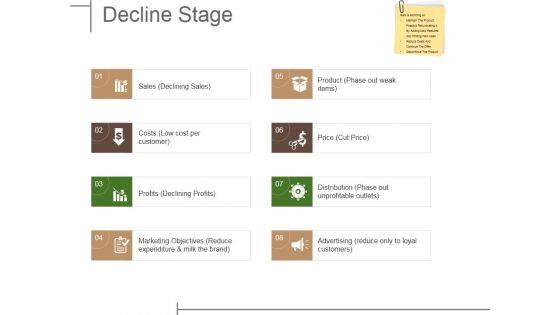
Decline Stage Ppt PowerPoint Presentation Show Demonstration
This is a decline stage ppt powerpoint presentation show demonstration. This is a eight stage process. The stages in this process are sales, costs, profits, marketing objectives, product, price.
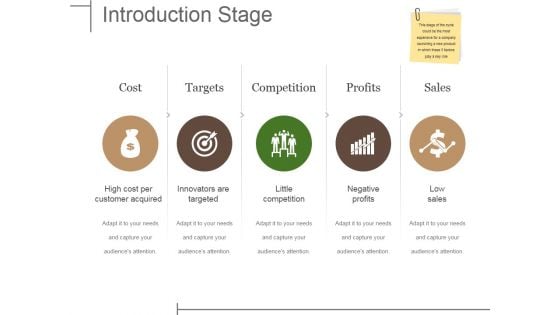
Introduction Stage Ppt PowerPoint Presentation Infographic Template Graphics Template
This is a introduction stage ppt powerpoint presentation infographic template graphics template. This is a five stage process. The stages in this process are cost, targets, competition, profits, sales.
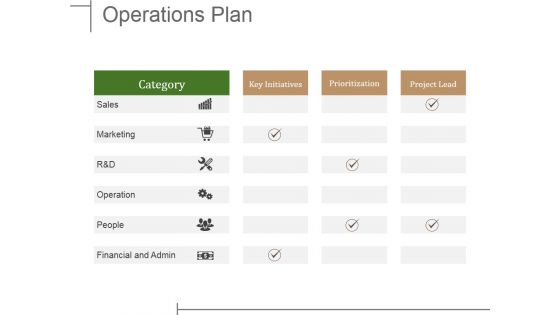
Operations Plan Ppt PowerPoint Presentation Infographic Template Example 2015
This is a operations plan ppt powerpoint presentation infographic template example 2015. This is a six stage process. The stages in this process are key initiatives, prioritization, project lead, sales, marketing.
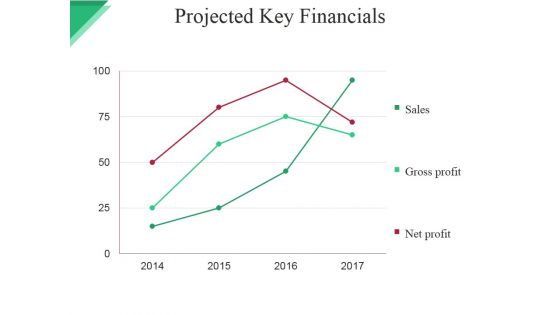
Projected Key Financials Template Ppt PowerPoint Presentation File Graphic Images
This is a projected key financials template ppt powerpoint presentation file graphic images. This is a four stage process. The stages in this process are sales, gross profit, net profit.
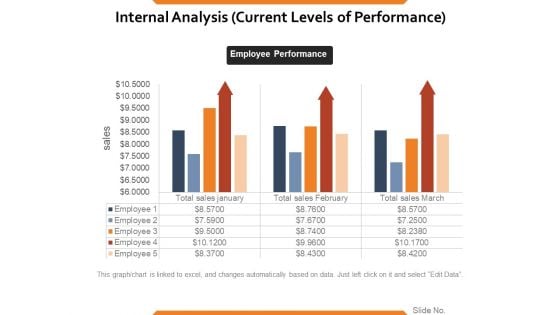
Internal Analysis Current Levels Of Performance Ppt PowerPoint Presentation Ideas Vector
This is a internal analysis current levels of performance ppt powerpoint presentation ideas vector. This is a three stage process. The stages in this process are sales, employee performance, business, finance, marketing.
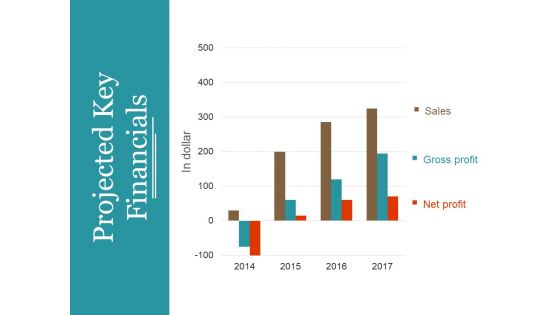
Projected Key Financials Template 1 Ppt PowerPoint Presentation Summary Professional
This is a projected key financials template 1 ppt powerpoint presentation summary professional. This is a three stage process. The stages in this process are in dollar, sales, gross profit, net profit, graph, year.
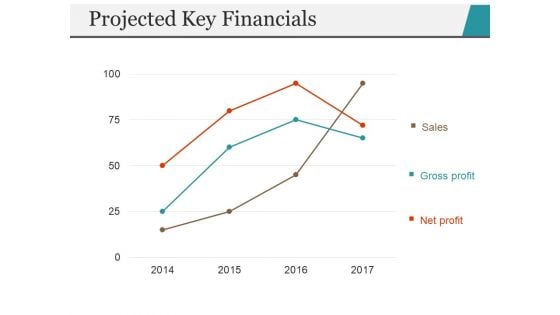
Projected Key Financials Template 2 Ppt PowerPoint Presentation Portfolio Inspiration
This is a projected key financials template 2 ppt powerpoint presentation portfolio inspiration. This is a three stage process. The stages in this process are sales, gross profit, net profit, year, finance.
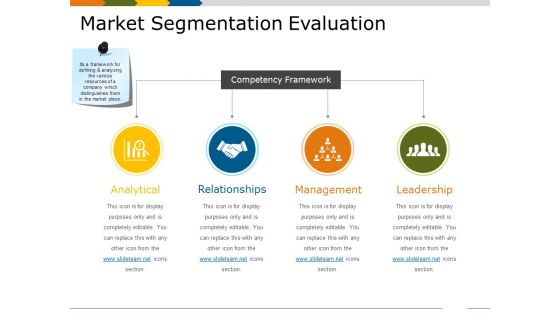
Market Segmentation Evaluation Ppt PowerPoint Presentation Infographics Background
This is a market segmentation evaluation ppt powerpoint presentation infographics background. This is a two stage process. The stages in this process are market sales, net profit, icons, finance, business, marketing.
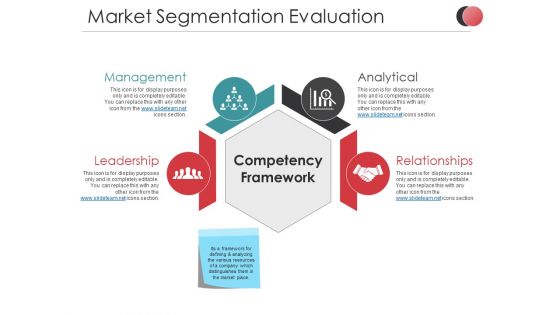
Market Segmentation Evaluation Ppt PowerPoint Presentation Summary Slideshow
This is a market segmentation evaluation ppt powerpoint presentation summary slideshow. This is a two stage process. The stages in this process are net profit, market sales, business, marketing, finance, icons.
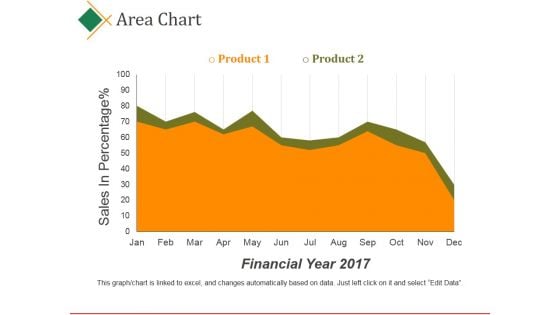
Area Chart Ppt PowerPoint Presentation Pictures Files
This is a area chart ppt powerpoint presentation pictures files. This is a two stage process. The stages in this process are product, sales, in percentage, financial year, business.
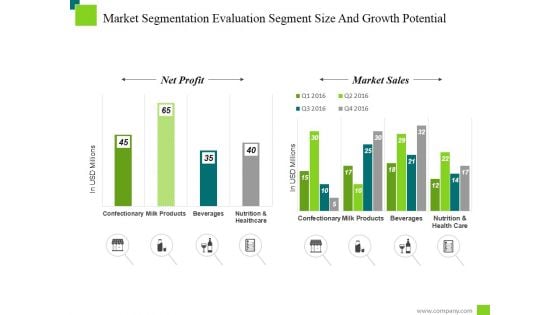
Market Segmentation Evaluation Segment Size And Growth Potential Ppt PowerPoint Presentation Model
This is a market segmentation evaluation segment size and growth potential ppt powerpoint presentation model. This is a two stage process. The stages in this process are net profit, market sales, milk products, confectionary.
Quality Cost Report Ppt PowerPoint Presentation Icon Information
This is a quality cost report ppt powerpoint presentation icon information. This is a three stage process. The stages in this process are types of cost, quality cost, percentage of sales, prevention cost business.
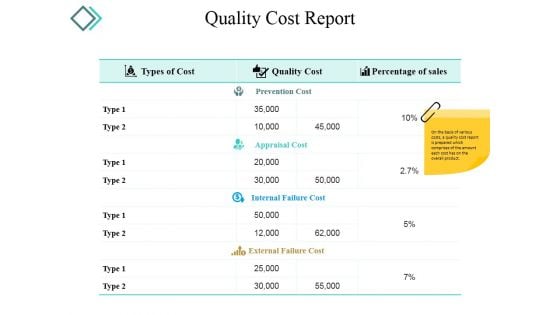
Quality Cost Report Template 2 Ppt PowerPoint Presentation Professional
This is a quality cost report template 2 ppt powerpoint presentation professional. This is a two stage process. The stages in this process are types of cost, quality cost, percentage of sales, prevention cost.
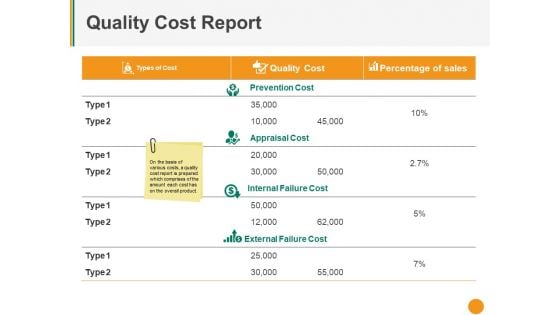
Quality Cost Report Ppt PowerPoint Presentation Model Portrait
This is a quality cost report ppt powerpoint presentation model portrait. This is a three stage process. The stages in this process are types of cost, quality cost, percentage of sales, prevention cost, appraisal cost.
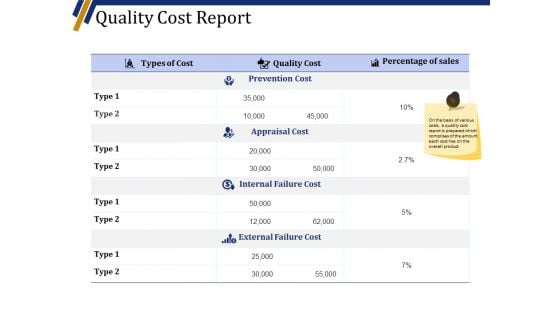
Quality Cost Report Ppt PowerPoint Presentation Portfolio Show
This is a quality cost report ppt powerpoint presentation portfolio show. This is a four stage process. The stages in this process are types of cost, quality cost, percentage of sales, prevention cost, appraisal cost.
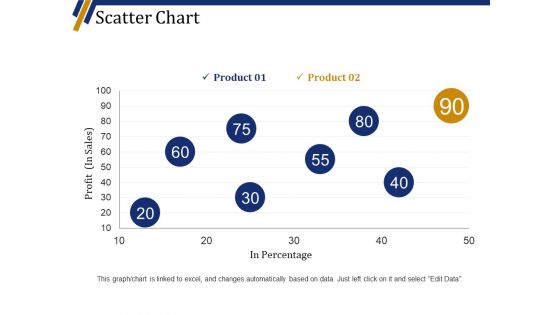
Scatter Chart Ppt PowerPoint Presentation Summary Visuals
This is a scatter chart ppt powerpoint presentation summary visuals. This is a eight stage process. The stages in this process are product, profit in sales, in percentage, finance, business.
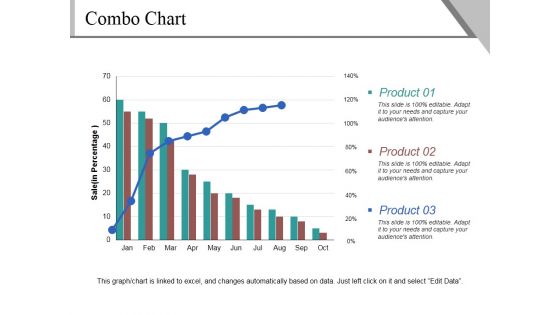
Combo Chart Ppt PowerPoint Presentation Ideas Visual Aids
This is a combo chart ppt powerpoint presentation ideas visual aids. This is a three stage process. The stages in this process are product, sales, bar graph, business, marketing.

Ideal Acquisition Cost Model Ppt PowerPoint Presentation Inspiration Background Designs
This is a ideal acquisition cost model ppt powerpoint presentation inspiration background designs. This is a two stage process. The stages in this process are cost to acquire a customer, monetization, recurring revenue, field sales.
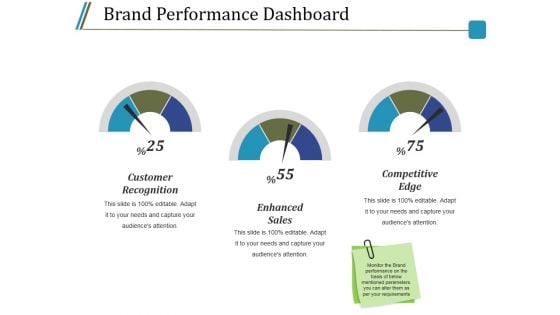
Brand Performance Dashboard Ppt PowerPoint Presentation Infographics Shapes
This is a brand performance dashboard ppt powerpoint presentation infographics shapes. This is a three stage process. The stages in this process are customer recognition, enhanced sales, competitive edge.
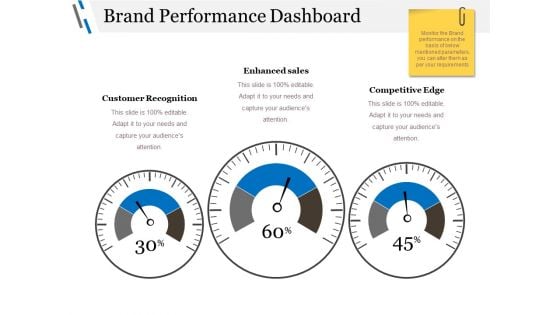
Brand Performance Dashboard Ppt PowerPoint Presentation Professional Grid
This is a brand performance dashboard ppt powerpoint presentation professional grid. This is a three stage process. The stages in this process are customer recognition, enhanced sales, competitive edge, dashboard, business.
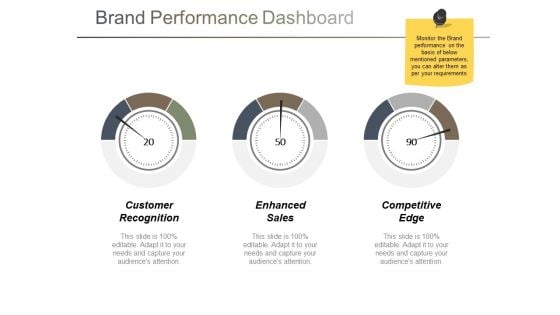
Brand Performance Dashboard Ppt PowerPoint Presentation Layouts Summary
This is a brand performance dashboard ppt powerpoint presentation layouts summary. This is a three stage process. The stages in this process are customer recognition, enhanced sales, competitive edge, dashboard, business.
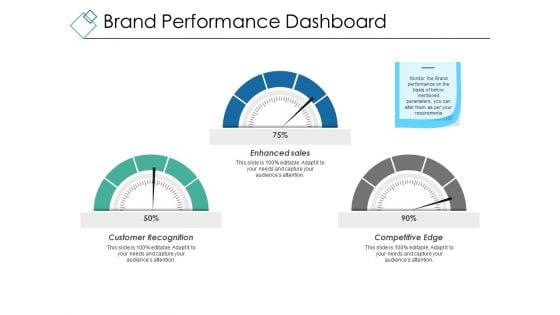
Brand Performance Dashboard Ppt PowerPoint Presentation Show Graphic Tips
This is a brand performance dashboard ppt powerpoint presentation show graphic tips. This is a three stage process. The stages in this process are customer recognition, enhanced sales, competitive edge, dashboard, business, percentage.
Brand Performance Dashboard Ppt PowerPoint Presentation Icon Microsoft
This is a brand performance dashboard ppt powerpoint presentation icon microsoft. This is a three stage process. The stages in this process are customer recognition, enhanced sales, competitive edge.
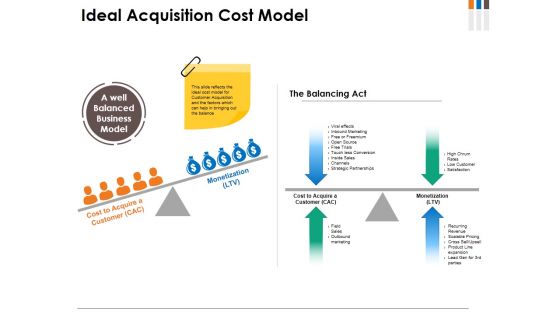
Ideal Acquisition Cost Model Ppt PowerPoint Presentation Gallery Mockup
This is a ideal acquisition cost model ppt powerpoint presentation gallery mockup. This is a two stage process. The stages in this process are the balancing act, monetization, cost to acquire a customer, field sales, outbound marketing.
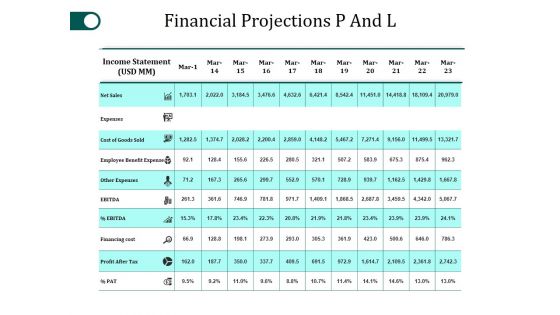
Financial Projections P And L Template 2 Ppt PowerPoint Presentation Portfolio Summary
This is a financial projections p and l template 2 ppt powerpoint presentation portfolio summary. This is a five stage process. The stages in this process are net sales, expenses, ebitda, financing cost, other expenses.
Financial Summary Ppt PowerPoint Presentation Icon Pictures
This is a financial summary ppt powerpoint presentation icon pictures. This is a seven stage process. The stages in this process are net sales, expenses, ebitda, profit after tax.
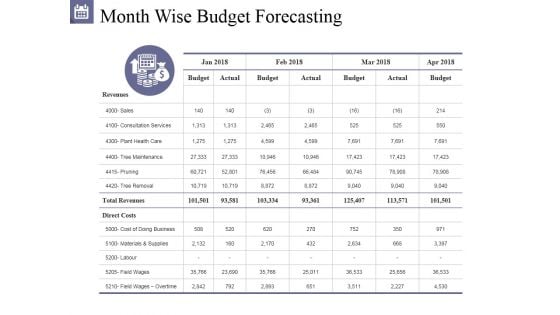
Month Wise Budget Forecasting Ppt PowerPoint Presentation Rules
This is a month wise budget forecasting ppt powerpoint presentation rules. This is a four stage process. The stages in this process are budget, actual, revenues, sales, direct costs.
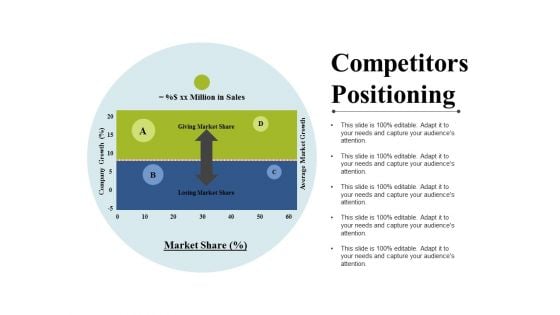
Competitors Positioning Ppt PowerPoint Presentation Styles Outfit
This is a competitors positioning ppt powerpoint presentation styles outfit. This is a two stage process. The stages in this process are company growth, million in sales, giving market share, losing market share, market share.
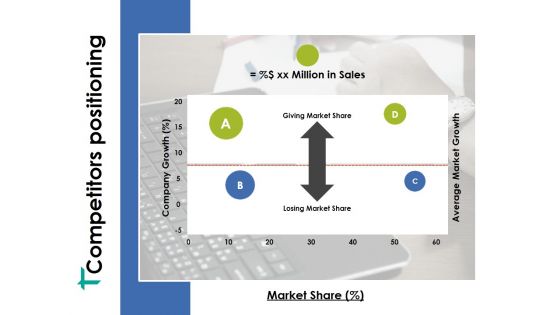
Competitors Positioning Ppt PowerPoint Presentation Ideas Portfolio
This is a competitors positioning ppt powerpoint presentation ideas portfolio. This is a four stage process. The stages in this process are million in sales, company growth, average market growth, market share, losing market share.
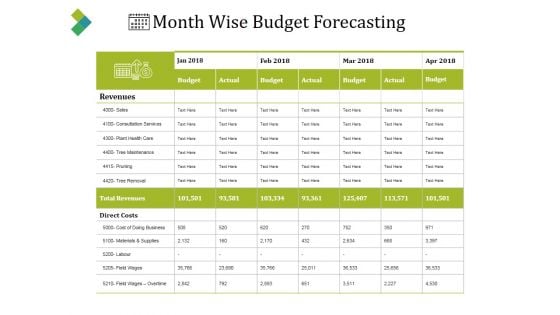
Month Wise Budget Forecasting Ppt PowerPoint Presentation Model Show
This is a month wise budget forecasting ppt powerpoint presentation model show. This is a four stage process. The stages in this process are budget, actual, revenue, sales, direct costs.
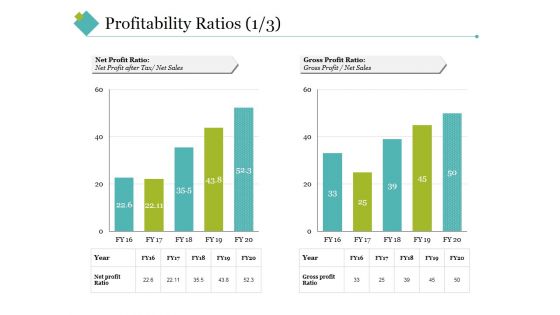
Profitability Ratios Template 2 Ppt PowerPoint Presentation Styles Example Topics
This is a profitability ratios template 2 ppt powerpoint presentation styles example topics. This is a two stage process. The stages in this process are net profit ratio, gross profit ratio, net sales, gross profit, year.
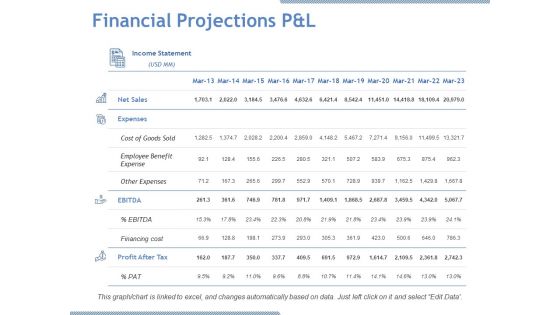
Financial Projections P And L Ppt PowerPoint Presentation Model Design Inspiration
This is a financial projections p and l ppt powerpoint presentation model design inspiration. This is a four stage process. The stages in this process are net sales, expenses, ebitda, profit after tax, cost of goods sold.
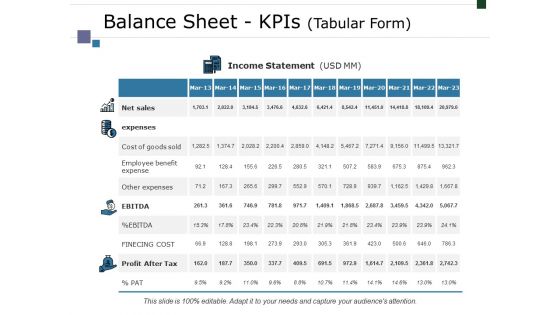
Balance Sheet Kpis Tabular Form Template 2 Ppt PowerPoint Presentation Summary Structure
This is a balance sheet kpis tabular form template 2 ppt powerpoint presentation summary structure. This is a four stage process. The stages in this process are net sales, expenses, ebitda, profit after tax, finecing cost.
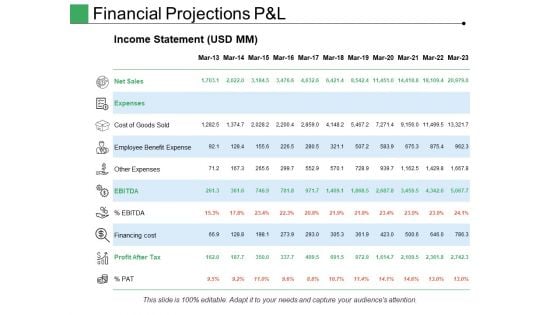
Financial Projections P And L Ppt PowerPoint Presentation Summary Backgrounds
This is a financial projections p and l ppt powerpoint presentation summary backgrounds. This is a four stage process. The stages in this process are net sales, expenses, other expenses, profit after tax, pat.
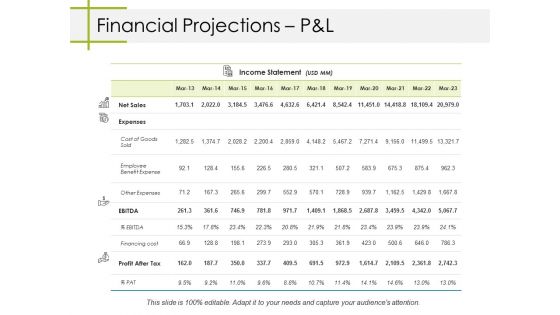
Financial Projections Pandl Ppt PowerPoint Presentation File Example File
This is a financial projections pandl ppt powerpoint presentation file example file. This is a four stage process. The stages in this process are net sales, expenses, ebitda, profit after tax, business.
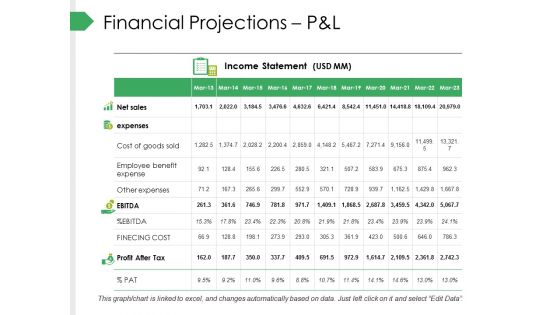
Financial Projections Pandl Ppt PowerPoint Presentation Visual Aids Professional
This is a financial projections pandl ppt powerpoint presentation visual aids professional. This is a four stage process. The stages in this process are net sales, expenses, ebitda, profit after tax, business.
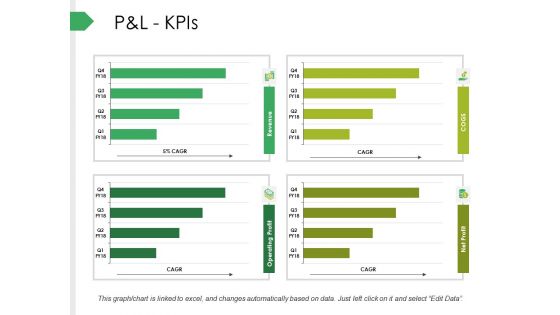
P And L Kpis Ppt PowerPoint Presentation Infographics Background
This is a p and l kpis ppt powerpoint presentation infographics background. This is a four stage process. The stages in this process are net sales, expenses, ebitda, profit before tax, profit after tax.
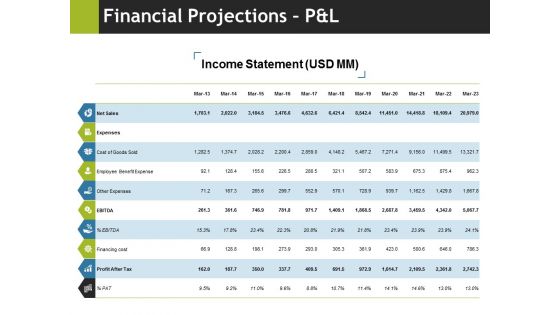
Financial Projections Pandl Ppt PowerPoint Presentation Portfolio Sample
This is a financial projections pandl ppt powerpoint presentation portfolio sample. This is a ten stage process. The stages in this process are net sales, expenses, cost of goods sold, employee benefit expense, other expenses.
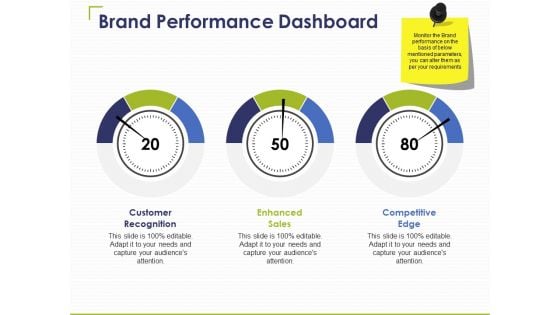
Brand Performance Dashboard Ppt PowerPoint Presentation Infographic Template Designs
This is a brand performance dashboard ppt powerpoint presentation infographic template designs. This is a three stage process. The stages in this process are customer recognition, enhanced sales, competitive edge.
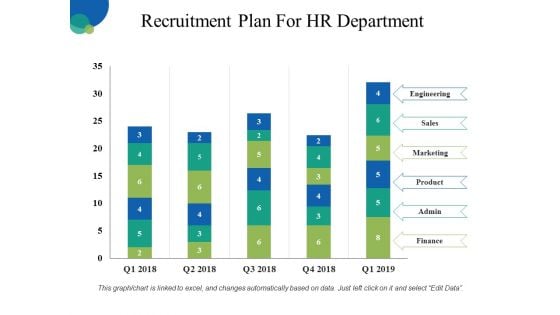
Recruitment Plan For HR Department Ppt PowerPoint Presentation Inspiration Layout Ideas
This is a recruitment plan for hr department ppt powerpoint presentation inspiration layout ideas. This is a five stage process. The stages in this process are engineering, sales, marketing, product, finance.
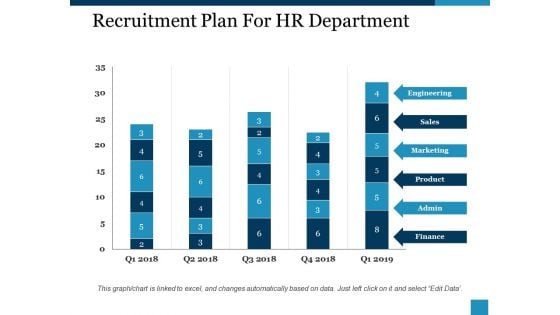
Recruitment Plan For Hr Department Ppt PowerPoint Presentation Show
This is a recruitment plan for hr department ppt powerpoint presentation show. This is a five stage process. The stages in this process are engineering, sales, marketing, product, finance.
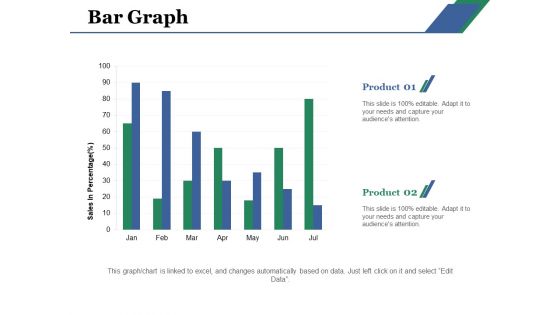
Bar Graph Ppt PowerPoint Presentation Infographic Template Demonstration
This is a bar graph ppt powerpoint presentation infographic template demonstration. This is a two stage process. The stages in this process are bar graph, product, sales, percentage, financial.
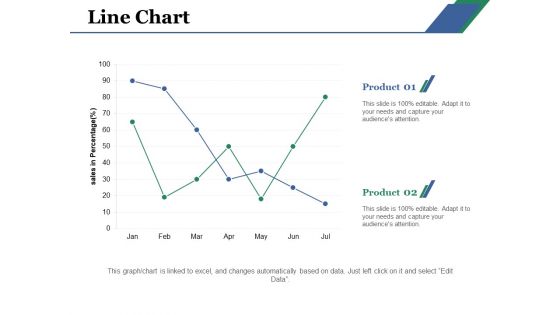
Line Chart Ppt PowerPoint Presentation Layouts Example File
This is a line chart ppt powerpoint presentation layouts example file. This is a two stage process. The stages in this process are line chart, product, business, sales, analysis.
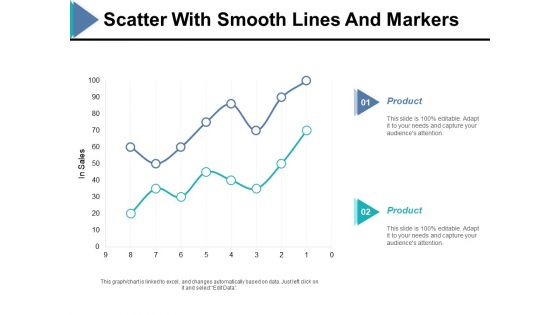
Scatter With Smooth Lines And Markers Ppt PowerPoint Presentation Ideas Example
This is a scatter with smooth lines and markers ppt powerpoint presentation ideas example. This is a two stage process. The stages in this process are in sales, finance, bar graph, product, business.
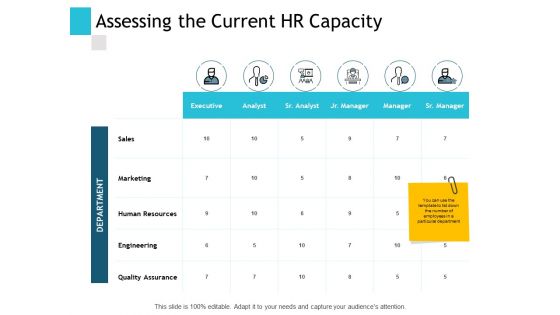
Assessing The Current HR Capacity Ppt PowerPoint Presentation File Clipart Images
This is a assessing the current hr capacity ppt powerpoint presentation file clipart images. This is a six stage process. The stages in this process are human resources, engineering, quality assurance, marketing, sales.

Core Team Financial Analytics Platform Investor Elevator Pitch Deck
This slide provides information regarding key leaders involved in investment decisions. Some of the designations include founder and chief executive officer, chief operating officer, vice president of sales, and vice president of operations. This Core Team Financial Analytics Platform Investor Elevator Pitch Deck from Slidegeeks makes it easy to present information on your topic with precision. It provides customization options, so you can make changes to the colors, design, graphics, or any other component to create a unique layout. It is also available for immediate download, so you can begin using it right away. Slidegeeks has done good research to ensure that you have everything you need to make your presentation stand out. Make a name out there for a brilliant performance. This slide provides information regarding key leaders involved in investment decisions. Some of the designations include founder and chief executive officer, chief operating officer, vice president of sales, and vice president of operations.
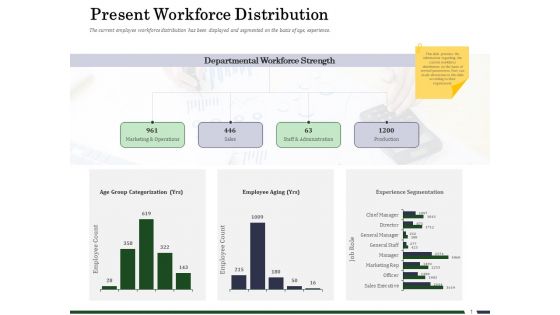
Human Resource Capability Enhancement Present Workforce Distribution Microsoft PDF
Deliver an awe inspiring pitch with this creative human resource capability enhancement present workforce distribution microsoft pdf bundle. Topics like marketing and operations, sales, staff and administration, production can be discussed with this completely editable template. It is available for immediate download depending on the needs and requirements of the user.

KPI Dashboard To Track Amazon Performance Ppt Styles Guidelines PDF
This slide provides information regarding dashboard to monitor Amazon performance. The KPIs include tracking of product sales, conversion rate, advertising spends, session, organic sales, etc. There are so many reasons you need a KPI Dashboard To Track Amazon Performance Ppt Styles Guidelines PDF. The first reason is you can not spend time making everything from scratch, Thus, Slidegeeks has made presentation templates for you too. You can easily download these templates from our website easily.
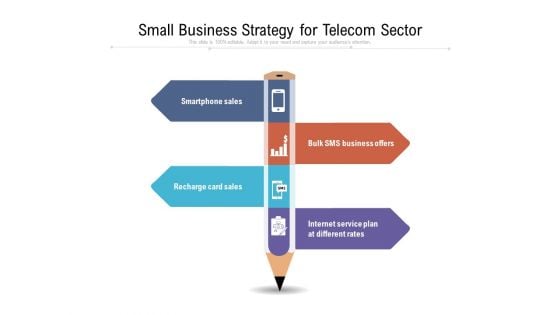
Small Business Strategy For Telecom Sector Ppt PowerPoint Presentation Gallery Background Designs PDF
Persuade your audience using this small business strategy for telecom sector ppt powerpoint presentation gallery background designs pdf. This PPT design covers four stages, thus making it a great tool to use. It also caters to a variety of topics including smartphone sales, business offers, recharge card sales. Download this PPT design now to present a convincing pitch that not only emphasizes the topic but also showcases your presentation skills.
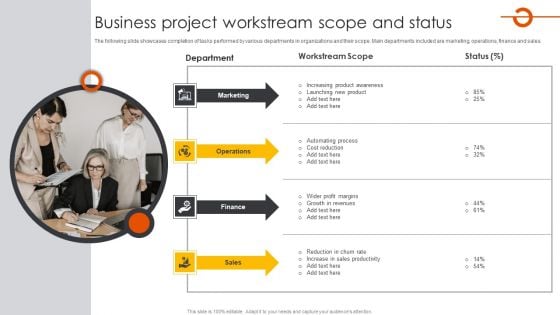
Business Project Workstream Scope And Status Ideas PDF
The following slide showcases completion of tasks performed by various departments in organizations and their scope. Main departments included are marketing, operations, finance and sales. Persuade your audience using this Business Project Workstream Scope And Status Ideas PDF. This PPT design covers four stages, thus making it a great tool to use. It also caters to a variety of topics including Marketing, Operations, Finance, Sales. Download this PPT design now to present a convincing pitch that not only emphasizes the topic but also showcases your presentation skills.
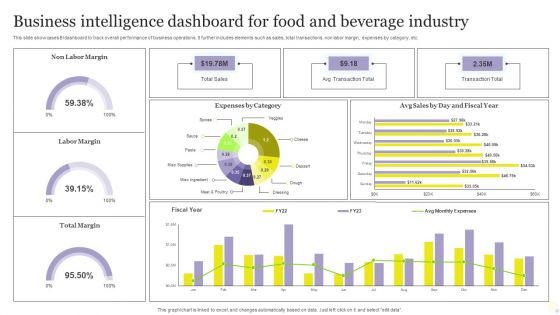
Business Intelligence Dashboard For Food And Beverage Industry Diagrams PDF
This slide showcases BI dashboard to track overall performance of business operations. It further includes elements such as sales, total transactions, non labor margin, expenses by category, etc. Pitch your topic with ease and precision using this Business Intelligence Dashboard For Food And Beverage Industry Diagrams PDF. This layout presents information on Expenses, Sales, Business Intelligence Dashboard. It is also available for immediate download and adjustment. So, changes can be made in the color, design, graphics or any other component to create a unique layout.

Rasci Matrix Manufacturing Control Ppt Summary File Formats PDF
Deliver and pitch your topic in the best possible manner with this rasci matrix manufacturing control ppt summary file formats pdf. Use them to share invaluable insights on sales, process, manufacturing, transportation process and impress your audience. This template can be altered and modified as per your expectations. So, grab it now.
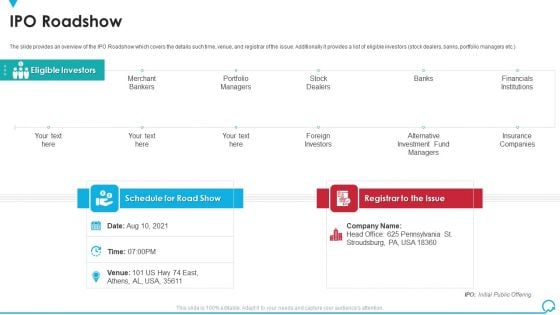
IPO Roadshow Deal Pitchbook IPO Slides PDF
The slide provides an overview of the IPO Roadshow which covers the details such time, venue, and registrar of the issue. Additionally it provides a list of eligible investors stock dealers, banks, portfolio managers etc. Deliver and pitch your topic in the best possible manner with this ipo roadshow deal pitchbook ipo slides pdf. Use them to share invaluable insights on investment, insurance companies, financials, stock, portfolio and impress your audience. This template can be altered and modified as per your expectations. So, grab it now.

Monthly Organizational Review Ppt PowerPoint Presentation Complete Deck With Slides
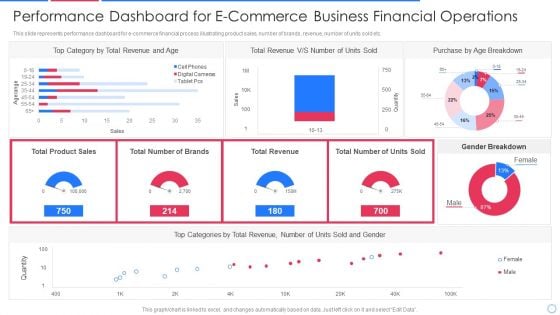
Performance Dashboard For E Commerce Business Financial Operations Infographics PDF
This slide represents performance dashboard for e-commerce financial process illustrating product sales, number of brands, revenue, number of units sold etc.Pitch your topic with ease and precision using this performance dashboard for e commerce business financial operations infographics pdf This layout presents information on category by total revenue, total revenue, purchase by age breakdown It is also available for immediate download and adjustment. So, changes can be made in the color, design, graphics or any other component to create a unique layout.
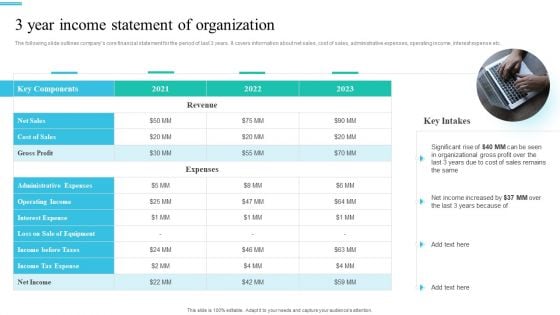
Monetary Planning And Evaluation Guide 3 Year Income Statement Of Organization Ppt File Vector PDF
The following slide outlines companys core financial statement for the period of last 3 years. It covers information about net sales, cost of sales, administrative expenses, operating income, interest expense etc. Create an editable Monetary Planning And Evaluation Guide 3 Year Income Statement Of Organization Ppt File Vector PDF that communicates your idea and engages your audience. Whether you are presenting a business or an educational presentation, pre-designed presentation templates help save time. Monetary Planning And Evaluation Guide 3 Year Income Statement Of Organization Ppt File Vector PDF is highly customizable and very easy to edit, covering many different styles from creative to business presentations. Slidegeeks has creative team members who have crafted amazing templates. So, go and get them without any delay.
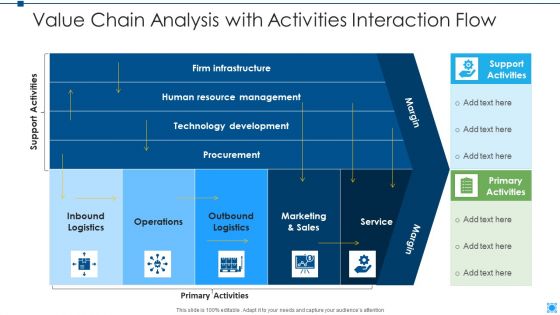
Value Chain Analysis With Activities Interaction Flow Structure PDF
Pitch your topic with ease and precision using this value chain analysis with activities interaction flow structure pdf. This layout presents information on inbound logistics, operations, outbound logistics, marketing and sales, service. It is also available for immediate download and adjustment. So, changes can be made in the color, design, graphics or any other component to create a unique layout.
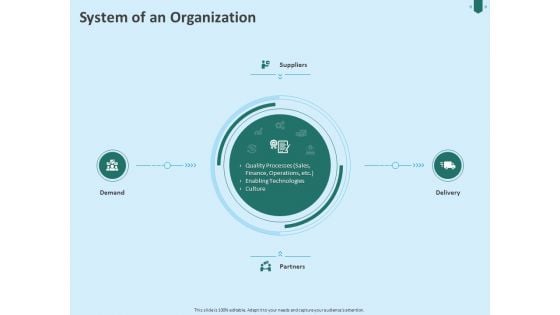
Developing Organization Partner Strategy System Of An Organization Ppt Styles Guidelines PDF
Presenting this set of slides with name developing organization partner strategy system of an organization ppt styles guidelines pdf. This is a four stage process. The stages in this process are suppliers, demand, partners, delivery, quality processes sales, finance, operations, enabling technologies, culture. This is a completely editable PowerPoint presentation and is available for immediate download. Download now and impress your audience.
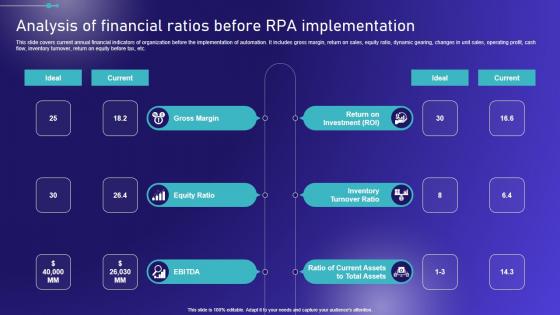
Analysis Of Financial Ratios Before RPA Embracing Robotic Process Diagrams PDF
This slide covers current annual financial indicators of organization before the implementation of automation. It includes gross margin, return on sales, equity ratio, dynamic gearing, changes in unit sales, operating profit, cash flow, inventory turnover, return on equity before tax, etc. Create an editable Analysis Of Financial Ratios Before RPA Embracing Robotic Process Diagrams PDF that communicates your idea and engages your audience. Whether you are presenting a business or an educational presentation, pre-designed presentation templates help save time. Analysis Of Financial Ratios Before RPA Embracing Robotic Process Diagrams PDF is highly customizable and very easy to edit, covering many different styles from creative to business presentations. Slidegeeks has creative team members who have crafted amazing templates. So, go and get them without any delay. This slide covers current annual financial indicators of organization before the implementation of automation. It includes gross margin, return on sales, equity ratio, dynamic gearing, changes in unit sales, operating profit, cash flow, inventory turnover, return on equity before tax, etc.


 Continue with Email

 Home
Home


