Sales Metrics
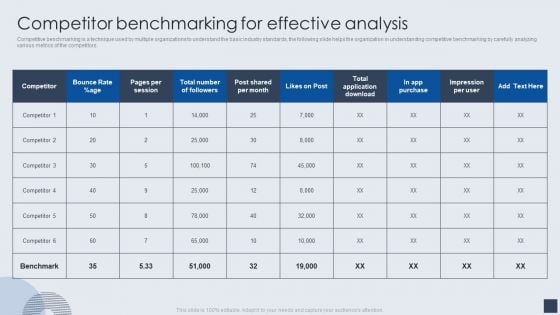
Implementing Marketing Mix Strategy To Enhance Overall Performance Competitor Benchmarking For Effective Analysis Themes PDF
Competitive benchmarking is a technique used by multiple organizations to understand the basic industry standards, the following slide helps the organization in understanding competitive benchmarking by carefully analyzing various metrics of the competitors. Deliver and pitch your topic in the best possible manner with this Implementing Marketing Mix Strategy To Enhance Overall Performance Competitor Benchmarking For Effective Analysis Themes PDF. Use them to share invaluable insights on Purchase, Bounce Rate, Effective Analysis and impress your audience. This template can be altered and modified as per your expectations. So, grab it now.
Consumer Journey Mapping Techniques Dashboard For Tracking Digital Content Performance Clipart PDF
This slide covers the KPI dashboard for analyzing online content. It includes metrics such as blog visitors, pageviews, newsletter conversion rate, new signups, new customers, etc. Showcasing this set of slides titled Consumer Journey Mapping Techniques Dashboard For Tracking Digital Content Performance Clipart PDF. The topics addressed in these templates are Purchase Amount, Customers, Tracking Digital Content Performance. All the content presented in this PPT design is completely editable. Download it and make adjustments in color, background, font etc. as per your unique business setting.
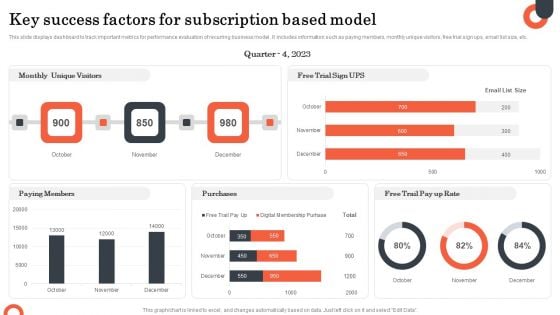
Key Success Factors For Subscription Based Model Formats PDF
This slide displays dashboard to track important metrics for performance evaluation of recurring business model . It includes information such as paying members, monthly unique visitors, free trial sign ups, email list size, etc. Showcasing this set of slides titled Key Success Factors For Subscription Based Model Formats PDF. The topics addressed in these templates are Monthly Unique Visitors, Purchases, Paying Members. All the content presented in this PPT design is completely editable. Download it and make adjustments in color, background, font etc. as per your unique business setting.

KPI Analytics Dashboard With Sourcing Raw Material Cycle Time Inspiration PDF
Following slide shows the key performance indicator KPI dashboard which will assist corporates to effectively monitor procurement process. The metrics are number of suppliers, contract compliance, average procurement cycle time, etc. Showcasing this set of slides titled KPI Analytics Dashboard With Sourcing Raw Material Cycle Time Inspiration PDF. The topics addressed in these templates are Kpi Analytics Dashboard, Sourcing Raw Material, Cycle Time. All the content presented in this PPT design is completely editable. Download it and make adjustments in color, background, font etc. as per your unique business setting.
Logistics Management Strategy Effectiveness Tracker Professional PDF
This slide covers the key performance indicator for tracking the success of a new logistics management strategy. It includes metrics such as shipping time, order accuracy, lead time, capacity utilization, customer backorder rate, inventory turnover, etc. Showcasing this set of slides titled logistics management strategy effectiveness tracker professional pdf. The topics addressed in these templates are supply management, order management, inventory management. All the content presented in this PPT design is completely editable. Download it and make adjustments in color, background, font etc. as per your unique business setting.
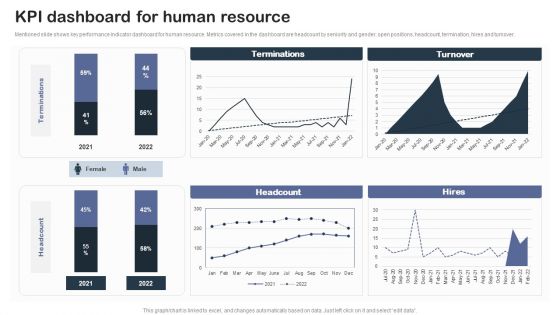
Staff Succession Planning And Development Strategy Kpi Dashboard For Human Clipart PDF
Mentioned slide shows key performance indicator dashboard for human resource. Metrics covered in the dashboard are headcount by seniority and gender, open positions, headcount, termination, hires and turnover.If your project calls for a presentation, then Slidegeeks is your go-to partner because we have professionally designed, easy-to-edit templates that are perfect for any presentation. After downloading, you can easily edit Staff Succession Planning And Development Strategy Kpi Dashboard For Human Clipart PDF and make the changes accordingly. You can rearrange slides or fill them with different images. Check out all the handy templates.
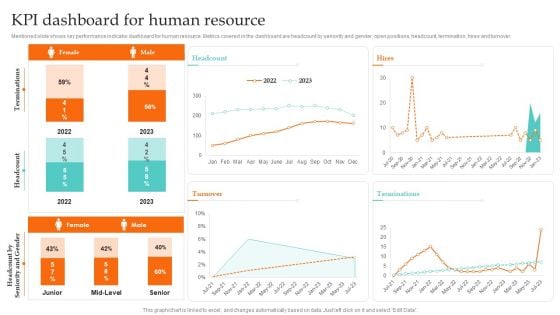
Kpi Dashboard For Human Resource Ultimate Guide To Employee Succession Planning Topics PDF
Mentioned slide shows key performance indicator dashboard for human resource. Metrics covered in the dashboard are headcount by seniority and gender, open positions, headcount, termination, hires and turnover.Present like a pro with Kpi Dashboard For Human Resource Ultimate Guide To Employee Succession Planning Topics PDF Create beautiful presentations together with your team, using our easy-to-use presentation slides. Share your ideas in real-time and make changes on the fly by downloading our templates. So whether you are in the office, on the go, or in a remote location, you can stay in sync with your team and present your ideas with confidence. With Slidegeeks presentation got a whole lot easier. Grab these presentations today.
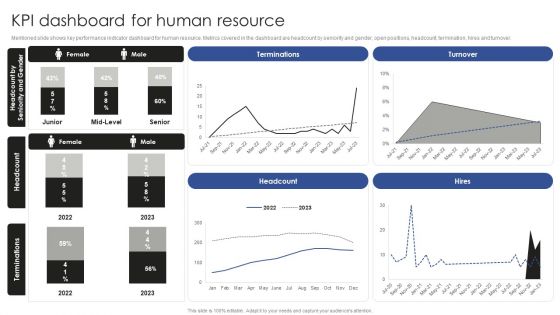
Talent Administration And Succession KPI Dashboard For Human Resource Rules PDF
Mentioned slide shows key performance indicator dashboard for human resource. Metrics covered in the dashboard are headcount by seniority and gender, open positions, headcount, termination, hires and turnover. If your project calls for a presentation, then Slidegeeks is your go-to partner because we have professionally designed, easy-to-edit templates that are perfect for any presentation. After downloading, you can easily edit Talent Administration And Succession KPI Dashboard For Human Resource Rules PDF and make the changes accordingly. You can rearrange slides or fill them with different images. Check out all the handy templates
Logistics Management Strategy Effectiveness Tracking Sheet Introduction PDF
This slide covers the key performance indicator for tracking impact of new logistics management strategy. It includes metrics such as shipping time, order accuracy, lead time, capacity utilization, customer backorder rate, inventory turnover, etc. If your project calls for a presentation, then Slidegeeks is your go-to partner because we have professionally designed, easy-to-edit templates that are perfect for any presentation. After downloading, you can easily edit Logistics Management Strategy Effectiveness Tracking Sheet Introduction PDF and make the changes accordingly. You can rearrange slides or fill them with different images. Check out all the handy templates
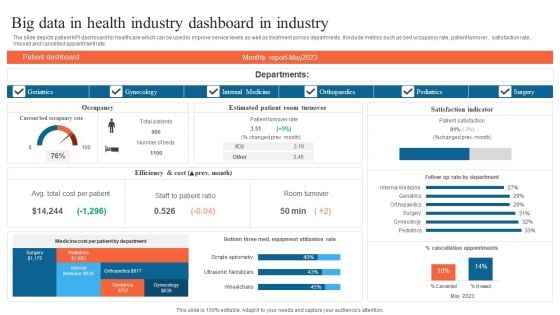
Big Data In Health Industry Dashboard In Industry Summary PDF
The slide depicts patient KPI dashboard for healthcare which can be used to improve service levels as well as treatment across departments. It include metrics such as bed occupancy rate, patient turnover, satisfaction rate, missed and cancelled appointment rate. Showcasing this set of slides titled Big Data In Health Industry Dashboard In Industry Summary PDF. The topics addressed in these templates are Geriatrics, Gynecology, Internal Medicine. All the content presented in this PPT design is completely editable. Download it and make adjustments in color, background, font etc. as per your unique business setting.
Techniques For Effective Supply Chain Management Logistics Management Strategy Effectiveness Tracking Sheet Demonstration PDF
This slide covers the key performance indicator for tracking impact of new logistics management strategy. It includes metrics such as shipping time, order accuracy, lead time, capacity utilization, customer backorder rate, inventory turnover, etc. There are so many reasons you need a Techniques For Effective Supply Chain Management Logistics Management Strategy Effectiveness Tracking Sheet Demonstration PDF. The first reason is you cannot spend time making everything from scratch, Thus, Slidegeeks has made presentation templates for you too. You can easily download these templates from our website easily.

KPI Dashboard To Track Marketing Return On Investment Performance Background PDF
This slide shows key performance indicators dashboard to measure the performs of marketing campaign. It includes metrics such as campaign score, standard customers, growth rate, campaign income, etc. Showcasing this set of slides titled KPI Dashboard To Track Marketing Return On Investment Performance Background PDF. The topics addressed in these templates are Customer Distribution, Standard Customers, Growth Rate. All the content presented in this PPT design is completely editable. Download it and make adjustments in color, background, font etc. as per your unique business setting.
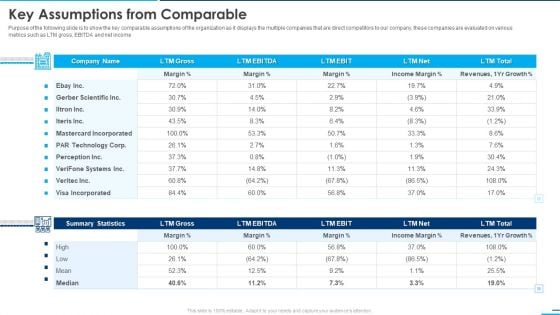
Square Company Investor Key Assumptions From Comparable Ppt Show Example File PDF
Purpose of the following slide is to show the key comparable assumptions of the organization as it displays the multiple companies that are direct competitors to our company, these companies are evaluated on various metrics such as LTM gross, EBITDA and net income. Deliver and pitch your topic in the best possible manner with this square company investor key assumptions from comparable ppt show example file pdf. Use them to share invaluable insights on technology, systems, margin and impress your audience. This template can be altered and modified as per your expectations. So, grab it now.
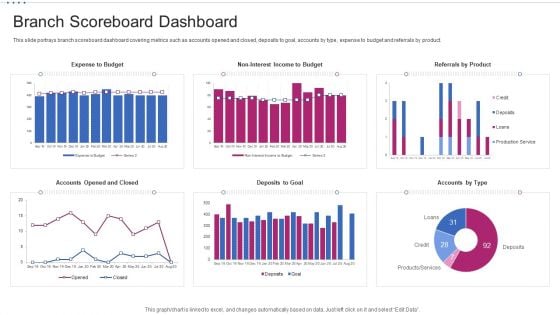
M Banking System Improving Consumer Branch Scoreboard Dashboard Demonstration PDF
This slide portrays branch scoreboard dashboard covering metrics such as accounts opened and closed, deposits to goal, accounts by type, expense to budget and referrals by product. Deliver an awe inspiring pitch with this creative m banking system improving consumer branch scoreboard dashboard demonstration pdf bundle. Topics like expense to budget, no interest income to budget, referrals by product, deposits to goal, accounts opened and closed can be discussed with this completely editable template. It is available for immediate download depending on the needs and requirements of the user.
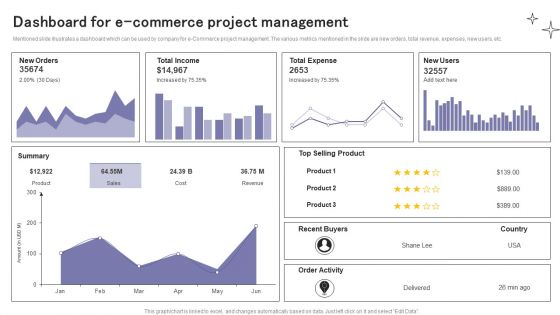
Dashboard For E Commerce Project Management Ppt Ideas Design Inspiration PDF
Mentioned slide illustrates a dashboard which can be used by company for e-Commerce project management. The various metrics mentioned in the slide are new orders, total revenue, expenses, new users, etc. Showcasing this set of slides titled Dashboard For E Commerce Project Management Ppt Ideas Design Inspiration PDF. The topics addressed in these templates are New Orders, Total Income, Total Expense. All the content presented in this PPT design is completely editable. Download it and make adjustments in color, background, font etc. as per your unique business setting.
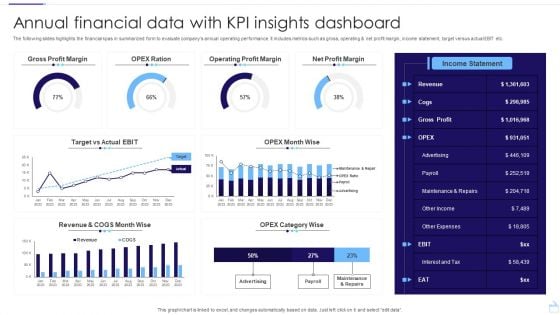
Annual Financial Data With KPI Insights Dashboard Structure PDF
The following slides highlights the financial kpas in summarized form to evaluate companys annual operating performance. It includes metrics such as gross, operating and net profit margin, income statement, target versus actual EBIT etc. Pitch your topic with ease and precision using this Annual Financial Data With KPI Insights Dashboard Structure PDF. This layout presents information on Gross Profit Margin, Operating Profit Margin, Net Profit Margin. It is also available for immediate download and adjustment. So, changes can be made in the color, design, graphics or any other component to create a unique layout.
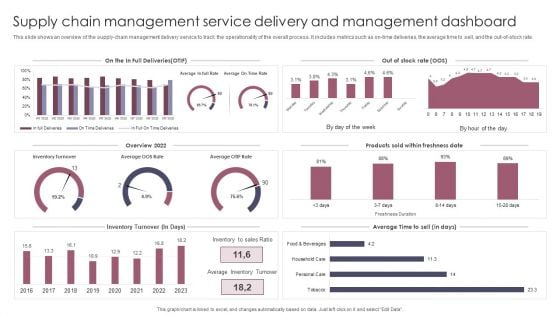
Supply Chain Management Service Delivery And Management Dashboard Guidelines PDF
This slide shows an overview of the supply chain management delivery service to track the operationality of the overall process. It includes metrics such as on time deliveries, the average time to sell, and the out of stock rate. Pitch your topic with ease and precision using this Supply Chain Management Service Delivery And Management Dashboard Guidelines PDF. This layout presents information on Supply Chain Management, Service Delivery, Management Dashboard. It is also available for immediate download and adjustment. So, changes can be made in the color, design, graphics or any other component to create a unique layout.
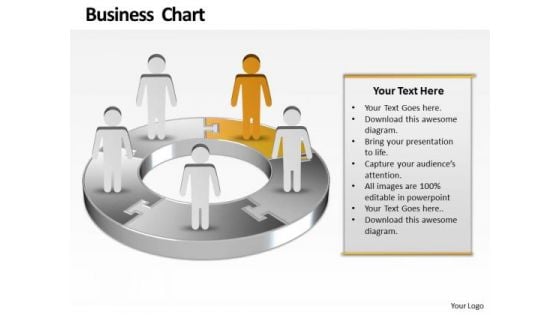
Ppt Yellow Men Standing On Business PowerPoint Presentation Pie Chart Templates
PPT yellow men standing on business powerpoint presentation pie chart Templates-Use this Circular Arrow diagram to show activities that are related to the business plan metrics and monitor the results to determine if the business plan is proceeding as planned.-PPT yellow men standing on business powerpoint presentation pie chart Templates-3d, arrow, background, blue, chart, circle, circular, clipart, colorful, connection, continuity, cycle, cyclic, diagram, direction, flow, graph, icon, illustration, isolated, loop, motion, process, progress, recycle, ring, round, step, sticker, symbol, teamwork, template, turn, vector Deal with matters in an equitable way. Reach a settlement with the help of our Ppt Yellow Men Standing On Business PowerPoint Presentation Pie Chart Templates.
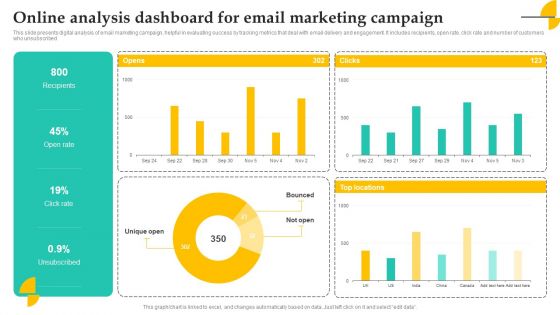
Online Analysis Dashboard For Email Marketing Campaign Elements PDF
This slide presents digital analysis of email marketing campaign, helpful in evaluating success by tracking metrics that deal with email delivery and engagement. It includes recipients, open rate, click rate and number of customers who unsubscribed Showcasing this set of slides titled Online Analysis Dashboard For Email Marketing Campaign Elements PDF. The topics addressed in these templates are Recipients, Open Rate, Campaign. All the content presented in this PPT design is completely editable. Download it and make adjustments in color, background, font etc. as per your unique business setting.
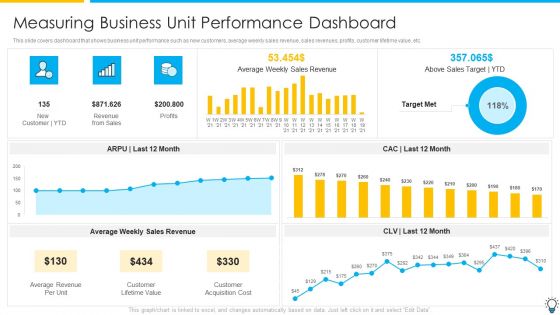
Assuring Management In Product Innovation To Enhance Processes Measuring Business Unit Performance Dashboard Inspiration PDF
This slide covers dashboard that shows business unit performance such as new customers, average weekly sales revenue, sales revenues, profits, customer lifetime value, etc.Deliver an awe inspiring pitch with this creative assuring management in product innovation to enhance processes measuring business unit performance dashboard inspiration pdf bundle. Topics like average weekly sales revenue, customer lifetime value, customer acquisition cost can be discussed with this completely editable template. It is available for immediate download depending on the needs and requirements of the user.
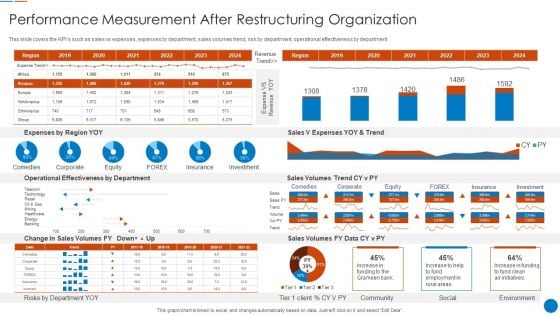
Organizational Restructuring Process Performance Measurement After Restructuring Organization Download PDF
This slide covers the KPIs such as sales vs expenses, expenses by department, sales volumes trend, risk by department, operational effectiveness by department Deliver an awe inspiring pitch with this creative Organizational Restructuring Process Performance Measurement After Restructuring Organization Download PDF bundle. Topics like Operational Effectiveness Department, Expenses By Region, Sales Volumes can be discussed with this completely editable template. It is available for immediate download depending on the needs and requirements of the user.
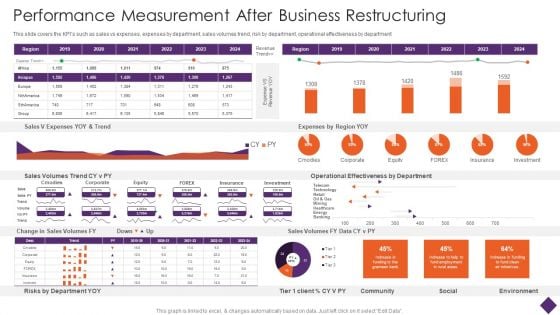
Business Restructuring Performance Measurement After Business Restructuring Themes PDF
This slide covers the KPIs such as sales vs expenses, expenses by department, sales volumes trend, risk by department, operational effectiveness by department. Deliver an awe inspiring pitch with this creative Business Restructuring Performance Measurement After Business Restructuring Themes PDF bundle. Topics like Sales V Expenses, YOY And Trend, Expenses Region YOY can be discussed with this completely editable template. It is available for immediate download depending on the needs and requirements of the user.
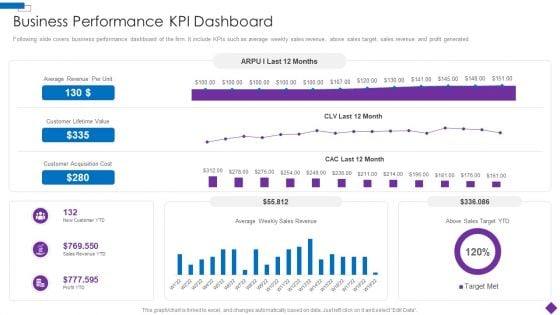
Introducing A New Product To The Market Business Performance KPI Dashboard Brochure PDF
Following slide covers business performance dashboard of the firm. It include KPIs such as average weekly sales revenue, above sales target, sales revenue and profit generated.Deliver and pitch your topic in the best possible manner with this Introducing A New Product To The Market Business Performance KPI Dashboard Brochure PDF Use them to share invaluable insights on Business Performance KPI Dashboard and impress your audience. This template can be altered and modified as per your expectations. So, grab it now.
Successful Brand Development Plan Business Performance Measuring KPI Dashboard Icons PDF
Following slide covers business performance dashboard of the firm. It include KPIs such as average weekly sales revenue, above sales target, sales revenue and profit generated.Deliver and pitch your topic in the best possible manner with this successful brand development plan business performance measuring kpi dashboard icons pdf Use them to share invaluable insights on average revenue, customer lifetime value, customer acquisition cost and impress your audience. This template can be altered and modified as per your expectations. So, grab it now.
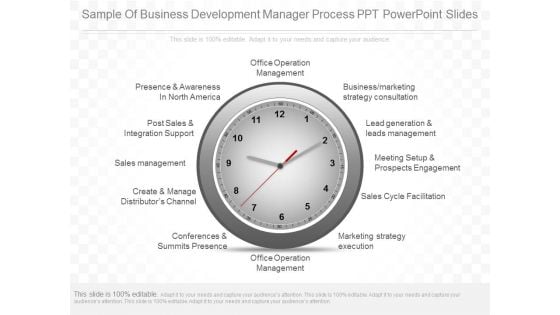
Sample Of Business Development Manager Process Ppt Powerpoint Slides
This is a sample of business development manager process ppt powerpoint slides. This is a one stage process. The stages in this process are presence and awareness in north america, post sales and integration support, sales management, create and manage distributor channel, conferences and summits presence, office operation management, marketing strategy execution, sales cycle facilitation, meeting setup and prospects engagement, lead generation and leads management, business marketing strategy consultation, office operation management.
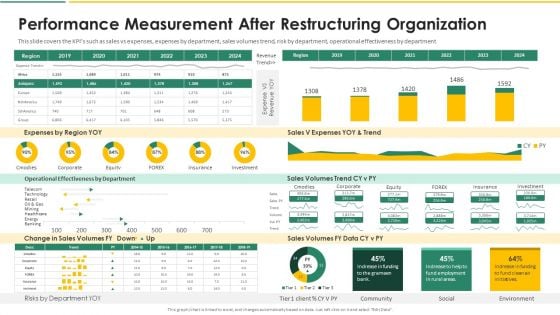
Organization Chart And Corporate Model Transformation Performance Measurement After Slides PDF
This slide covers the KPIs such as sales vs expenses, expenses by department, sales volumes trend, risk by department, operational effectiveness by department. Deliver and pitch your topic in the best possible manner with this organization chart and corporate model transformation performance measurement after slides pdf. Use them to share invaluable insights on operational effectiveness by department, expenses by region yoy, sales volumes trend and impress your audience. This template can be altered and modified as per your expectations. So, grab it now.
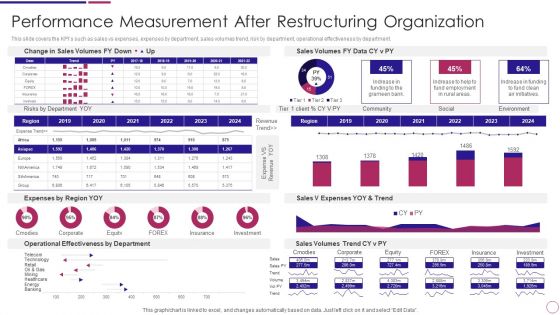
Performance Measurement After Restructuring Organization Ppt PowerPoint Presentation File Structure PDF
This slide covers the KPIs such as sales vs expenses, expenses by department, sales volumes trend, risk by department, operational effectiveness by department. Deliver an awe inspiring pitch with this creative Performance Measurement After Restructuring Organization Ppt PowerPoint Presentation File Structure PDF bundle. Topics like Sales Volumes, Operational Effectiveness, Expense Trend can be discussed with this completely editable template. It is available for immediate download depending on the needs and requirements of the user.
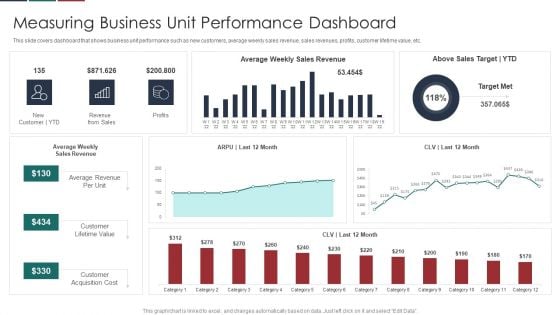
Deliver Efficiency Innovation Measuring Business Unit Performance Dashboard Background PDF
This slide covers dashboard that shows business unit performance such as new customers, average weekly sales revenue, sales revenues, profits, customer lifetime value, etc. Deliver an awe inspiring pitch with this creative Deliver Efficiency Innovation Measuring Business Unit Performance Dashboard Background PDF bundle. Topics like Customer Lifetime Value, Customer Acquisition Cost, Average Revenue Per Unit, Above Sales Target YTD can be discussed with this completely editable template. It is available for immediate download depending on the needs and requirements of the user.
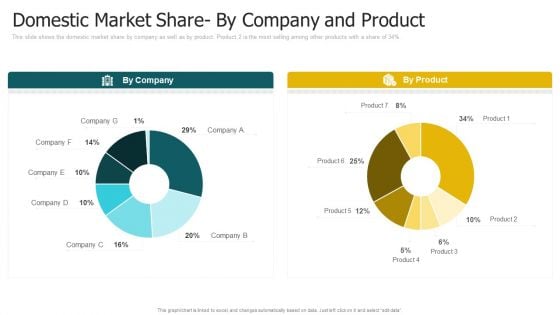
Domestic Market Share By Company And Product Brochure PDF
Following slide illustrates sales performance of the firm both yearly as well as quarterly. Number of units sold in 2020 are 61,213. Deliver and pitch your topic in the best possible manner with this domestic market share by company and product brochure pdf. Use them to share invaluable insights on yearly sales performance, quarterly sales performance and impress your audience. This template can be altered and modified as per your expectations. So, grab it now.
Key Performance Indicators For Smarketing Ppt Icon Graphic Images PDF
This slide shows various KPIs which can be used to measure marketing and sales alignment. These are overall revenue, sales cycle length, marketing qualified leads, etc. Presenting Key Performance Indicators For Smarketing Ppt Icon Graphic Images PDF to dispense important information. This template comprises one stages. It also presents valuable insights into the topics including KPIs, Overall Revenue, Sales Cycle Length. This is a completely customizable PowerPoint theme that can be put to use immediately. So, download it and address the topic impactfully.
Table Of Contents For Go To Market Approach For New Product Icons PDF
Presenting Table Of Contents For Go To Market Approach For New Product Icons PDF to provide visual cues and insights. Share and navigate important information on one stage that need your due attention. This template can be used to pitch topics like Annual Sales Highlights, Analyzing Sales Performance, Determining Sales Revenue In addtion, this PPT design contains high resolution images, graphics, etc, that are easily editable and available for immediate download.
Tactical Planning And Analyzing Organizational Goals Icon Infographics PDF
This slide defines the dashboard for analyzing the sales key performance indicators KPIs. It includes information related to the number of sales, revenue, profit, and cost. Showcasing this set of slides titled Tactical Planning And Analyzing Organizational Goals Icon Infographics PDF. The topics addressed in these templates are Cost Breakdown, Sales Revenue, Accumulated Revenue. All the content presented in this PPT design is completely editable. Download it and make adjustments in color, background, font etc. as per your unique business setting.
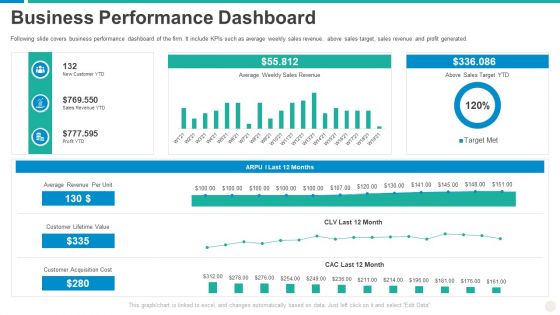
Establishing Successful Brand Strategy To Captivate Consumers Business Performance Dashboard Microsoft PDF
Following slide covers business performance dashboard of the firm. It include KPIs such as average weekly sales revenue, above sales target, sales revenue and profit generated. Deliver an awe inspiring pitch with this creative establishing successful brand strategy to captivate consumers business performance dashboard microsoft pdf bundle. Topics like customer acquisition cost, customer lifetime value, average revenue per unit can be discussed with this completely editable template. It is available for immediate download depending on the needs and requirements of the user.
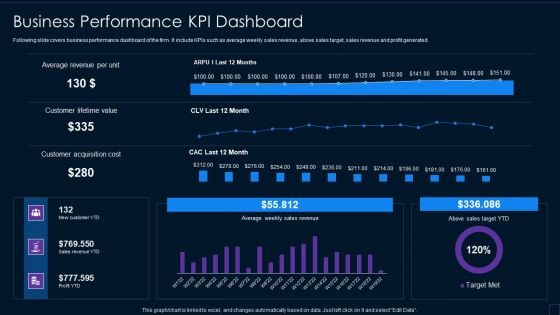
Brand Development Manual Business Performance KPI Dashboard Background PDF
Following slide covers business performance dashboard of the firm. It include KPIs such as average weekly sales revenue, above sales target, sales revenue and profit generated.Deliver an awe inspiring pitch with this creative Brand Development Manual Business Performance KPI Dashboard Background PDF bundle. Topics like Business Performance KPI Dashboard can be discussed with this completely editable template. It is available for immediate download depending on the needs and requirements of the user.
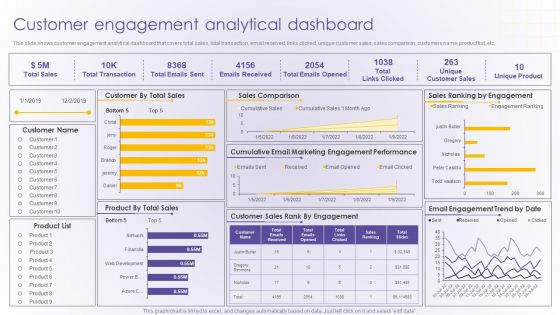
Customer Engagement Analytical Dashboard Developing Online Consumer Engagement Program Professional PDF
This slide shows customer engagement analytical dashboard that covers total sales, total transaction, email received, links clicked, unique customer sales, sales comparison, customers name, product list, etc.Deliver and pitch your topic in the best possible manner with this Customer Engagement Analytical Dashboard Developing Online Consumer Engagement Program Professional PDF. Use them to share invaluable insights on Cumulative Email, Marketing Engagement, Performance and impress your audience. This template can be altered and modified as per your expectations. So, grab it now.
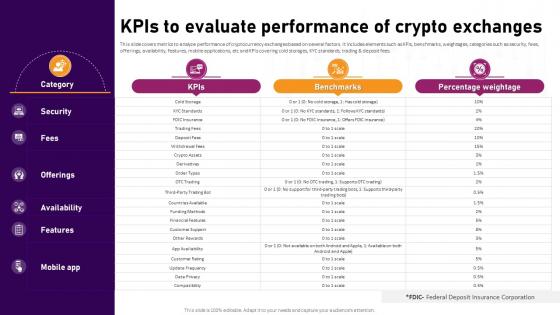
KPIs To Evaluate Performance Of Crypto Exchanges Complete Roadmap To Blockchain BCT SS V
This slide covers metrics to analyze performance of cryptocurrency exchanges based on several factors. It includes elements such as KPIs, benchmarks, weightages, categories such as security, fees, offerings, availability, features, mobile applications, etc and KPIs covering cold storages, KYC standards, trading and deposit fees. Do you know about Slidesgeeks KPIs To Evaluate Performance Of Crypto Exchanges Complete Roadmap To Blockchain BCT SS V These are perfect for delivering any kind od presentation. Using it, create PowerPoint presentations that communicate your ideas and engage audiences. Save time and effort by using our pre-designed presentation templates that are perfect for a wide range of topic. Our vast selection of designs covers a range of styles, from creative to business, and are all highly customizable and easy to edit. Download as a PowerPoint template or use them as Google Slides themes. This slide covers metrics to analyze performance of cryptocurrency exchanges based on several factors. It includes elements such as KPIs, benchmarks, weightages, categories such as security, fees, offerings, availability, features, mobile applications, etc and KPIs covering cold storages, KYC standards, trading and deposit fees.

KPI Dashboard To Measure Brand Marketing Performance Ultimate Guide Implementing Demonstration Pdf
Mentioned slide illustrates KPI dashboard that can be used by organizations to track the performance of their brand performance. Brand, advertising and purchase are the metrics covered in the dashboard. Presenting this PowerPoint presentation, titled KPI Dashboard To Measure Brand Marketing Performance Ultimate Guide Implementing Demonstration Pdf with topics curated by our researchers after extensive research. This editable presentation is available for immediate download and provides attractive features when used. Download now and captivate your audience. Presenting this KPI Dashboard To Measure Brand Marketing Performance Ultimate Guide Implementing Demonstration Pdf Our researchers have carefully researched and created these slides with all aspects taken into consideration. This is a completely customizable KPI Dashboard To Measure Brand Marketing Performance Ultimate Guide Implementing Demonstration Pdf that is available for immediate downloading. Download now and make an impact on your audience. Highlight the attractive features available with our PPTs. Mentioned slide illustrates KPI dashboard that can be used by organizations to track the performance of their brand performance. Brand, advertising and purchase are the metrics covered in the dashboard.
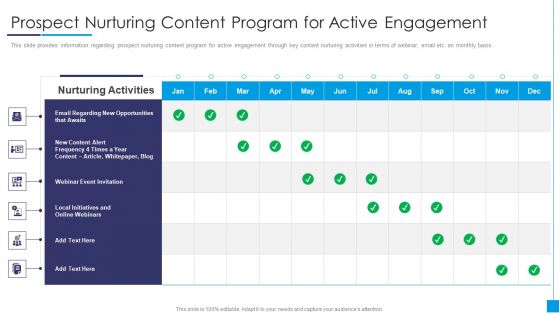
B2B Marketing Content Administration Playbook Prospect Nurturing Content Clipart PDF
This slide provides information regarding sales management activities tracking dashboard to measure closed business, sales pipeline, sales activity by sales rep, month over month growth, forecast by month, etc.Deliver and pitch your topic in the best possible manner with this b2b marketing content administration playbook prospect nurturing content clipart pdf Use them to share invaluable insights on regarding new opportunities, webinar event invitation, local initiatives and impress your audience. This template can be altered and modified as per your expectations. So, grab it now.
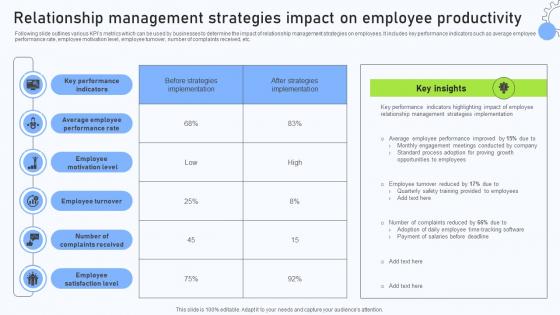
Relationship Management Strategies Impact On Employee Productivity
Following slide outlines various KPIs metrics which can be used by businesses to determine the impact of relationship management strategies on employees. It includes key performance indicators such as average employee performance rate, employee motivation level, employee turnover, number of complaints received, etc. If you are looking for a format to display your unique thoughts, then the professionally designed Relationship Management Strategies Impact On Employee Productivity is the one for you. You can use it as a Google Slides template or a PowerPoint template. Incorporate impressive visuals, symbols, images, and other charts. Modify or reorganize the text boxes as you desire. Experiment with shade schemes and font pairings. Alter, share or cooperate with other people on your work. Download Relationship Management Strategies Impact On Employee Productivity and find out how to give a successful presentation. Present a perfect display to your team and make your presentation unforgettable. Following slide outlines various KPIs metrics which can be used by businesses to determine the impact of relationship management strategies on employees. It includes key performance indicators such as average employee performance rate, employee motivation level, employee turnover, number of complaints received, etc.
Dashboard For Tracking Referral Implementing Social Media Tactics For Boosting WOM Icons Pdf
This slide covers the KPI dashboard for brands to evaluate the performance of referral marketing campaigns. It includes metrics such as referral participation rate, referred customers, referral conversion rate, total revenue generated, etc.Do you have an important presentation coming up Are you looking for something that will make your presentation stand out from the rest Look no further than Dashboard For Tracking Referral Implementing Social Media Tactics For Boosting WOM Icons Pdf. With our professional designs, you can trust that your presentation will pop and make delivering it a smooth process. And with Slidegeeks, you can trust that your presentation will be unique and memorable. So why wait Grab Dashboard For Tracking Referral Implementing Social Media Tactics For Boosting WOM Icons Pdf today and make your presentation stand out from the rest This slide covers the KPI dashboard for brands to evaluate the performance of referral marketing campaigns. It includes metrics such as referral participation rate, referred customers, referral conversion rate, total revenue generated, etc.
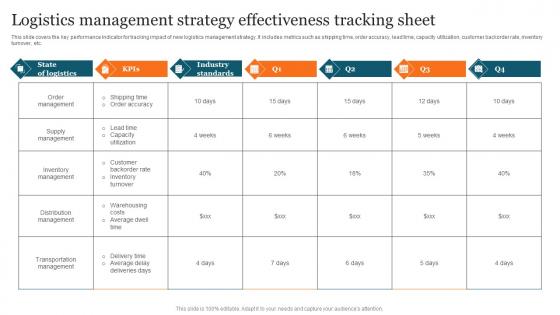
Logistics Management Strategy Advanced Supply Chain Improvement Strategies Ideas Pdf
This slide covers the key performance indicator for tracking impact of new logistics management strategy. It includes metrics such as shipping time, order accuracy, lead time, capacity utilization, customer backorder rate, inventory turnover, etc. Formulating a presentation can take up a lot of effort and time, so the content and message should always be the primary focus. The visuals of the PowerPoint can enhance the presenters message, so our Logistics Management Strategy Advanced Supply Chain Improvement Strategies Ideas Pdf was created to help save time. Instead of worrying about the design, the presenter can concentrate on the message while our designers work on creating the ideal templates for whatever situation is needed. Slidegeeks has experts for everything from amazing designs to valuable content, we have put everything into Logistics Management Strategy Advanced Supply Chain Improvement Strategies Ideas Pdf This slide covers the key performance indicator for tracking impact of new logistics management strategy. It includes metrics such as shipping time, order accuracy, lead time, capacity utilization, customer backorder rate, inventory turnover, etc.

Comparing Current Recruitment Kpi With Industry Analysing Hr Data For Effective Decision Making
This slide provides highlights about comparative assessment of multiple recruitment metrics with industry standards. It includes parameters such as time to hire, cost per hire, turnover rate, offer acceptance rate, qualified candidates per opening, etc. Do you have an important presentation coming up Are you looking for something that will make your presentation stand out from the rest Look no further than Comparing Current Recruitment Kpi With Industry Analysing Hr Data For Effective Decision Making. With our professional designs, you can trust that your presentation will pop and make delivering it a smooth process. And with Slidegeeks, you can trust that your presentation will be unique and memorable. So why wait Grab Comparing Current Recruitment Kpi With Industry Analysing Hr Data For Effective Decision Making today and make your presentation stand out from the rest This slide provides highlights about comparative assessment of multiple recruitment metrics with industry standards. It includes parameters such as time to hire, cost per hire, turnover rate, offer acceptance rate, qualified candidates per opening, etc.
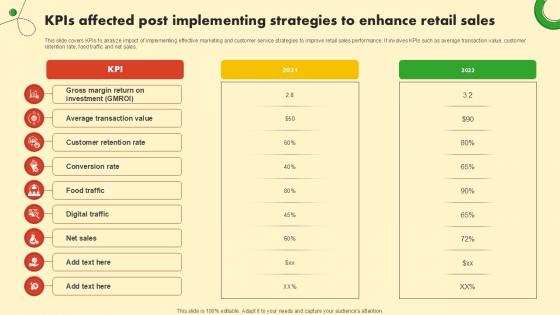
KPIs Affected Post Implementing Food And Grocery Retail Ppt Sample
This slide covers KPIs to analyze impact of implementing effective marketing and customer service strategies to improve retail sales performance. It involves KPIs such as average transaction value, customer retention rate, food traffic and net sales. Slidegeeks is here to make your presentations a breeze with Kpis Affected Post Implementing Food And Grocery Retail Ppt Sample With our easy-to-use and customizable templates, you can focus on delivering your ideas rather than worrying about formatting. With a variety of designs to choose from, you are sure to find one that suits your needs. And with animations and unique photos, illustrations, and fonts, you can make your presentation pop. So whether you are giving a sales pitch or presenting to the board, make sure to check out Slidegeeks first This slide covers KPIs to analyze impact of implementing effective marketing and customer service strategies to improve retail sales performance. It involves KPIs such as average transaction value, customer retention rate, food traffic and net sales.
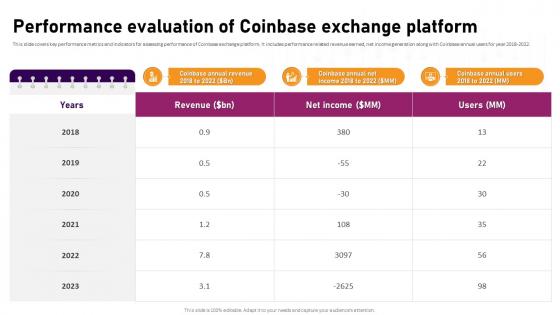
Performance Evaluation Of Coinbase Exchange Complete Roadmap To Blockchain BCT SS V
This slide covers key performance metrics and indicators for assessing performance of Coinbase exchange platform. It includes performance related revenue earned, net income generation along with Coinbase annual users for year 2018-2022. Whether you have daily or monthly meetings, a brilliant presentation is necessary. Performance Evaluation Of Coinbase Exchange Complete Roadmap To Blockchain BCT SS V can be your best option for delivering a presentation. Represent everything in detail using Performance Evaluation Of Coinbase Exchange Complete Roadmap To Blockchain BCT SS V and make yourself stand out in meetings. The template is versatile and follows a structure that will cater to your requirements. All the templates prepared by Slidegeeks are easy to download and edit. Our research experts have taken care of the corporate themes as well. So, give it a try and see the results. This slide covers key performance metrics and indicators for assessing performance of Coinbase exchange platform. It includes performance related revenue earned, net income generation along with Coinbase annual users for year 2018-2022.

Tactical Planning Guide For Supervisors Race Framework For Measuring The Success Of Strategic Plan Download PDF
Purpose of this slide is to display RACE framework that can be used by managers in measuring the success of their strategic plan post implementation. Metric covered in the framework are share of audience, bounce rate, conversion rate etc. Slidegeeks is here to make your presentations a breeze with Tactical Planning Guide For Supervisors Race Framework For Measuring The Success Of Strategic Plan Download PDF With our easy to use and customizable templates, you can focus on delivering your ideas rather than worrying about formatting. With a variety of designs to choose from, you are sure to find one that suits your needs. And with animations and unique photos, illustrations, and fonts, you can make your presentation pop. So whether you are giving a sales pitch or presenting to the board, make sure to check out Slidegeeks first.
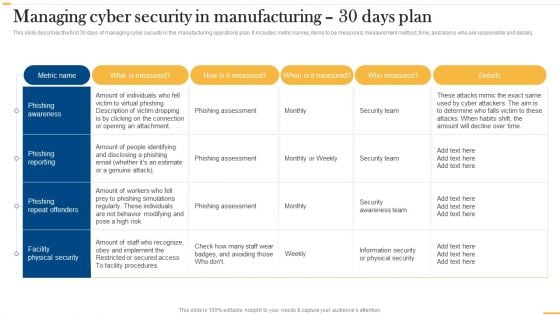
Deploying AI To Enhance Managing Cyber Security In Manufacturing 30 Days Plan Formats PDF
This slide describes the first 30 days of managing cyber security in the manufacturing operations plan. It includes metric names, items to be measured, measurement method, time, and teams who are responsible and details. Slidegeeks is here to make your presentations a breeze with Deploying AI To Enhance Managing Cyber Security In Manufacturing 30 Days Plan Formats PDF With our easy-to-use and customizable templates, you can focus on delivering your ideas rather than worrying about formatting. With a variety of designs to choose from, youre sure to find one that suits your needs. And with animations and unique photos, illustrations, and fonts, you can make your presentation pop. So whether youre giving a sales pitch or presenting to the board, make sure to check out Slidegeeks first.
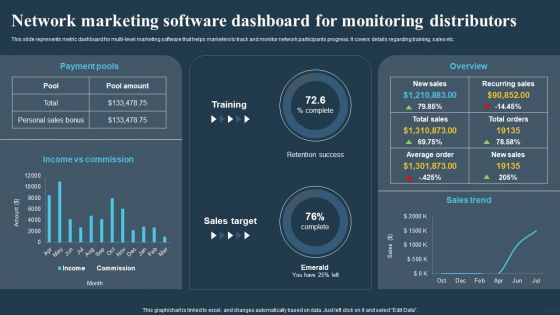
Comprehensive Guide For Multi Level Network Marketing Software Dashboard Summary PDF
This slide represents metric dashboard for multi-level marketing software that helps marketers to track and monitor network participants progress. It covers details regarding training, sales etc. Do you have an important presentation coming up Are you looking for something that will make your presentation stand out from the rest Look no further than Comprehensive Guide For Multi Level Network Marketing Software Dashboard Summary PDF. With our professional designs, you can trust that your presentation will pop and make delivering it a smooth process. And with Slidegeeks, you can trust that your presentation will be unique and memorable. So why wait Grab Comprehensive Guide For Multi Level Network Marketing Software Dashboard Summary PDF today and make your presentation stand out from the rest.
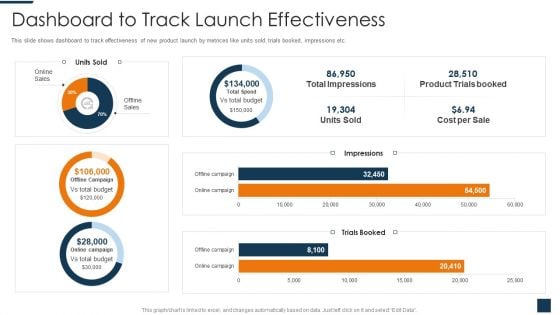
Go To Market Strategy For New Product Dashboard To Track Launch Effectiveness Template PDF
This slide shows dashboard to track effectiveness of new product launch by metrices like units sold, trials booked, impressions etc. Deliver and pitch your topic in the best possible manner with this go to market strategy for new product dashboard to track launch effectiveness template pdf. Use them to share invaluable insights on budget, campaign, cost, sales and impress your audience. This template can be altered and modified as per your expectations. So, grab it now.
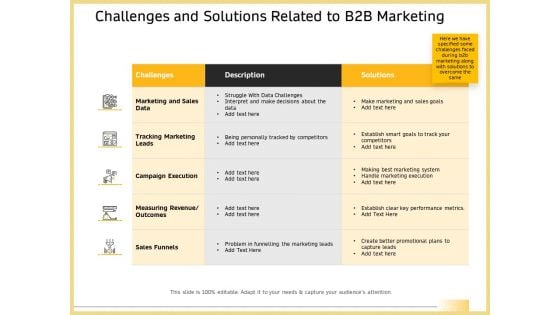
Challenges And Solutions Related To B2b Marketing Topics PDF
Deliver and pitch your topic in the best possible manner with this challenges and solutions related to b2b marketing topics pdf. Use them to share invaluable insights on tracking marketing leads, marketing and sales data, campaign execution, measuring revenue outcomes, sales funnels and impress your audience. This template can be altered and modified as per your expectations. So, grab it now.
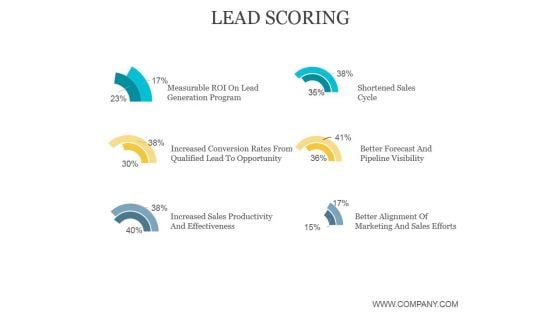
Lead Scoring Ppt PowerPoint Presentation Ideas
This is a lead scoring ppt powerpoint presentation ideas. This is a six stage process. The stages in this process are measurable roi on lead generation program, increased conversion rates from qualified lead to opportunity, increased sales productivity and effectiveness, better alignment of marketing and sales efforts, better forecast and pipeline visibility.
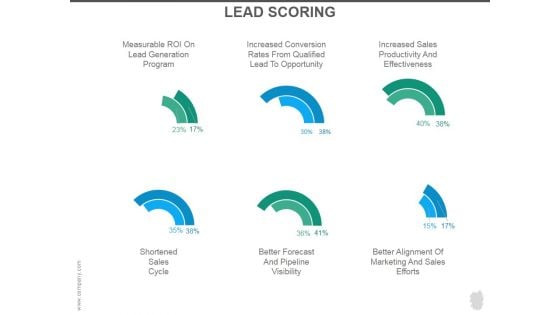
Lead Scoring Ppt PowerPoint Presentation Rules
This is a lead scoring ppt powerpoint presentation rules. This is a six stage process. The stages in this process are measurable roi on lead generation program, increased conversion rates from, qualified lead to opportunity, increased sales productivity and effectiveness, shortened sales cycle, better forecast and pipeline visibility.

Key Financial Chart Digital Marketings Strategies PPT PowerPoint CP SS V
This slide showcases the sales of Aerospace company. It includes sales growth and net income growth of five years. Sales growth measures the ability of sales team to increase revenue over a fixed period of time. Coming up with a presentation necessitates that the majority of the effort goes into the content and the message you intend to convey. The visuals of a PowerPoint presentation can only be effective if it supplements and supports the story that is being told. Keeping this in mind our experts created Key Financial Chart Digital Marketings Strategies PPT PowerPoint CP SS V to reduce the time that goes into designing the presentation. This way, you can concentrate on the message while our designers take care of providing you with the right template for the situation. This slide showcases the sales of Aerospace company. It includes sales growth and net income growth of five years. Sales growth measures the ability of sales team to increase revenue over a fixed period of time.
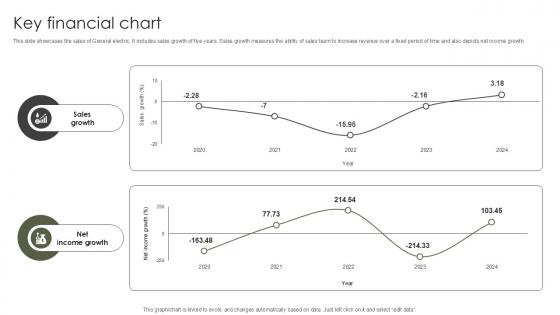
Key Financial Chart Military Aircraft Engine Manufacturing PPT Presentation CP SS V
This slide showcases the sales of General electric. It includes sales growth of five years. Sales growth measures the ability of sales team to increase revenue over a fixed period of time and also depicts net income growth. Explore a selection of the finest Key Financial Chart Military Aircraft Engine Manufacturing PPT Presentation CP SS V here. With a plethora of professionally designed and pre-made slide templates, you can quickly and easily find the right one for your upcoming presentation. You can use our Key Financial Chart Military Aircraft Engine Manufacturing PPT Presentation CP SS V to effectively convey your message to a wider audience. Slidegeeks has done a lot of research before preparing these presentation templates. The content can be personalized and the slides are highly editable. Grab templates today from Slidegeeks. This slide showcases the sales of General electric. It includes sales growth of five years. Sales growth measures the ability of sales team to increase revenue over a fixed period of time and also depicts net income growth.
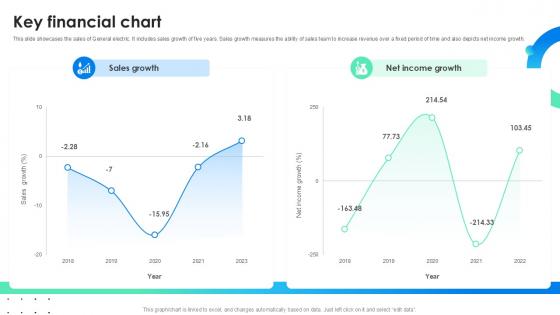
Key Financial Chart Global Energy Company Profile PPT Example CP SS V
This slide showcases the sales of General electric. It includes sales growth of five years. Sales growth measures the ability of sales team to increase revenue over a fixed period of time and also depicts net income growth. Explore a selection of the finest Key Financial Chart Global Energy Company Profile PPT Example CP SS V here. With a plethora of professionally designed and pre-made slide templates, you can quickly and easily find the right one for your upcoming presentation. You can use our Key Financial Chart Global Energy Company Profile PPT Example CP SS V to effectively convey your message to a wider audience. Slidegeeks has done a lot of research before preparing these presentation templates. The content can be personalized and the slides are highly editable. Grab templates today from Slidegeeks. This slide showcases the sales of General electric. It includes sales growth of five years. Sales growth measures the ability of sales team to increase revenue over a fixed period of time and also depicts net income growth.
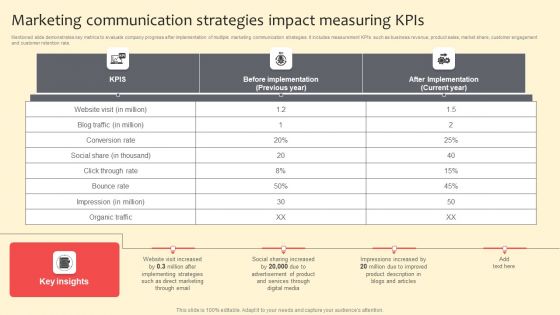
Marketing Communication Strategies Impact Measuring Kpis Microsoft PDF
Mentioned slide demonstrates key metrics to evaluate company progress after implementation of multiple marketing communication strategies. It includes measurement KPIs such as business revenue, product sales, market share, customer engagement and customer retention rate. Get a simple yet stunning designed Marketing Communication Strategies Impact Measuring Kpis Microsoft PDF. It is the best one to establish the tone in your meetings. It is an excellent way to make your presentations highly effective. So, download this PPT today from Slidegeeks and see the positive impacts. Our easy to edit Marketing Communication Strategies Impact Measuring Kpis Microsoft PDF can be your go to option for all upcoming conferences and meetings. So, what are you waiting for Grab this template today.

Performance Analysis Of Product Development Strategies Sample PDF
The following slide outlines various key performance indicators KPIs that can assist marketers in evaluating success of new product launch. The key metrics covered in slide are product cost, research and development R and D spending, time to market, sales, customer satisfaction, and market share. Create an editable Performance Analysis Of Product Development Strategies Sample PDF that communicates your idea and engages your audience. Whether you are presenting a business or an educational presentation, pre-designed presentation templates help save time. Performance Analysis Of Product Development Strategies Sample PDF is highly customizable and very easy to edit, covering many different styles from creative to business presentations. Slidegeeks has creative team members who have crafted amazing templates. So, go and get them without any delay.

Revenue Incorporation Projection Report Review Themes Pdf
This slide depicts incorporation analysis which help manager to identifies recent sales numbers, financial outcomes and business performance. It include pointers such as area, product, budget for current year, actual sales and budget for future period. Pitch your topic with ease and precision using this Revenue Incorporation Projection Report Review Themes Pdf This layout presents information on Sales Budget, Budget For Current, California It is also available for immediate download and adjustment. So, changes can be made in the color, design, graphics or any other component to create a unique layout. This slide depicts incorporation analysis which help manager to identifies recent sales numbers, financial outcomes and business performance. It include pointers such as area, product, budget for current year, actual sales and budget for future period.

Marketing Strategies For Hotel Start Up Benefits Of Marketing For Hotel Start Ups Background PDF
This slide covers advantages of the marketing efforts for hotel start ups. It helps users gain data and metrics to learn more about their target audience . The benefits include increase sales, bookings and earn competitive edge in the market. Are you in need of a template that can accommodate all of your creative concepts This one is crafted professionally and can be altered to fit any style. Use it with Google Slides or PowerPoint. Include striking photographs, symbols, depictions, and other visuals. Fill, move around, or remove text boxes as desired. Test out color palettes and font mixtures. Edit and save your work, or work with colleagues. Download Marketing Strategies For Hotel Start Up Benefits Of Marketing For Hotel Start Ups Background PDF and observe how to make your presentation outstanding. Give an impeccable presentation to your group and make your presentation unforgettable.
Ppt Team Effort Person Standing Yellow Piece Of Chart PowerPoint Ks2 Templates
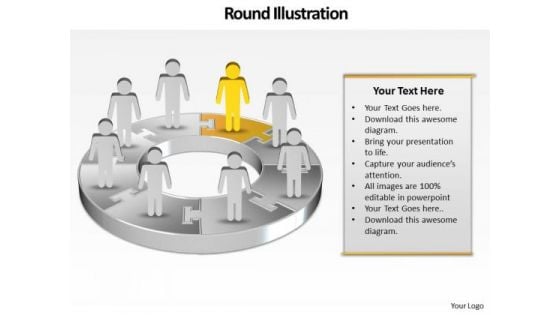
PPT team effort person standing yellow piece of chart PowerPoint ks2 Templates-Use this Circular Arrow diagram to show activities that are related to the business plan metrics and monitor the results to determine if the business plan is proceeding as planned. You can apply other 3D Styles and shapes to the slide to enhance your presentations.-PPT team effort person standing yellow piece of chart PowerPoint ks2 Templates-arrow, bar, business, businessman, candidate, cartoon, character, chart, circle, circular, client, communication, company, concept, diagram, finance, financial, flow, growth, human, illustration, increase, information, iteration, man, market, marketing, process, processing, profit, sales, statistics, stats, success, target Feature your views with our Ppt Team Effort Person Standing Yellow Piece Of Chart PowerPoint Ks2 Templates. They will get the desired exposure.
Liquidity Risk Management Model Ppt Inspiration
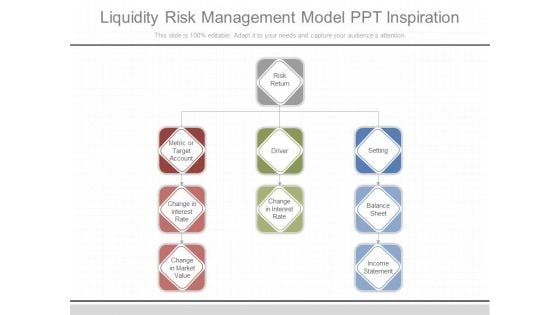
This is a liquidity risk management model ppt inspiration. This is a three stage process. The stages in this process are risk return, metric or target account, change in interest rate, change in market value, driver, change in interest rate, setting, balance sheet, income statement.


 Continue with Email

 Home
Home


