Sales Organization Chart
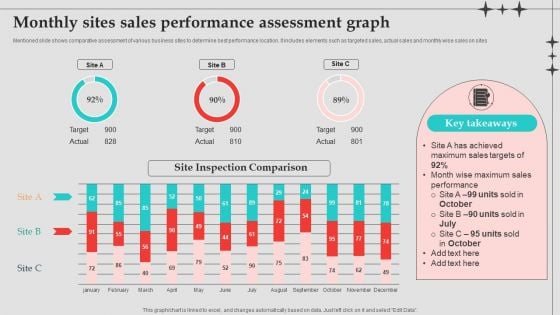
Monthly Sites Sales Performance Assessment Graph Designs PDF
Mentioned slide shows comparative assessment of various business sites to determine best performance location. It includes elements such as targeted sales, actual sales and monthly wise sales on sites. Pitch your topic with ease and precision using this Monthly Sites Sales Performance Assessment Graph Designs PDF. This layout presents information on Sales Performance, Sales Targets, Performance Assessment Graph . It is also available for immediate download and adjustment. So, changes can be made in the color, design, graphics or any other component to create a unique layout.
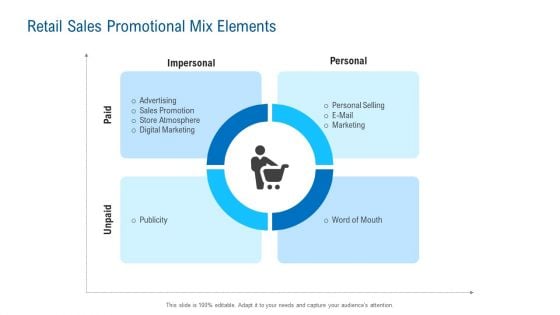
Merchandising Industry Analysis Retail Sales Promotional Mix Elements Sample PDF
Presenting merchandising industry analysis retail sales promotional mix elements sample pdf to provide visual cues and insights. Share and navigate important information on four stages that need your due attention. This template can be used to pitch topics like sales promotion, digital marketing, store atmosphere, marketing. In addtion, this PPT design contains high resolution images, graphics, etc, that are easily editable and available for immediate download.
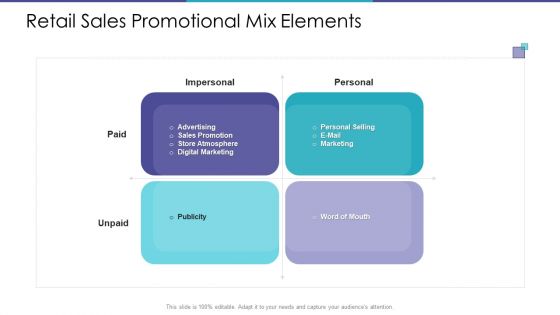
Retail Sales Promotional Mix Elements Ppt Pictures File Formats PDF
This is a retail sales promotional mix elements ppt pictures file formats pdf. template with various stages. Focus and dispense information on four stages using this creative set, that comes with editable features. It contains large content boxes to add your information on topics like sales promotion, digital marketing, personal selling. You can also showcase facts, figures, and other relevant content using this PPT layout. Grab it now.
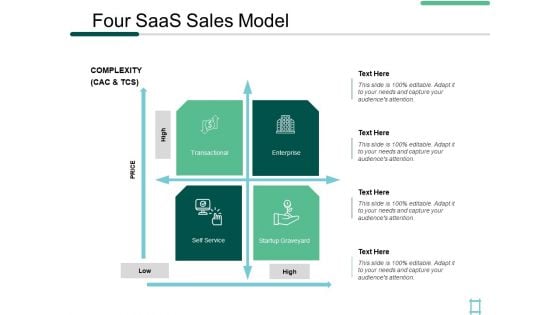
Four Saas Sales Model Enterprise Ppt PowerPoint Presentation Infographics Sample
This is a four saas sales model enterprise ppt powerpoint presentation infographics sample. This is a four stage process. The stages in this process are transactional, enterprise, self service, startup graveyard, planning.
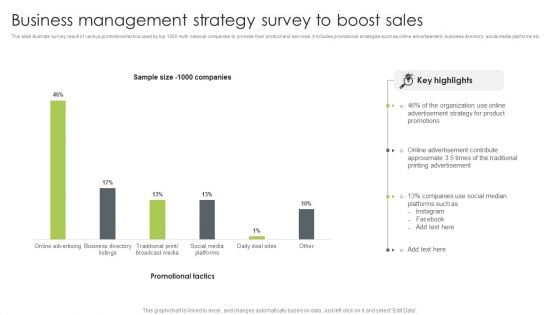
Business Management Strategy Survey To Boost Sales Summary PDF
This slide illustrate survey result of various promotional tactics used by top 1000 multi national companies to promote their product and services. it includes promotional strategies such as online advertisement, business directory, social media platforms etc. Pitch your topic with ease and precision using this Business Management Strategy Survey To Boost Sales Summary PDF. This layout presents information on Advertisement Strategy, Organization, Social Median. It is also available for immediate download and adjustment. So, changes can be made in the color, design, graphics or any other component to create a unique layout.
Monthly Sales Performance Tracking And Monitoring Dashboard Diagrams PDF
This slide showcases a dashboard presenting various metrics to measure and analyze sales performance for revenue growth. It includes key components such as number of sales, revenue, profit, cost, sales revenue, sales increment, cost analysis and cross sell. Make sure to capture your audiences attention in your business displays with our gratis customizable Monthly Sales Performance Tracking And Monitoring Dashboard Diagrams PDF. These are great for business strategies, office conferences, capital raising or task suggestions. If you desire to acquire more customers for your tech business and ensure they stay satisfied, create your own sales presentation with these plain slides.
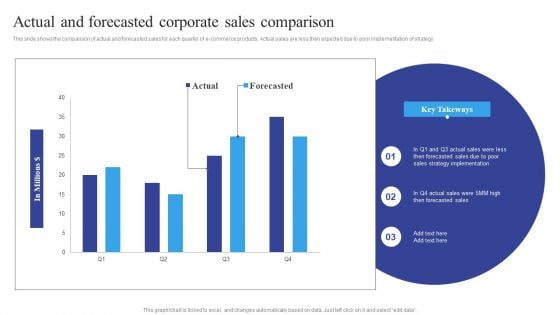
Actual And Forecasted Corporate Sales Comparison Brochure PDF
This slide shows the comparison of actual and forecasted sales for each quarter of e-commerce products. Actual sales are less then expected due to poor implementation of strategy. Showcasing this set of slides titled Actual And Forecasted Corporate Sales Comparison Brochure PDF. The topics addressed in these templates are Actual And Forecasted, Corporate Sales Comparison. All the content presented in this PPT design is completely editable. Download it and make adjustments in color, background, font etc. as per your unique business setting.

Sales Inspiration Ppt PowerPoint Presentation Complete Deck With Slides
This is a sales inspiration ppt powerpoint presentation complete deck with slides. This is a one stage process. The stages in this process are sales, planning, marketing, management, process.
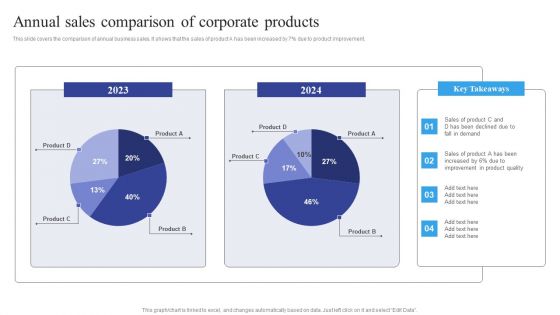
Annual Sales Comparison Of Corporate Products Themes PDF
This slide covers the comparison of annual business sales. It shows that the sales of product A has been increased by 7 percent due to product improvement. Pitch your topic with ease and precision using this Annual Sales Comparison Of Corporate Products Themes PDF. This layout presents information on Annual Sales, Comparison Of Corporate Products. It is also available for immediate download and adjustment. So, changes can be made in the color, design, graphics or any other component to create a unique layout.
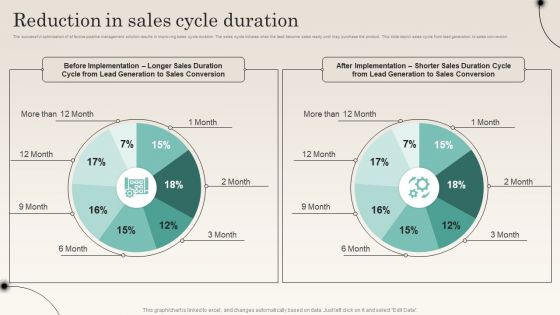
Reduction In Sales Cycle Duration Improving Distribution Channel Slides PDF
The successful optimization of effective pipeline management solution results in improving sales cycle duration. The sales cycle initiates when the lead become sales ready until they purchase the product. This slide depict sales cycle from lead generation to sales conversion.Deliver and pitch your topic in the best possible manner with this Reduction In Sales Cycle Duration Improving Distribution Channel Slides PDF. Use them to share invaluable insights on Positive Momentum, Opportunities Progression, Enhance Engagement and impress your audience. This template can be altered and modified as per your expectations. So, grab it now.
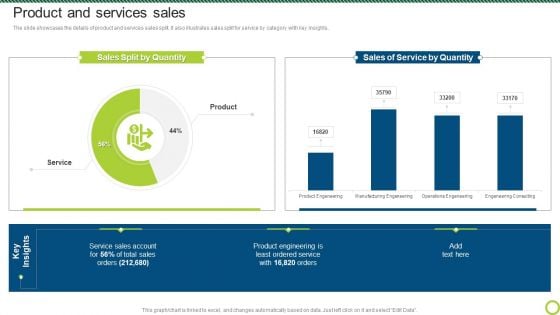
Engineering Solutions Company Detail Product And Services Sales Designs PDF
The slide showcases the details of product and services sales split. It also illustrates sales split for service by category with key insights.Deliver and pitch your topic in the best possible manner with this Engineering Solutions Company Detail Product And Services Sales Designs PDF. Use them to share invaluable insights on Service By Quantity, Sales Account, Product Engineering and impress your audience. This template can be altered and modified as per your expectations. So, grab it now.
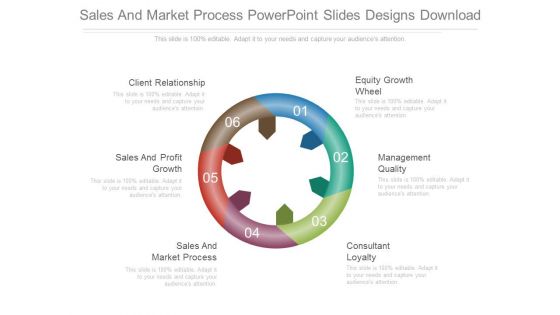
Sales And Market Process Powerpoint Slides Designs Download
This is a sales and market process powerpoint slides designs download. This is a six stage process. The stages in this process are client relationship, sales and profit growth, sales and market process, consultant loyalty, management quality, equity growth wheel.
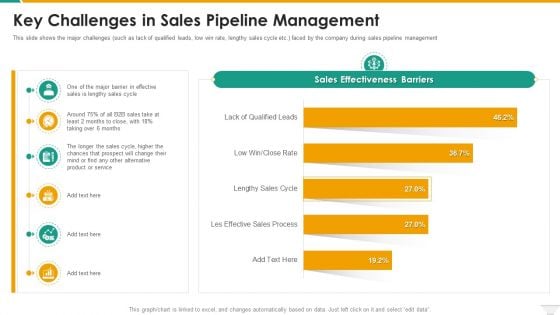
Key Challenges In Sales Pipeline Management Microsoft PDF
This slide shows the major challenges such as lack of qualified leads, low win rate, lengthy sales cycle etc. faced by the company during sales pipeline management Deliver and pitch your topic in the best possible manner with this Key Challenges In Sales Pipeline Management Microsoft PDF. Use them to share invaluable insights on Key Challenges In Sales Pipeline Management and impress your audience. This template can be altered and modified as per your expectations. So, grab it now.
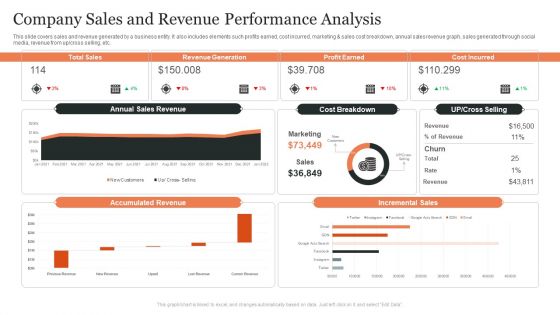
Company Sales And Revenue Performance Analysis Ppt Ideas Format PDF
This slide covers sales and revenue generated by a business entity. It also includes elements such profits earned, cost incurred, marketing and sales cost breakdown, annual sales revenue graph, sales generated through social media, revenue from up OR cross selling, etc. Pitch your topic with ease and precision using this Company Sales And Revenue Performance Analysis Ppt Ideas Format PDF. This layout presents information on Total Sales, Revenue Generation, Profit Earned, Cost Incurred. It is also available for immediate download and adjustment. So, changes can be made in the color, design, graphics or any other component to create a unique layout.
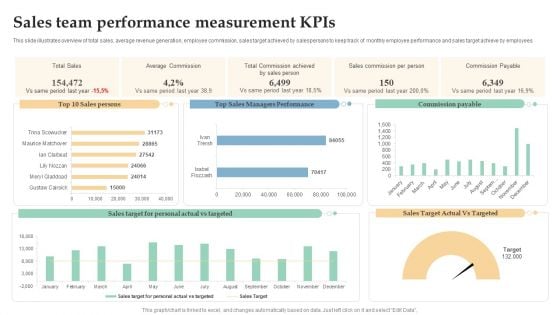
Sales Team Performance Measurement Kpis Ppt Professional Templates PDF
This slide illustrates overview of total sales, average revenue generation, employee commission, sales target achieved by salespersons to keep track of monthly employee performance and sales target achieve by employees. Showcasing this set of slides titled Sales Team Performance Measurement Kpis Ppt Professional Templates PDF. The topics addressed in these templates are Total Sales, Average Commission, Sales Commission, Per Person. All the content presented in this PPT design is completely editable. Download it and make adjustments in color, background, font etc. as per your unique business setting.
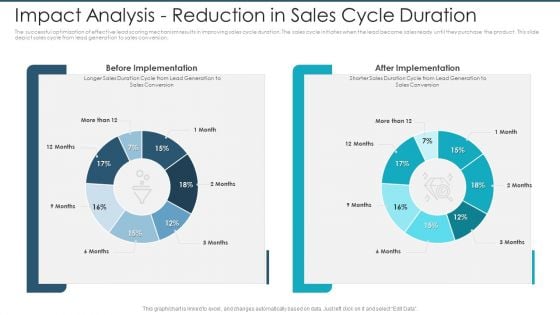
Impact Analysis Reduction In Sales Cycle Duration Infographics PDF
The successful optimization of effective lead scoring mechanism results in improving sales cycle duration. The sales cycle initiates when the lead become sales ready until they purchase the product. This slide depict sales cycle from lead generation to sales conversion.Deliver an awe-inspiring pitch with this creative impact analysis reduction in sales cycle duration infographics pdf. bundle. Topics like before implementation, after implementation can be discussed with this completely editable template. It is available for immediate download depending on the needs and requirements of the user.
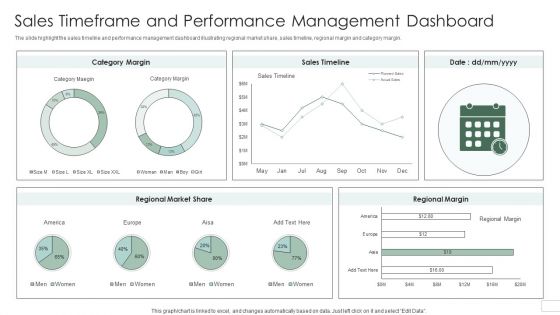
Sales Timeframe And Performance Management Dashboard Introduction PDF
The slide highlight the sales timeline and performance management dashboard illustrating regional market share, sales timeline, regional margin and category margin. Pitch your topic with ease and precision using this Sales Timeframe And Performance Management Dashboard Introduction PDF. This layout presents information on Regional Market Share, Category Margin, Sales Timeline. It is also available for immediate download and adjustment. So, changes can be made in the color, design, graphics or any other component to create a unique layout.
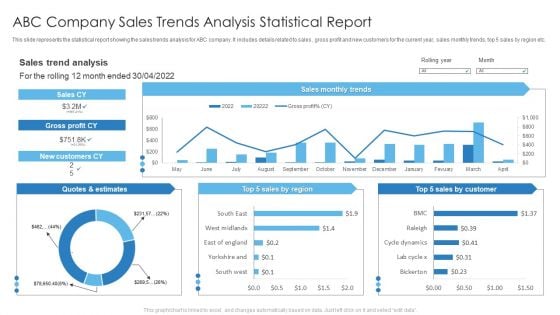
Abc Company Sales Trends Analysis Statistical Report Slides PDF
This slide represents the statistical report showing the sales trends analysis for ABC company. It includes details related to sales , gross profit and new customers for the current year, sales monthly trends, top 5 sales by region etc. Deliver an awe inspiring pitch with this creative Abc Company Sales Trends Analysis Statistical Report Slides PDF bundle. Topics like Abc Company Sales, Trends Analysis Statistical Report can be discussed with this completely editable template. It is available for immediate download depending on the needs and requirements of the user.
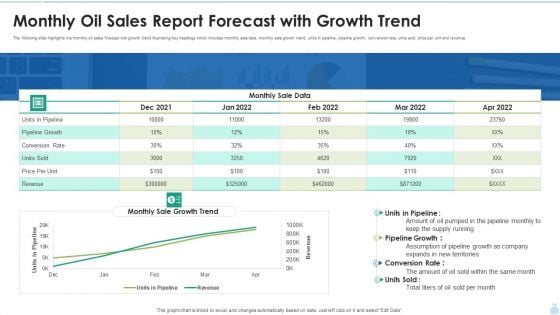
Monthly Oil Sales Report Forecast With Growth Trend Graphics PDF
The following slide highlights the monthly oil sales forecast with growth trend illustrating key headings which includes monthly sale data, monthly sale growth trend, units in pipeline, pipeline growth, conversion rate, units sold, price per unit and revenue. Showcasing this set of slides titled Monthly Oil Sales Report Forecast With Growth Trend Graphics PDF. The topics addressed in these templates are Pipeline Growth, Monthly Sale Data, Conversion Rate. All the content presented in this PPT design is completely editable. Download it and make adjustments in color, background, font etc. as per your unique business setting.
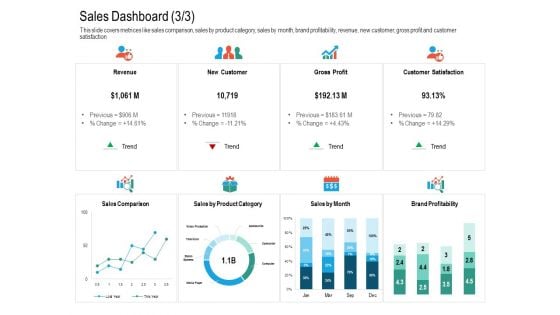
Upselling Strategies For Business Sales Dashboard Trend Guidelines PDF
This slide covers metrices like sales comparison, sales by product category, sales by month, brand profitability, revenue, new customer, gross profit and customer satisfaction. Deliver and pitch your topic in the best possible manner with this upselling strategies for business sales dashboard trend guidelines pdf. Use them to share invaluable insights on revenue, gross profit, customer satisfaction, new customer and impress your audience. This template can be altered and modified as per your expectations. So, grab it now.
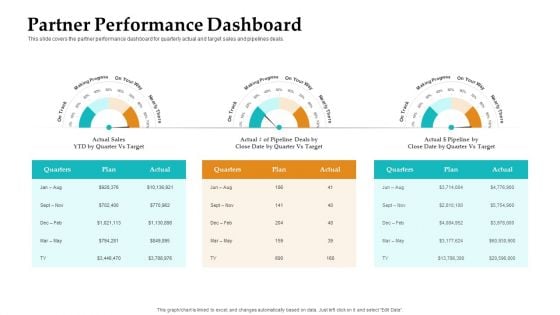
Sales Facilitation Partner Management Partner Performance Dashboard Graphics PDF
This slide covers the partner performance dashboard for quarterly actual and target sales and pipelines deals. Deliver an awe inspiring pitch with this creative sales facilitation partner management partner performance dashboard graphics pdf bundle. Topics like sales, target, actual, plan can be discussed with this completely editable template. It is available for immediate download depending on the needs and requirements of the user.
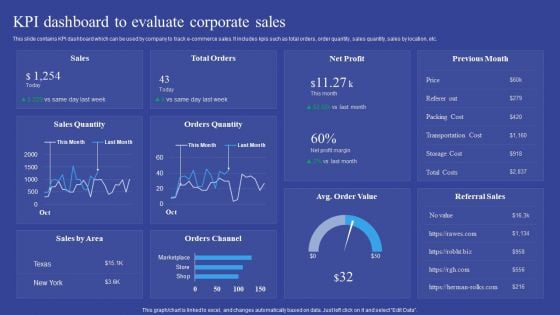
KPI Dashboard To Evaluate Corporate Sales Introduction PDF
This slide contains KPI dashboard which can be used by company to track e-commerce sales. It includes kpis such as total orders, order quantity, sales quantity, sales by location, etc. Pitch your topic with ease and precision using this KPI Dashboard To Evaluate Corporate Sales Introduction PDF. This layout presents information on KPI Dashboard, Evaluate Corporate Sales. It is also available for immediate download and adjustment. So, changes can be made in the color, design, graphics or any other component to create a unique layout.
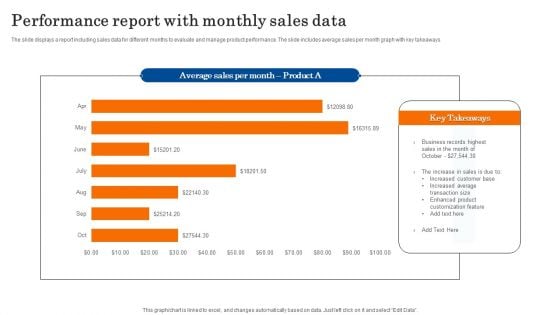
Performance Report With Monthly Sales Data Diagrams PDF
The slide displays a report including sales data for different months to evaluate and manage product performance. The slide includes average sales per month graph with key takeaways. Showcasing this set of slides titled Performance Report With Monthly Sales Data Diagrams PDF. The topics addressed in these templates are Business, Sales, Customization. All the content presented in this PPT design is completely editable. Download it and make adjustments in color, background, font etc. as per your unique business setting.
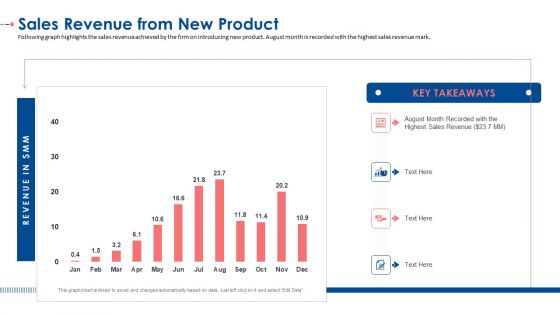
Sales Revenue From New Product Ppt Infographic Template Example PDF
Following graph highlights the sales revenue achieved by the firm on introducing new product. August month is recorded with the highest sales revenue mark. Deliver and pitch your topic in the best possible manner with this sales revenue from new product ppt infographic template example pdf. Use them to share invaluable insights on sales revenue from new product and impress your audience. This template can be altered and modified as per your expectations. So, grab it now.
B2B Sales Representative Insights Dashboard Ppt Icon PDF
This slide covers the sales reps dashboard wherein teams contribution to leads, managing SQLs and revenue targets are evaluated.Deliver an awe-inspiring pitch with this creative B2B sales representative insights dashboard ppt icon pdf. bundle. Topics like sales representatives leads actual, sales representatives revenue actual, revenue pace can be discussed with this completely editable template. It is available for immediate download depending on the needs and requirements of the user.
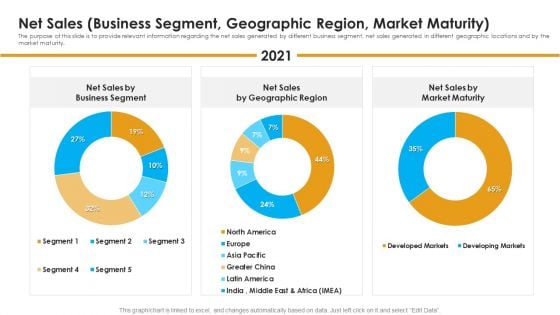
Net Sales Business Segment Geographic Region Market Maturity Information PDF
The purpose of this slide is to provide relevant information regarding the net sales generated by different business segment, net sales generated in different geographic locations and by the market maturity. Deliver an awe-inspiring pitch with this creative net sales business segment geographic region market maturity information pdf bundle. Topics like business segment, net sales by geographic region, market maturity can be discussed with this completely editable template. It is available for immediate download depending on the needs and requirements of the user.
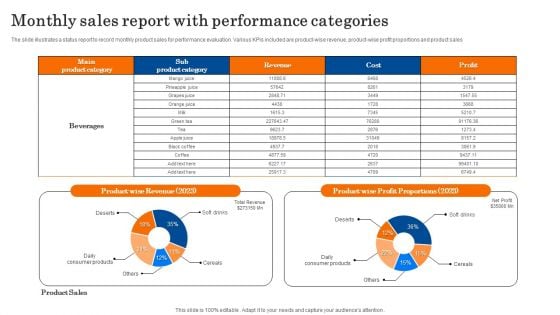
Monthly Sales Report With Performance Categories Diagrams PDF
The slide illustrates a status report to record monthly product sales for performance evaluation. Various KPIs included are product wise revenue, product-wise profit proportions and product sales. Showcasing this set of slides titled Monthly Sales Report With Performance Categories Diagrams PDF. The topics addressed in these templates are Revenue, Profit Proportions, Product Sales. All the content presented in this PPT design is completely editable. Download it and make adjustments in color, background, font etc. as per your unique business setting.
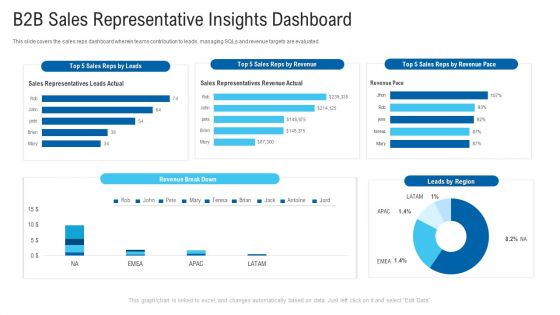
B2B Sales Representative Insights Dashboard Ppt Summary PDF
This slide covers the sales reps dashboard wherein teams contribution to leads, managing SQLs and revenue targets are evaluated.Deliver an awe-inspiring pitch with this creative B2B sales representative insights dashboard ppt summary pdf. bundle. Topics like sales representatives leads actual, sales representatives revenue actual, revenue pace can be discussed with this completely editable template. It is available for immediate download depending on the needs and requirements of the user.
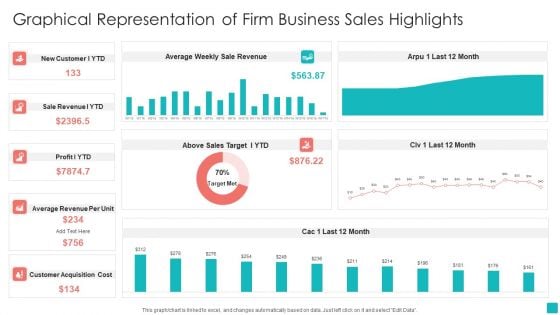
Graphical Representation Of Firm Business Sales Highlights Pictures PDF
Showcasing this set of slides titled Graphical Representation Of Firm Business Sales Highlights Pictures PDF. The topics addressed in these templates are Average Revenue Per Unit, Customer Acquisition Cost, Sale Revenue. All the content presented in this PPT design is completely editable. Download it and make adjustments in color, background, font etc. as per your unique business setting.
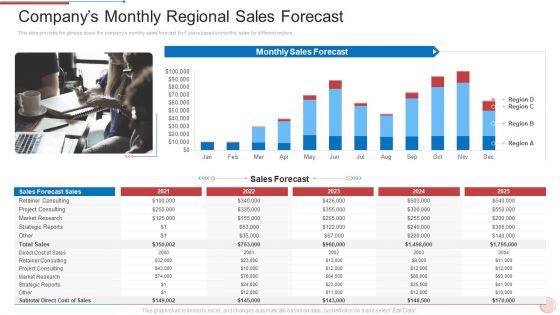
Regional Marketing Strategies Companys Monthly Regional Sales Forecast Graphics PDF
This slide provides the glimpse about the companys monthly sales forecast for 5 years based on monthly sales for different regions. Deliver and pitch your topic in the best possible manner with this regional marketing strategies companys monthly regional sales forecast graphics pdf. Use them to share invaluable insights on strategic, sales, cost and impress your audience. This template can be altered and modified as per your expectations. So, grab it now.
Pharma Medical Dashboard To Analyze Sales Strategy Performance Icons PDF
The following slide delineates a comprehensive medical dashboard which can be used by the pharma company to measure its sales strategy performance. The KPIs covered in the slide are top sales producers, sales channels, volume by product, etc. Showcasing this set of slides titled Pharma Medical Dashboard To Analyze Sales Strategy Performance Icons PDF. The topics addressed in these templates are Market Leaders, Sales Channels, Volume Product. All the content presented in this PPT design is completely editable. Download it and make adjustments in color, background, font etc. as per your unique business setting.
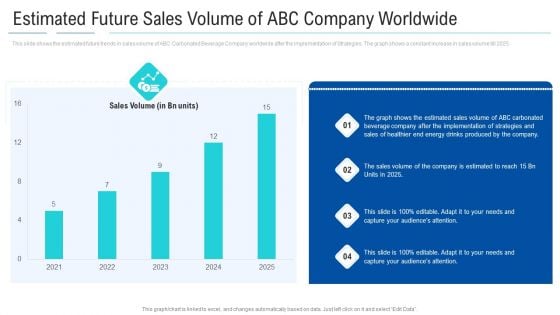
Estimated Future Sales Volume Of ABC Company Worldwide Clipart PDF
This slide shows the estimated future trends in sales volume of ABC Carbonated Beverage Company worldwide after the implementation of Strategies. The graph shows a constant increase in sales volume till 2025. Deliver an awe-inspiring pitch with this creative estimated future sales volume of abc company worldwide clipart pdf. bundle. Topics like estimated future sales volume of abc company worldwide can be discussed with this completely editable template. It is available for immediate download depending on the needs and requirements of the user.
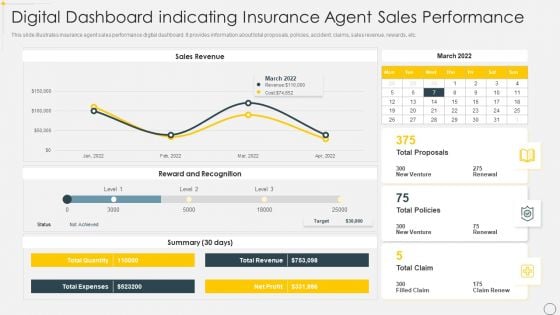
Digital Dashboard Indicating Insurance Agent Sales Performance Portrait PDF
This slide illustrates insurance agent sales performance digital dashboard. It provides information about total proposals, policies, accident, claims, sales revenue, rewards, etc. Pitch your topic with ease and precision using this Digital Dashboard Indicating Insurance Agent Sales Performance Portrait PDF. This layout presents information on Sales Revenue, Reward And Recognition. It is also available for immediate download and adjustment. So, changes can be made in the color, design, graphics or any other component to create a unique layout.
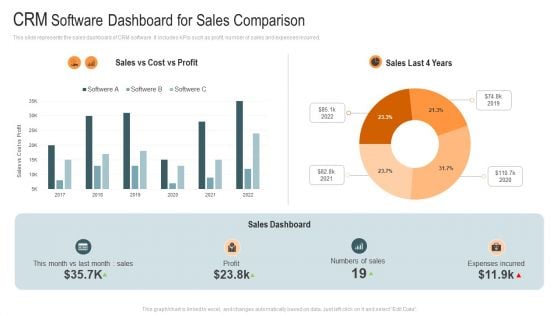
CRM Software Dashboard For Sales Comparison Mockup PDF
This slide represents the sales dashboard of CRM software. It includes KPIs such as profit, number of sales and expenses incurred. Pitch your topic with ease and precision using this CRM Software Dashboard For Sales Comparison Mockup PDF. This layout presents information on Profit, Sales Dashboard, Expenses Incurred. It is also available for immediate download and adjustment. So, changes can be made in the color, design, graphics or any other component to create a unique layout.
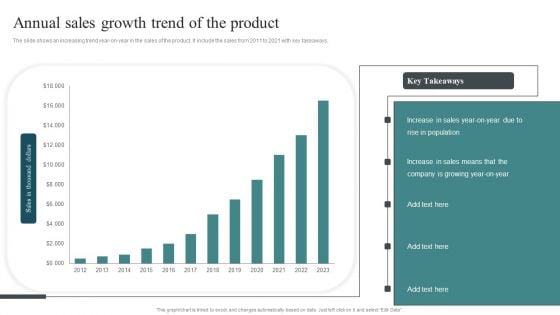
Annual Sales Growth Trend Of The Product Summary PDF
The slide shows an increasing trend year-on-year in the sales of the product. It include the sales from 2011 to 2021 with key takeaways.Pitch your topic with ease and precision using this Annual Sales Growth Trend Of The Product Summary PDF. This layout presents information on Increase Sales, Company Growing, Rise Population. It is also available for immediate download and adjustment. So, changes can be made in the color, design, graphics or any other component to create a unique layout.
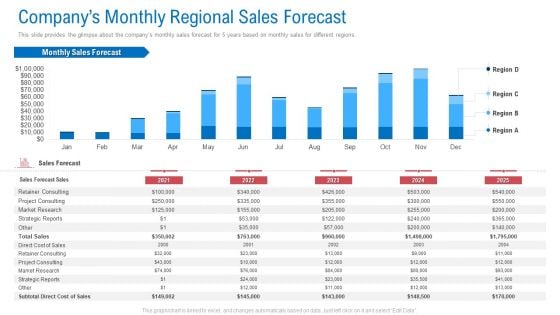
Regional Marketing Planning Companys Monthly Regional Sales Forecast Mockup PDF
This slide provides the glimpse about the companys monthly sales forecast for 5 years based on monthly sales for different regions. Deliver and pitch your topic in the best possible manner with this regional marketing planning companys monthly regional sales forecast mockup pdf. Use them to share invaluable insights on market research, strategic reports, sales forecast and impress your audience. This template can be altered and modified as per your expectations. So, grab it now.
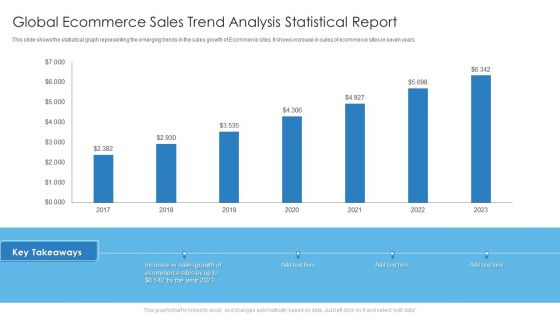
Global Ecommerce Sales Trend Analysis Statistical Report Mockup PDF
This slide shows the statistical graph representing the emerging trends in the sales growth of Ecommerce sites. It shows increase in sales of ecommerce sites in seven years. Deliver and pitch your topic in the best possible manner with this Global Ecommerce Sales Trend Analysis Statistical Report Mockup PDF. Use them to share invaluable insights on Sales Growth, Ecommerce Sites and impress your audience. This template can be altered and modified as per your expectations. So, grab it now.
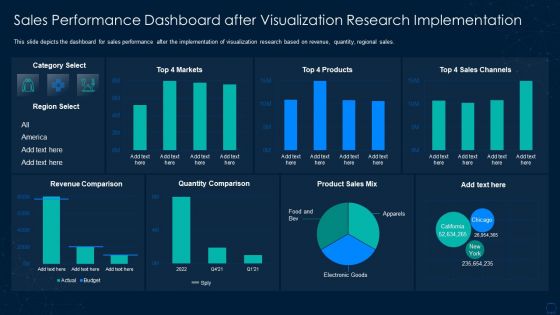
Graphical Representation Of Research IT Sales Performance Dashboard Sample PDF
This slide depicts the dashboard for sales performance after the implementation of visualization research based on revenue, quantity, regional sales. Deliver and pitch your topic in the best possible manner with this graphical representation of research it sales performance dashboard sample pdf. Use them to share invaluable insights on sales performance dashboard after visualization research implementation and impress your audience. This template can be altered and modified as per your expectations. So, grab it now.
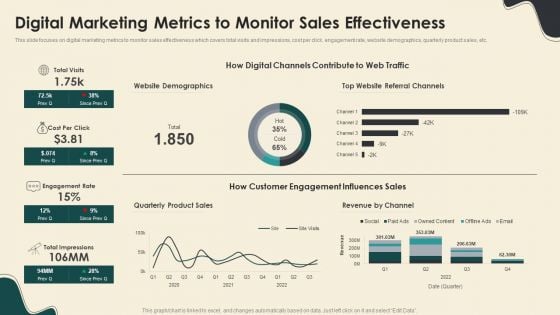
Digital Marketing Metrics To Monitor Sales Effectiveness Graphics PDF
This slide focuses on digital marketing metrics to monitor sales effectiveness which covers total visits and impressions, cost per click, engagement rate, website demographics, quarterly product sales, etc. Deliver an awe inspiring pitch with this creative Digital Marketing Metrics To Monitor Sales Effectiveness Graphics PDF bundle. Topics like Website Demographics, Quarterly Product Sales, Revenue By Channel can be discussed with this completely editable template. It is available for immediate download depending on the needs and requirements of the user.
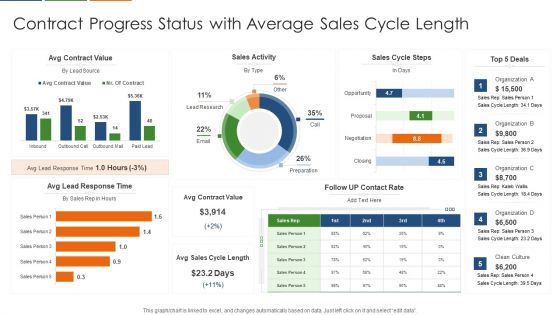
Contract Progress Status With Average Sales Cycle Length Topics PDF
Pitch your topic with ease and precision using this Contract Progress Status With Average Sales Cycle Length Topics PDF This layout presents information on Contract Value, Sales Activity, Sales Cycle It is also available for immediate download and adjustment. So, changes can be made in the color, design, graphics or any other component to create a unique layout.
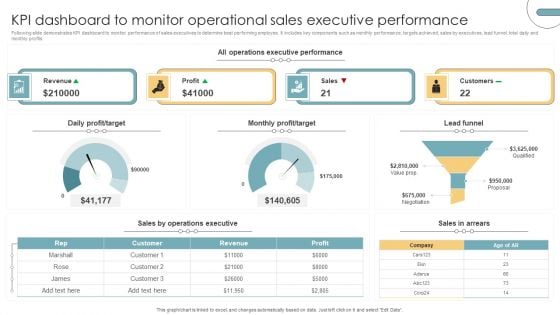
KPI Dashboard To Monitor Operational Sales Executive Performance Portrait PDF
Following slide demonstrates KPI dashboard to monitor performance of sales executives to determine best performing employee. It includes key components such as monthly performance, targets achieved, sales by executives, lead funnel, total daily and monthly profits. Pitch your topic with ease and precision using this KPI Dashboard To Monitor Operational Sales Executive Performance Portrait PDF. This layout presents information on Revenue, Profit, Sales, Customers. It is also available for immediate download and adjustment. So, changes can be made in the color, design, graphics or any other component to create a unique layout.
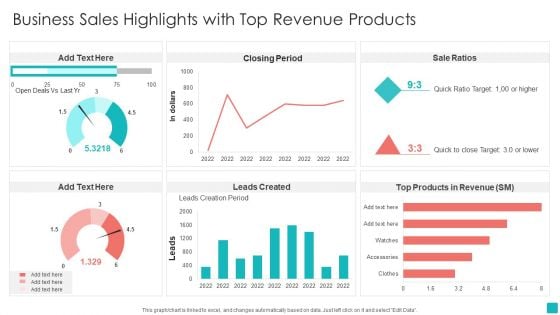
Business Sales Highlights With Top Revenue Products Designs PDF
Showcasing this set of slides titled Business Sales Highlights With Top Revenue Products Designs PDF. The topics addressed in these templates are Sale Ratios, Quick Ratio Target, Revenue. All the content presented in this PPT design is completely editable. Download it and make adjustments in color, background, font etc. as per your unique business setting.
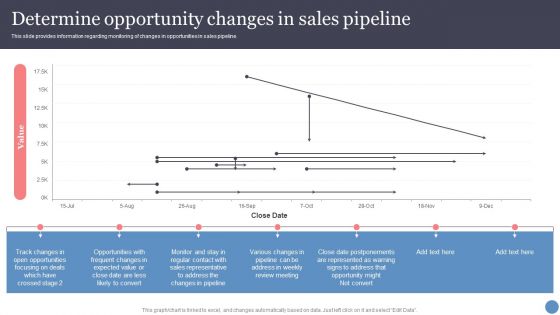
Determine Opportunity Changes In Sales Pipeline Portrait PDF
This slide provides information regarding monitoring of changes in opportunities in sales pipeline. Deliver and pitch your topic in the best possible manner with this Determine Opportunity Changes In Sales Pipeline Portrait PDF. Use them to share invaluable insights on Opportunities, Sales Representative, Date Postponements and impress your audience. This template can be altered and modified as per your expectations. So, grab it now.
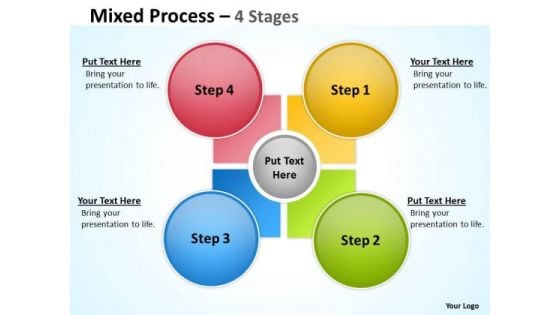
Business Diagram Mixed Process 4 Step For Sales Strategic Management
Get The Doers Into Action. Activate Them With Our Business Diagram Mixed Process 4 Step For Sales Strategic Management Powerpoint Templates.
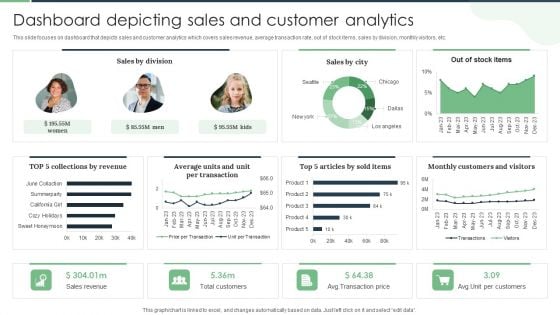
Dashboard Depicting Sales And Customer Analytics Professional PDF
This slide focuses on dashboard that depicts sales and customer analytics which covers sales revenue, average transaction rate, out of stock items, sales by division, monthly visitors, etc. Make sure to capture your audiences attention in your business displays with our gratis customizable Dashboard Depicting Sales And Customer Analytics Professional PDF. These are great for business strategies, office conferences, capital raising or task suggestions. If you desire to acquire more customers for your tech business and ensure they stay satisfied, create your own sales presentation with these plain slides.
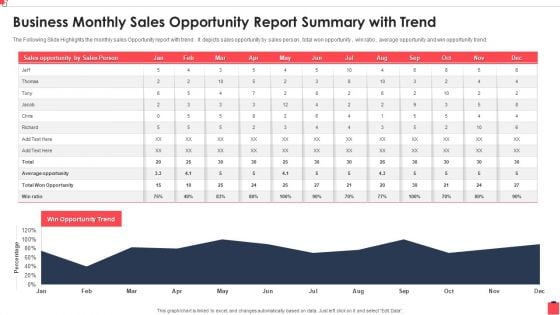
Business Monthly Sales Opportunity Report Summary With Trend Professional PDF
The Following Slide Highlights the monthly sales Opportunity report with trend . It depicts sales opportunity by sales person , total won opportunity , win ratio , average opportunity and win opportunity trend.Showcasing this set of slides titled Business Monthly Sales Opportunity Report Summary With Trend Professional PDF The topics addressed in these templates are Average Opportunity, Won Opportunity, Sales Opportunity All the content presented in this PPT design is completely editable. Download it and make adjustments in color, background, font etc. as per your unique business setting.
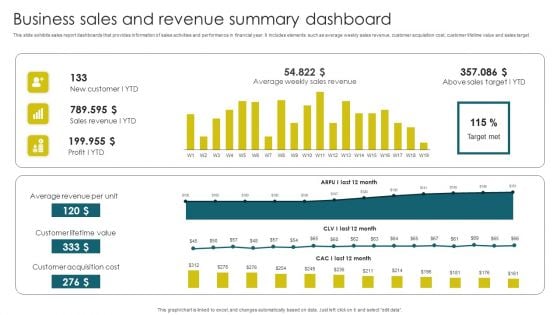
Business Sales And Revenue Summary Dashboard Brochure PDF
This slide exhibits sales report dashboards that provides information of sales activities and performance in financial year. It includes elements such as average weekly sales revenue, customer acquisition cost, customer lifetime value and sales target. Pitch your topic with ease and precision using this Business Sales And Revenue Summary Dashboard Brochure PDF. This layout presents information on Average Revenue, Customer Lifetime, Customer Acquisition. It is also available for immediate download and adjustment. So, changes can be made in the color, design, graphics or any other component to create a unique layout.
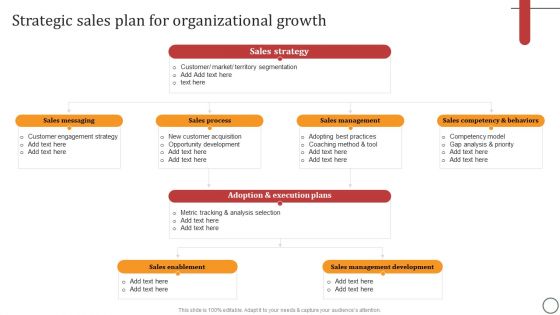
Strategic Sales Plan For Organizational Growth Diagrams PDF
Make sure to capture your audiences attention in your business displays with our gratis customizable Strategic Sales Plan For Organizational Growth Diagrams PDF. These are great for business strategies, office conferences, capital raising or task suggestions. If you desire to acquire more customers for your tech business and ensure they stay satisfied, create your own sales presentation with these plain slides.
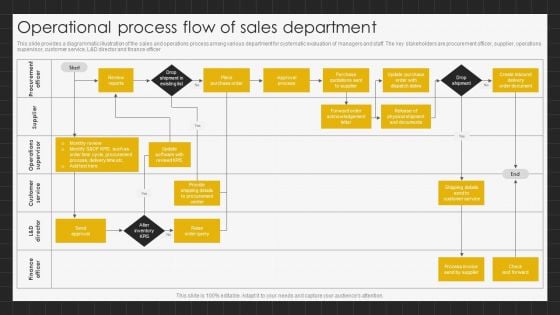
Operational Process Flow Of Sales Department Demonstration PDF
This slide provides a diagrammatic illustration of the sales and operations process among various department for systematic evaluation of managers and staff. The key stakeholders are procurement officer, supplier, operations supervisor, customer service, L and D director and finance officer.Presenting Operational Process Flow Of Sales Department Demonstration PDF to dispense important information. This template comprises one stage. It also presents valuable insights into the topics including Approval Process, Purchase Quotations, Customer Service. This is a completely customizable PowerPoint theme that can be put to use immediately. So, download it and address the topic impactfully.
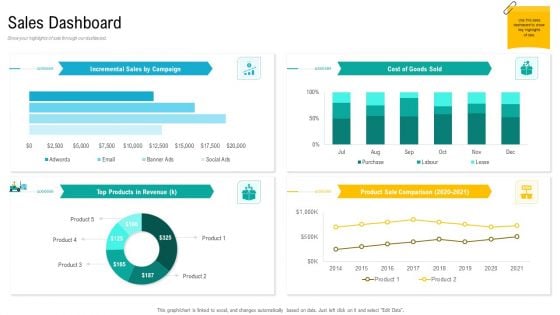
Product USP Sales Dashboard Ppt Inspiration Background Designs PDF
Show your highlights of sale through our dashboard. Deliver and pitch your topic in the best possible manner with this product usp sales dashboard ppt inspiration background designs pdf. Use them to share invaluable insights on product sale comparison, products in revenue, cost of goods sold and impress your audience. This template can be altered and modified as per your expectations. So, grab it now.
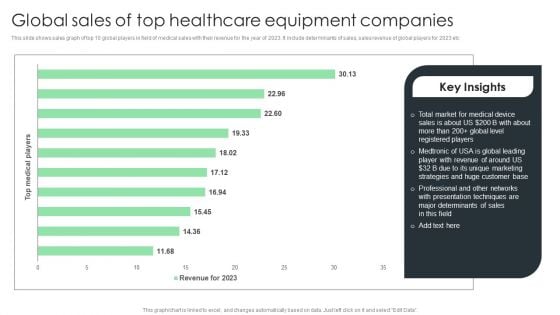
Global Sales Of Top Healthcare Equipment Companies Clipart PDF
This slide shows sales graph of top 10 global players in field of medical sales with their revenue for the year of 2023. It include determinants of sales, sales revenue of global players for 2023 etc. Showcasing this set of slides titled Global Sales Of Top Healthcare Equipment Companies Clipart PDF. The topics addressed in these templates are Total Market, Medical Device, Registered Players. All the content presented in this PPT design is completely editable. Download it and make adjustments in color, background, font etc. as per your unique business setting.
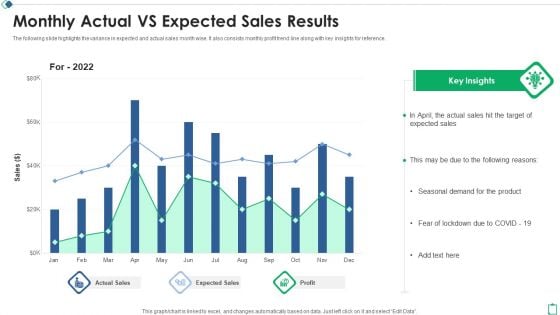
Monthly Actual Vs Expected Sales Results Ppt Show Deck PDF
The following slide highlights the variance in expected and actual sales month wise. It also consists monthly profit trend line along with key insights for reference. Showcasing this set of slides titled Monthly Actual Vs Expected Sales Results Ppt Show Deck PDF. The topics addressed in these templates are Target Expected Sales, Actual Sales Profit, Expected Sales 2022. All the content presented in this PPT design is completely editable. Download it and make adjustments in color, background, font etc. as per your unique business setting.
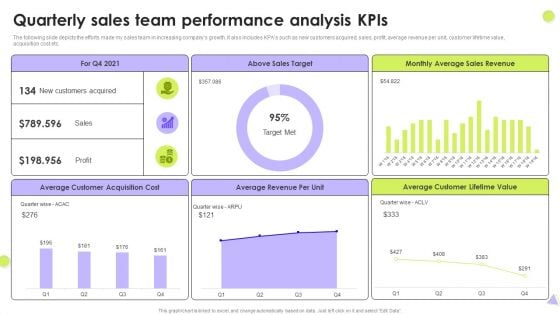
Quarterly Sales Team Performance Analysis Kpis Slides PDF
The following slide depicts the efforts made my sales team in increasing companys growth. It also includes KPAs such as new customers acquired, sales, profit, average revenue per unit, customer lifetime value, acquisition cost etc. Showcasing this set of slides titled Quarterly Sales Team Performance Analysis Kpis Slides PDF. The topics addressed in these templates are Above Sales Target, Average Sales Revenue, Average Customer. All the content presented in this PPT design is completely editable. Download it and make adjustments in color, background, font etc. as per your unique business setting.
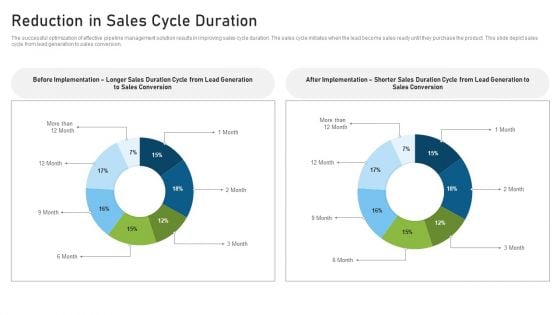
CRM Pipeline Administration Reduction In Sales Cycle Duration Formats PDF
The successful optimization of effective pipeline management solution results in improving sales cycle duration. The sales cycle initiates when the lead become sales ready until they purchase the product. This slide depict sales cycle from lead generation to sales conversion. Take your projects to the next level with our ultimate collection of CRM Pipeline Administration Reduction In Sales Cycle Duration Formats PDF. Slidegeeks has designed a range of layouts that are perfect for representing task or activity duration, keeping track of all your deadlines at a glance. Tailor these designs to your exact needs and give them a truly corporate look with your own brand colors theyll make your projects stand out from the rest.
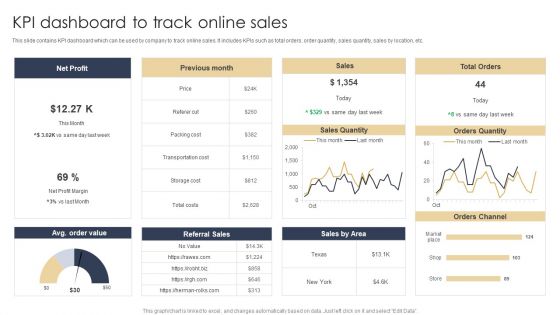
KPI Dashboard To Track Online Sales Structure PDF
This slide contains KPI dashboard which can be used by company to track online sales. It includes KPIs such as total orders, order quantity, sales quantity, sales by location, etc. Pitch your topic with ease and precision using this KPI Dashboard To Track Online Sales Structure PDF. This layout presents information on Net Profit, Sales, Orders Quantity. It is also available for immediate download and adjustment. So, changes can be made in the color, design, graphics or any other component to create a unique layout.
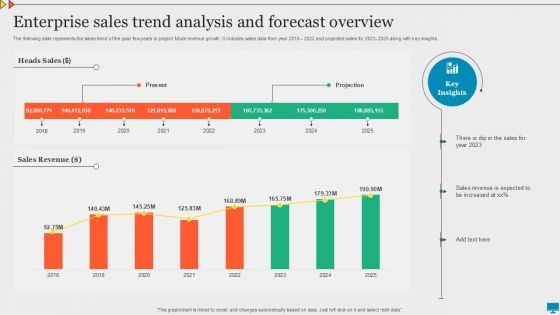
Enterprise Sales Trend Analysis And Forecast Overview Summary PDF
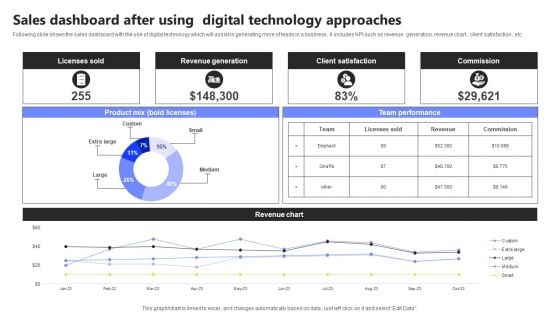
Sales Dashboard After Using Digital Technology Approaches Infographics PDF
Following slide shows the sales dashboard with the use of digital technology which will assist in generating more of leads in a business . It includes KPI such as revenue generation, revenue chart , client satisfaction , etc. Showcasing this set of slides titled Sales Dashboard After Using Digital Technology Approaches Infographics PDF. The topics addressed in these templates are Licenses Sold, Revenue Generation, Client Satisfaction. All the content presented in this PPT design is completely editable. Download it and make adjustments in color, background, font etc. as per your unique business setting.
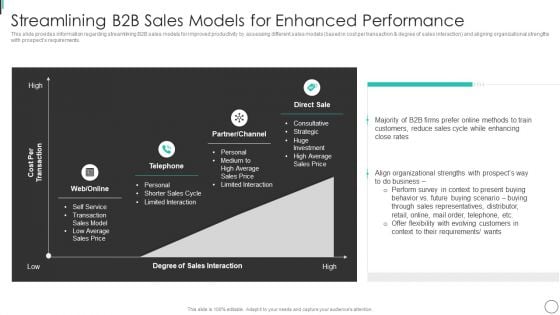
Streamlining B2B Sales Models For Enhanced Performance Portrait PDF
This slide provides information regarding streamlining B2B sales models for improved productivity by assessing different sales models based in cost per transaction degree of sales interaction and aligning organizational strengths with prospects requirements. Deliver and pitch your topic in the best possible manner with this Streamlining B2B Sales Models For Enhanced Performance Portrait PDF. Use them to share invaluable insights on Limited Interaction, Sales Interaction, Align Organizational and impress your audience. This template can be altered and modified as per your expectations. So, grab it now.
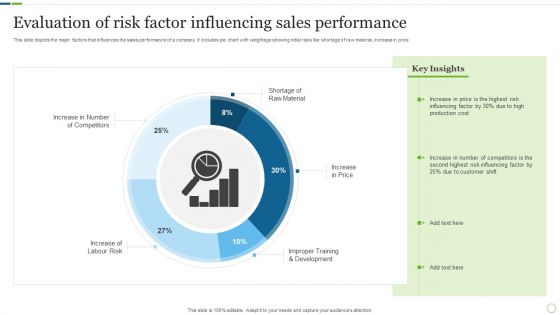
Evaluation Of Risk Factor Influencing Sales Performance Inspiration PDF
This slide depicts the major factors that influences the sales performance of a company. It includes pie chart with weightage showing initial risks like shortage of raw material, increase in price. Pitch your topic with ease and precision using this Evaluation Of Risk Factor Influencing Sales Performance Inspiration PDF. This layout presents information on Production Cost, Customer Shift, Risk Influencing. It is also available for immediate download and adjustment. So, changes can be made in the color, design, graphics or any other component to create a unique layout.
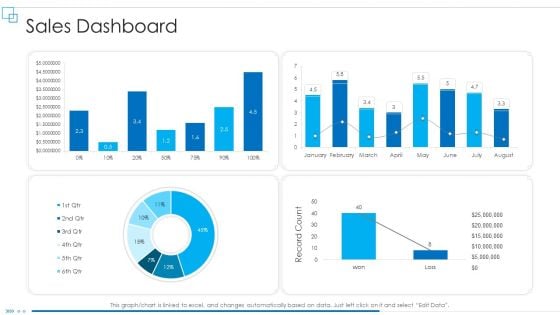
Business Scheme Management Synopsis Sales Dashboard Record Designs PDF
Deliver an awe inspiring pitch with this creative business scheme management synopsis sales dashboard record designs pdf bundle. Topics like sales dashboard can be discussed with this completely editable template. It is available for immediate download depending on the needs and requirements of the user.


 Continue with Email

 Home
Home


