Sales Performance Dashboard
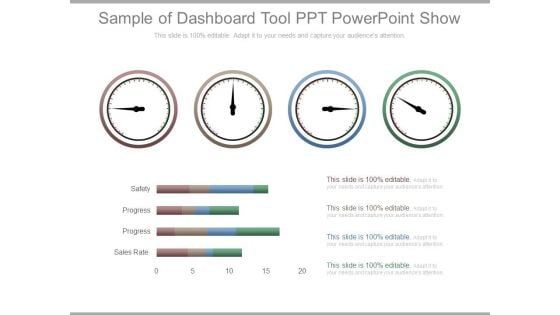
Sample Of Dashboard Tool Ppt Powerpoint Show
This is a sample of dashboard tool ppt powerpoint show. This is a four stage process. The stages in this process are safety, progress, sales rate.
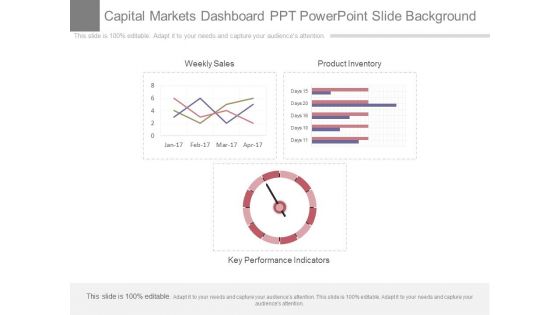
Capital Markets Dashboard Ppt Powerpoint Slide Background
This is a capital markets dashboard ppt powerpoint slide background. This is a three stage process. The stages in this process are weekly sales, product inventory, key performance indicators.
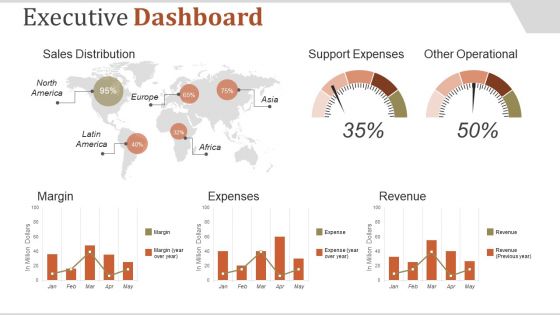
Executive Dashboard Ppt PowerPoint Presentation Introduction
This is a executive dashboard ppt powerpoint presentation introduction. This is a five stage process. The stages in this process are sales distribution, support expenses, other operational, margin, expenses.
Executive Dashboard Demo Ppt Powerpoint Slide Show
This is a executive dashboard demo ppt powerpoint slide show. This is a four stage process. The stages in this process are financial index, it system index, production index, sales index.

Dashboard Ppt PowerPoint Presentation Ideas Graphics Pictures
Presenting this set of slides with name dashboard ppt powerpoint presentation ideas graphics pictures. The topics discussed in these slides are ytd sales vs yr sm, net sales vs last yr sm, net sales vs last yr sm. This is a completely editable PowerPoint presentation and is available for immediate download. Download now and impress your audience.
Business Deal Performance Meter Vector Icon Ppt PowerPoint Presentation Infographic Template Graphic Images PDF
Presenting business deal performance meter vector icon ppt powerpoint presentation infographic template graphic images pdf to dispense important information. This template comprises three stages. It also presents valuable insights into the topics including business deal performance meter vector icon. This is a completely customizable PowerPoint theme that can be put to use immediately. So, download it and address the topic impactfully.
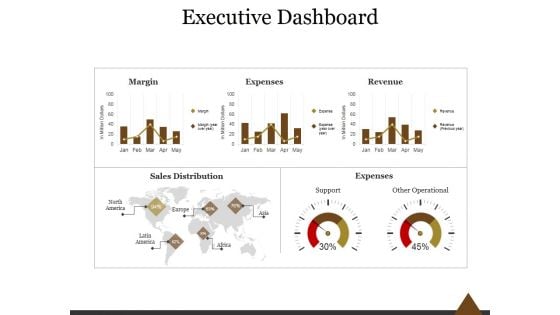
Executive Dashboard Ppt PowerPoint Presentation Professional
This is a executive dashboard ppt powerpoint presentation professional. This is a five stage process. The stages in this process are margin, expenses, revenue, sales distribution, expenses, support, other operational.
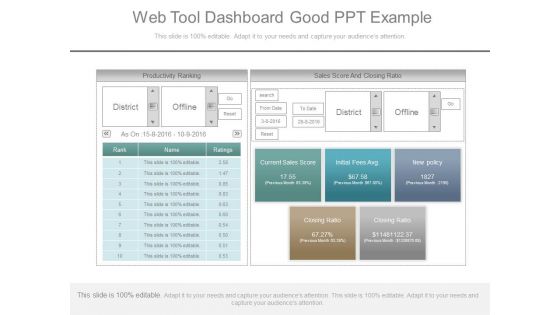
Web Tool Dashboard Good Ppt Example
This is a web tool dashboard good ppt example. This is a two stage process. The stages in this process are productivity ranking, district, offline, go, reset, rank, name, ratings, sales score and closing ratio, search, from date, to date, current sales score, initial fees avg, new policy, previous month, closing ratio, as on.
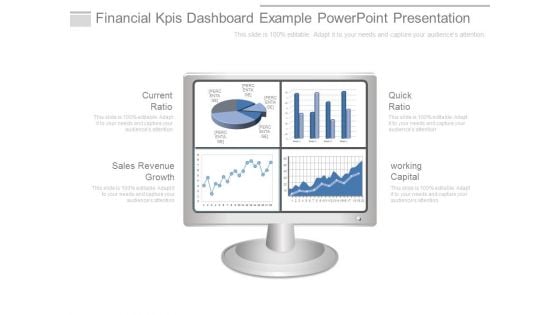
Financial Kpis Dashboard Example Powerpoint Presentation
This is a financial kpis dashboard example powerpoint presentation. This is a four stage process. The stages in this process are current ratio, sales revenue growth, quick ratio, working capital.
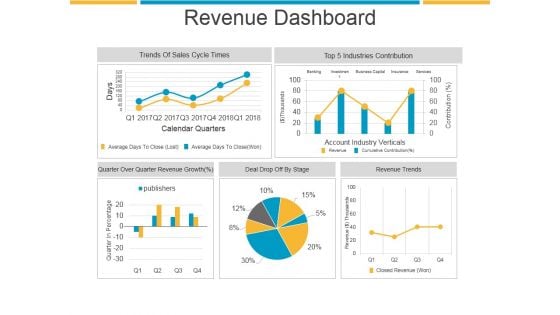
Revenue Dashboard Ppt PowerPoint Presentation Sample
This is a revenue dashboard ppt powerpoint presentation sample. This is a five stage process. The stages in this process are trends of sales cycle times, industries contribution, revenue trends, deal drop off by stage.
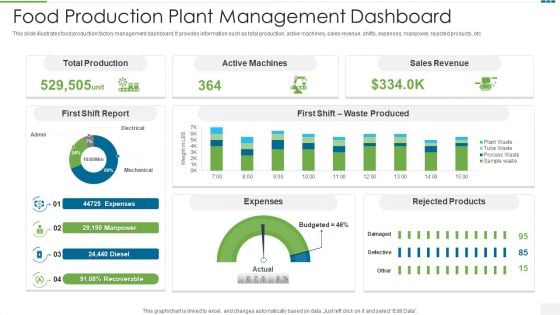
Food Production Plant Management Dashboard Clipart PDF
This slide illustrates food production factory management dashboard. It provides information such as total production, active machines, sales revenue, shifts, expenses, manpower, rejected products, etc.Pitch your topic with ease and precision using this food production plant management dashboard clipart pdf This layout presents information on total production, active machines, sales revenue It is also available for immediate download and adjustment. So, changes can be made in the color, design, graphics or any other component to create a unique layout.
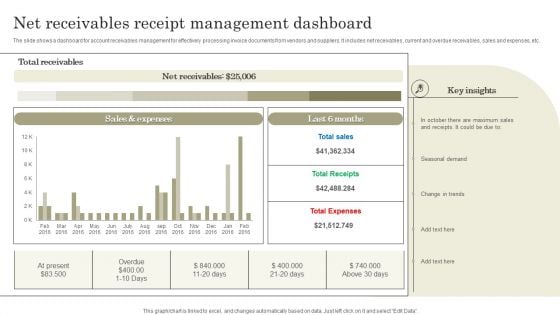
Net Receivables Receipt Management Dashboard Information PDF
The slide shows a dashboard for account receivables management for effectively processing invoice documents from vendors and suppliers. It includes net receivables, current and overdue receivables, sales and expenses, etc. Showcasing this set of slides titled Net Receivables Receipt Management Dashboard Information PDF. The topics addressed in these templates are Total sales, Total Receipts, Total Expenses. All the content presented in this PPT design is completely editable. Download it and make adjustments in color, background, font etc. as per your unique business setting.
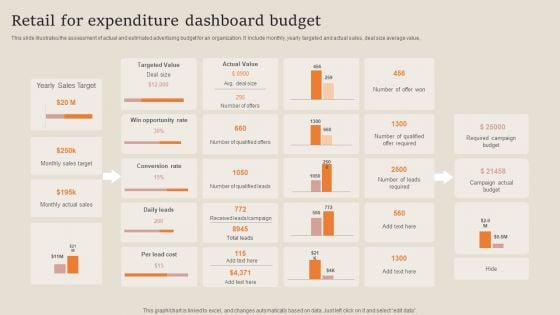
Retail For Expenditure Dashboard Budget Designs PDF
This slide illustrates the assessment of actual and estimated advertising budget for an organization. It include monthly, yearly targeted and actual sales, deal size average value, Showcasing this set of slides titled Retail For Expenditure Dashboard Budget Designs PDF. The topics addressed in these templates are Sales Target, Opportunity Rate, Required Campaign Budget. All the content presented in this PPT design is completely editable. Download it and make adjustments in color, background, font etc. as per your unique business setting.
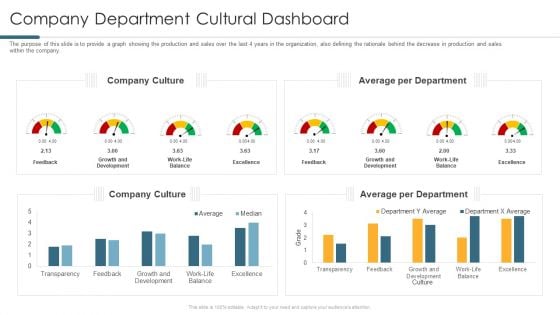
Company Department Cultural Dashboard Formats PDF
The purpose of this slide is to provide a graph showing the production and sales over the last 4 years in the organization, also defining the rationale behind the decrease in production and sales within the company. Deliver an awe inspiring pitch with this creative company department cultural dashboard formats pdf bundle. Topics like average per department, company culture can be discussed with this completely editable template. It is available for immediate download depending on the needs and requirements of the user.
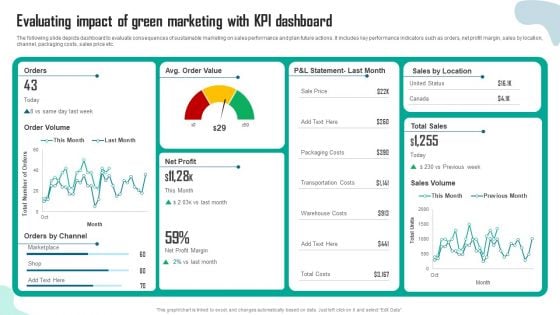
Evaluating Impact Of Green Marketing With Kpi Dashboard Inspiration PDF
The following slide depicts dashboard to evaluate consequences of sustainable marketing on sales performance and plan future actions. It includes key performance indicators such as orders, net profit margin, sales by location, channel, packaging costs, sales price etc. This Evaluating Impact Of Green Marketing With Kpi Dashboard Inspiration PDF from Slidegeeks makes it easy to present information on your topic with precision. It provides customization options, so you can make changes to the colors, design, graphics, or any other component to create a unique layout. It is also available for immediate download, so you can begin using it right away. Slidegeeks has done good research to ensure that you have everything you need to make your presentation stand out. Make a name out there for a brilliant performance.
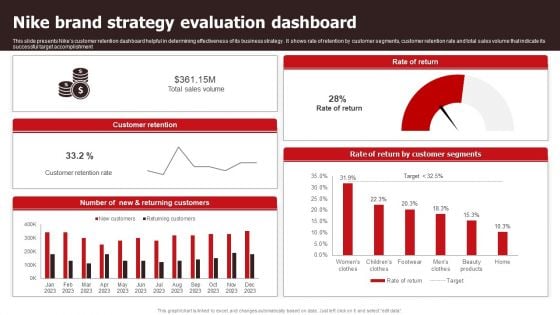
Nike Brand Strategy Evaluation Dashboard Sample PDF
This slide presents Nikes customer retention dashboard helpful in determining effectiveness of its business strategy . It shows rate of retention by customer segments, customer retention rate and total sales volume that indicate its successful target accomplishment. Showcasing this set of slides titled Nike Brand Strategy Evaluation Dashboard Sample PDF. The topics addressed in these templates are Sales Volume, Customer Retention Rate . All the content presented in this PPT design is completely editable. Download it and make adjustments in color, background, font etc. as per your unique business setting.
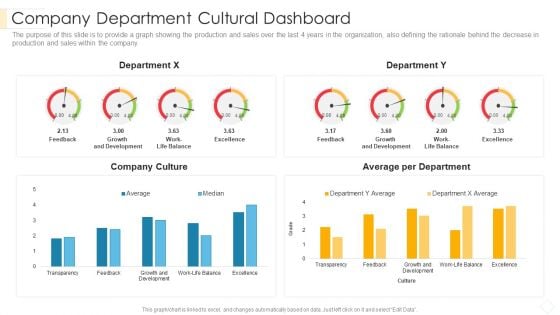
Company Department Cultural Dashboard Pictures PDF
The purpose of this slide is to provide a graph showing the production and sales over the last 4 years in the organization, also defining the rationale behind the decrease in production and sales within the company.Deliver an awe inspiring pitch with this creative company department cultural dashboard pictures pdf bundle. Topics like company culture, average per department, growth and development can be discussed with this completely editable template. It is available for immediate download depending on the needs and requirements of the user.
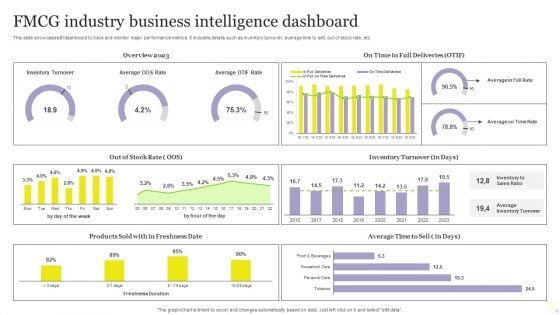
FMCG Industry Business Intelligence Dashboard Mockup PDF
This slide showcases BI dashboard to track and monitor major performance metrics. It includes details such as inventory turnover, average time to sell, out of stock rate, etc. Pitch your topic with ease and precision using this FMCG Industry Business Intelligence Dashboard Mockup PDF. This layout presents information on Average, Inventory Turnover, Business Intelligence Dashboard. It is also available for immediate download and adjustment. So, changes can be made in the color, design, graphics or any other component to create a unique layout.
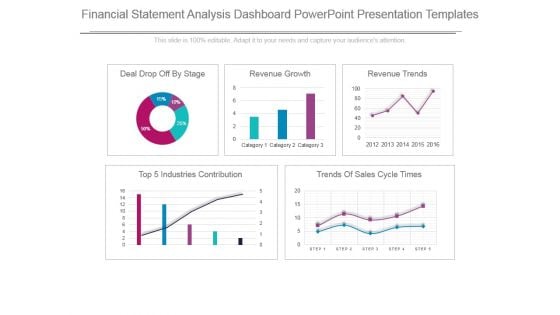
Financial Statement Analysis Dashboard Powerpoint Presentation Templates
This is a financial statement analysis dashboard powerpoint presentation templates. This is a five stage process. The stages in this process are deal drop off by stage, revenue growth, revenue trends, top 5 industries contribution, trends of sales cycle times, category.
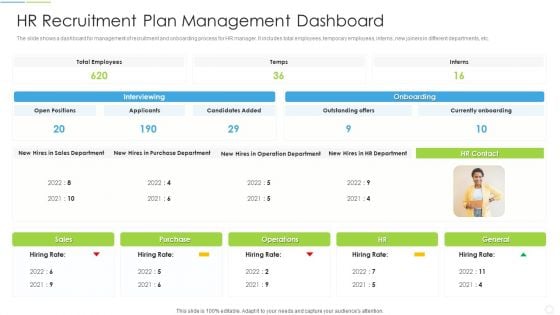
HR Recruitment Plan Management Dashboard Graphics PDF
Showcasing this set of slides titled HR Recruitment Plan Management Dashboard Graphics PDF The topics addressed in these templates are Interviewing, Currently Onboarding, Sales Department All the content presented in this PPT design is completely editable. Download it and make adjustments in color, background, font etc. as per your unique business setting.

Balance Scorecard Index Dashboard Ppt Slides
This is a balance scorecard index dashboard ppt slides. This is a one stage process. The stages in this process are sales by month, gross revenue, customer retention, executive scorecard, measures, status, trend, financial, option, customer, internal processes, learning and growth.
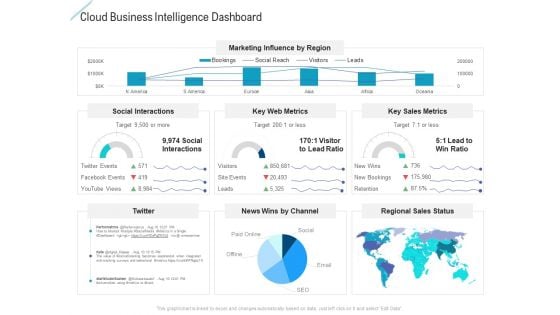
Cloud Business Intelligence Dashboard Graphics PDF
Deliver and pitch your topic in the best possible manner with this cloud business intelligence dashboard graphics pdf. Use them to share invaluable insights on social interactions, key web metrics, key sales metrics and impress your audience. This template can be altered and modified as per your expectations. So, grab it now.
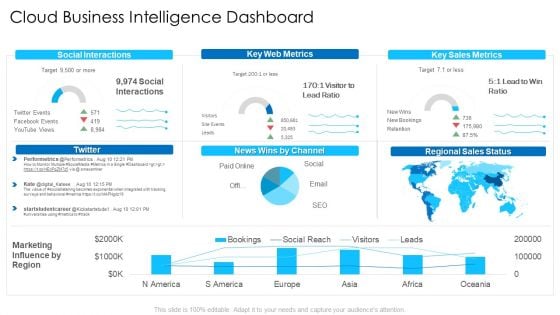
Cloud Business Intelligence Dashboard Microsoft PDF
Deliver an awe inspiring pitch with this creative cloud business intelligence dashboard microsoft pdf bundle. Topics like social interactions, key web metrics, regional sales status can be discussed with this completely editable template. It is available for immediate download depending on the needs and requirements of the user.
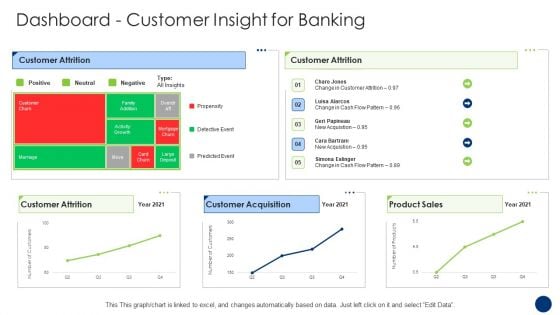
Dashboard Customer Insight For Banking Brochure PDF
Deliver and pitch your topic in the best possible manner with this dashboard customer insight for banking brochure pdf. Use them to share invaluable insights on customer attrition, customer acquisition, product sales and impress your audience. This template can be altered and modified as per your expectations. So, grab it now.
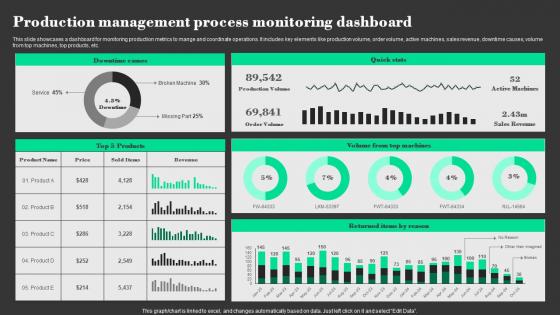
Production Management Process Monitoring Dashboard Designs Pdf
This slide showcases a dashboard for monitoring production metrics to mange and coordinate operations. It includes key elements like production volume, order volume, active machines, sales revenue, downtime causes, volume from top machines, top products, etc. Showcasing this set of slides titled Production Management Process Monitoring Dashboard Designs Pdf The topics addressed in these templates are Downtime Causes, Products, Volume From Top Machines All the content presented in this PPT design is completely editable. Download it and make adjustments in color, background, font etc. as per your unique business setting. This slide showcases a dashboard for monitoring production metrics to mange and coordinate operations. It includes key elements like production volume, order volume, active machines, sales revenue, downtime causes, volume from top machines, top products, etc.
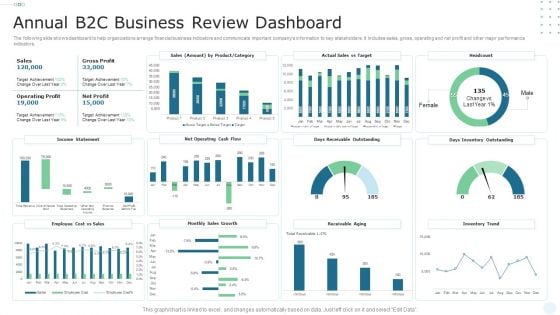
Annual B2C Business Review Dashboard Microsoft PDF
The following slide shows dashboard to help organizations arrange financial business indicators and communicate important companys information to key stakeholders. It includes sales, gross, operating and net profit and other major performance indicators. Showcasing this set of slides titled Annual B2C Business Review Dashboard Microsoft PDF. The topics addressed in these templates are Gross Profit, Sales, Operating Profit. All the content presented in this PPT design is completely editable. Download it and make adjustments in color, background, font etc. as per your unique business setting.
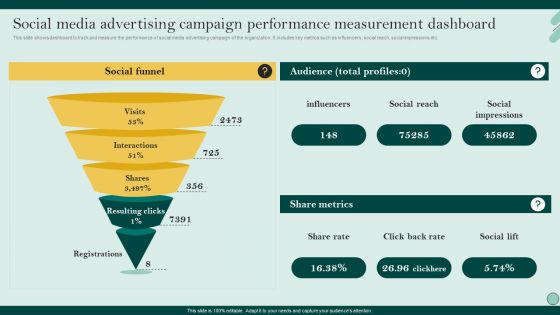
Social Networks Marketing To Improve Social Media Advertising Campaign Performance Topics PDF
This slide shows dashboard to track and measure the performance of social media advertising campaign of the organization. It includes key metrics such as influencers, social reach, social impressions etc. Find a pre-designed and impeccable Social Networks Marketing To Improve Social Media Advertising Campaign Performance Topics PDF. The templates can ace your presentation without additional effort. You can download these easy-to-edit presentation templates to make your presentation stand out from others. So, what are you waiting for Download the template from Slidegeeks today and give a unique touch to your presentation.
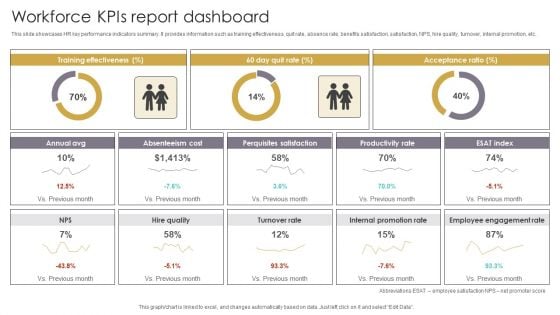
Workforce Kpis Report Dashboard Slides PDF
This slide showcases HR key performance indicators summary. It provides information such as training effectiveness, quit rate, absence rate, benefits satisfaction, satisfaction, NPS, hire quality, turnover, internal promotion, etc. Pitch your topic with ease and precision using this Workforce Kpis Report Dashboard Slides PDF. This layout presents information on Acceptance Ratio, Absenteeism Cost, Perquisites Satisfaction. It is also available for immediate download and adjustment. So, changes can be made in the color, design, graphics or any other component to create a unique layout.
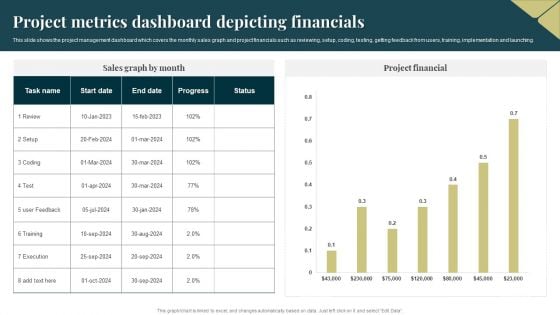
Project Metrics Dashboard Depicting Financials Pictures PDF
This slide shows the project management dashboard which covers the monthly sales graph and project financials such as reviewing, setup, coding, testing, getting feedback from users, training, implementation and launching. Pitch your topic with ease and precision using this Project Metrics Dashboard Depicting Financials Pictures PDF. This layout presents information on Execution, Project Financial. It is also available for immediate download and adjustment. So, changes can be made in the color, design, graphics or any other component to create a unique layout.
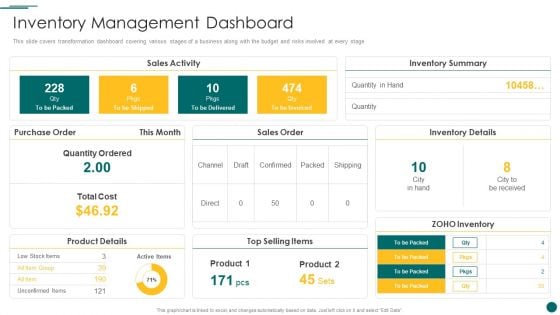
Organization Reinvention Inventory Management Dashboard Microsoft PDF
This slide covers transformation dashboard covering various stages of a business along with the budget and risks involved at every stage Deliver an awe inspiring pitch with this creative Organization Reinvention Inventory Management Dashboard Microsoft PDF bundle. Topics like Sales Activity, Inventory Summary, Inventory Details can be discussed with this completely editable template. It is available for immediate download depending on the needs and requirements of the user.
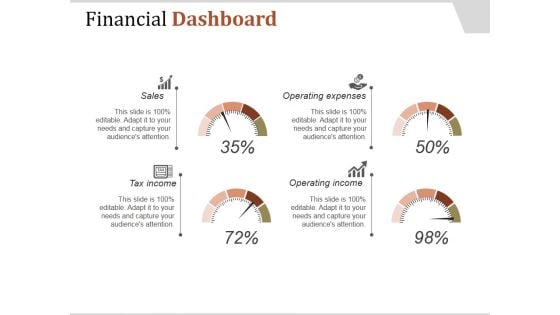
Financial Dashboard Ppt PowerPoint Presentation Influencers
This is a financial dashboard ppt powerpoint presentation influencers. This is a four stage process. The stages in this process are sales, tax income, operating income, operating expenses.
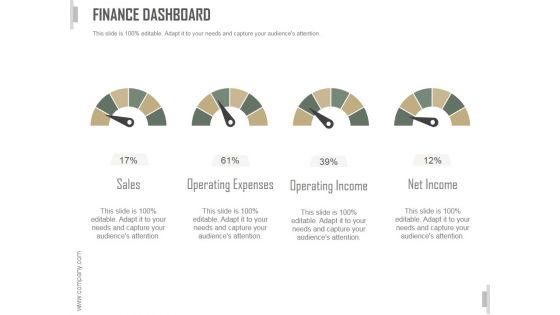
Finance Dashboard Ppt PowerPoint Presentation Clipart
This is a finance dashboard ppt powerpoint presentation clipart. This is a four stage process. The stages in this process are sales, operating expenses, operating income, net income.
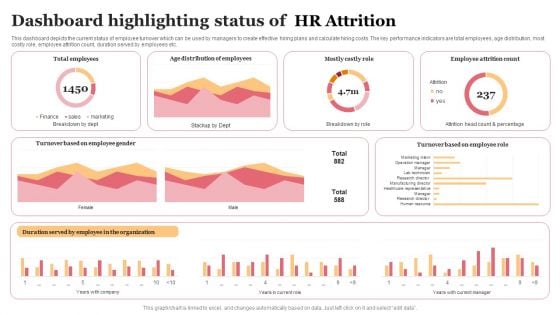
Dashboard Highlighting Status Of Clipart PDF
This dashboard depicts the current status of employee turnover which can be used by managers to create effective hiring plans and calculate hiring costs. The key performance indicators are total employees, age distribution, most costly role, employee attrition count, duration served by employees etc. Showcasing this set of slides titled Dashboard Highlighting Status Of Clipart PDF. The topics addressed in these templates are Dashboard Highlighting Status, HR Attrition. All the content presented in this PPT design is completely editable. Download it and make adjustments in color, background, font etc. as per your unique business setting.
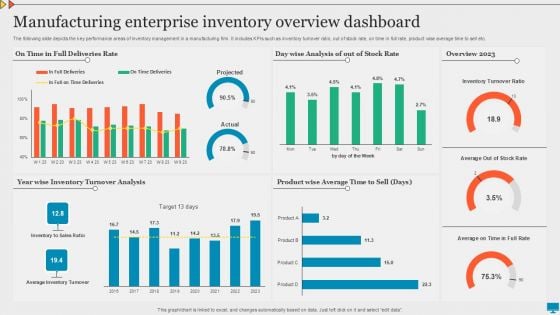
Manufacturing Enterprise Inventory Overview Dashboard Graphics PDF
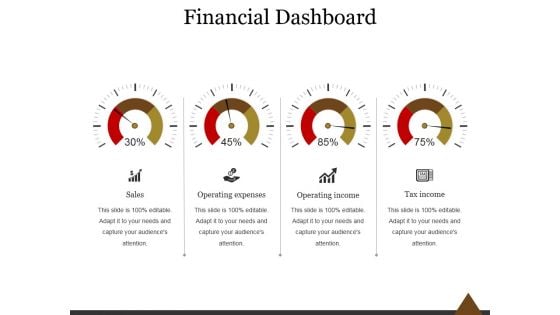
Financial Dashboard Ppt PowerPoint Presentation Information
This is a financial dashboard ppt powerpoint presentation information. This is a four stage process. The stages in this process are sales, operating expenses, operating income, tax income.

Sample Kpi Dashboard Ppt Sample Presentations
This is a sample kpi dashboard ppt sample presentations. This is a four stage process. The stages in this process are sales, market, budget, people.
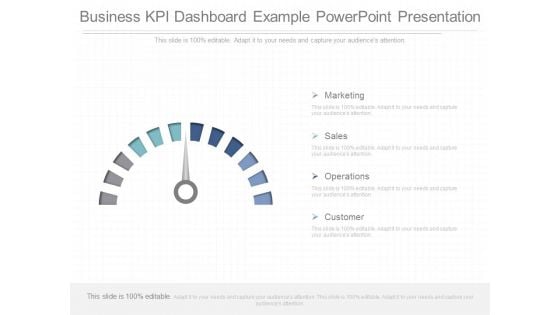
Business Kpi Dashboard Example Powerpoint Presentation
This is a business kpi dashboard example powerpoint presentation. This is a four stage process. The stages in this process are marketing, sales, operations, customer.
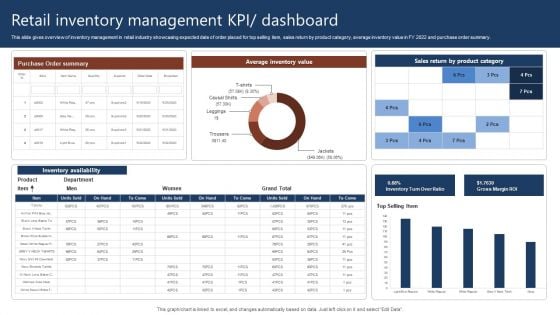
Retail Inventory Management Kpi Dashboard Rules PDF
This slide gives overview of inventory management in retail industry showcasing expected date of order placed for top selling item, sales return by product category, average inventory value in FY 2022 and purchase order summary. Pitch your topic with ease and precision using this Retail Inventory Management Kpi Dashboard Rules PDF. This layout presents information on Retail Inventory Management, Dashboard. It is also available for immediate download and adjustment. So, changes can be made in the color, design, graphics or any other component to create a unique layout.
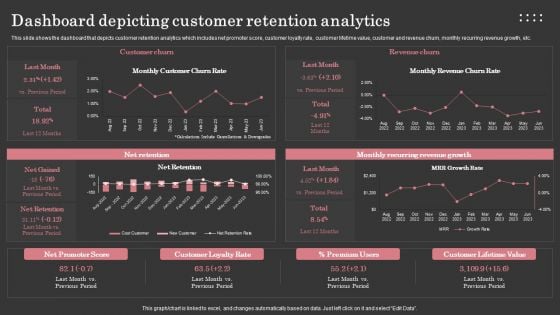
Dashboard Depicting Customer Retention Analytics Background PDF
This slide shows the dashboard that depicts customer retention analytics which includes net promoter score, customer loyalty rate, customer lifetime value, customer and revenue churn, monthly recurring revenue growth, etc. Make sure to capture your audiences attention in your business displays with our gratis customizable Dashboard Depicting Customer Retention Analytics Background PDF. These are great for business strategies, office conferences, capital raising or task suggestions. If you desire to acquire more customers for your tech business and ensure they stay satisfied, create your own sales presentation with these plain slides.
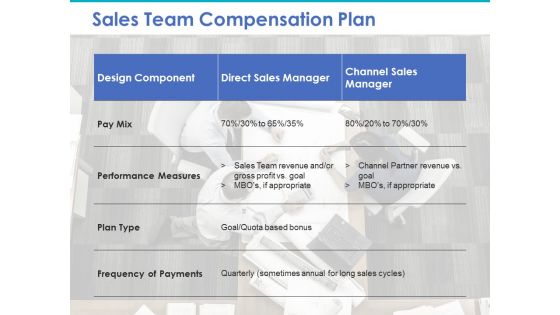
Sales Team Compensation Plan Ppt PowerPoint Presentation Outline Example File
This is a sales team compensation plan ppt powerpoint presentation outline example file. This is a three stage process. The stages in this process are design component, direct sales manager, channel sales manager, pay mix, performance measures.
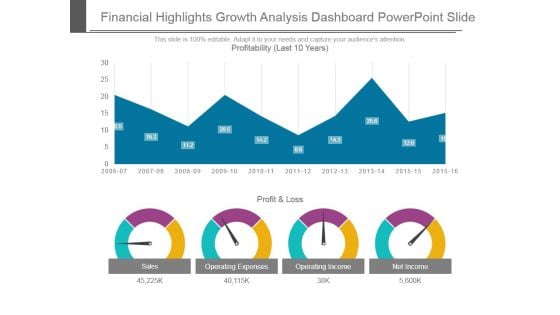
Financial Highlights Growth Analysis Dashboard Powerpoint Slide
This is a financial highlights growth analysis dashboard powerpoint slide. This is a four stage process. The stages in this process are profit and loss, sales, operating expenses, operating income, net income, profitability.
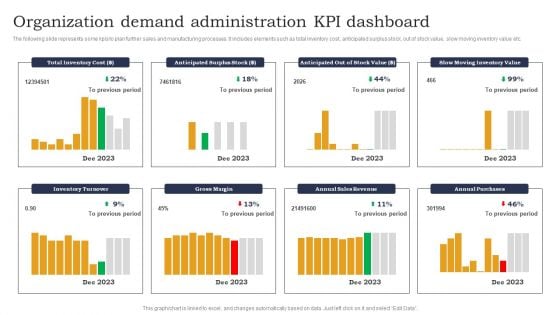
Organization Demand Administration KPI Dashboard Designs PDF
The following slide represents some kpis to plan further sales and manufacturing processes. It includes elements such as total inventory cost, anticipated surplus stock, out of stock value, slow moving inventory value etc. Pitch your topic with ease and precision using this Organization Demand Administration KPI Dashboard Designs PDF. This layout presents information on Anticipated Surplus Stock, Out Of Stock, Slow Moving Inventory. It is also available for immediate download and adjustment. So, changes can be made in the color, design, graphics or any other component to create a unique layout.
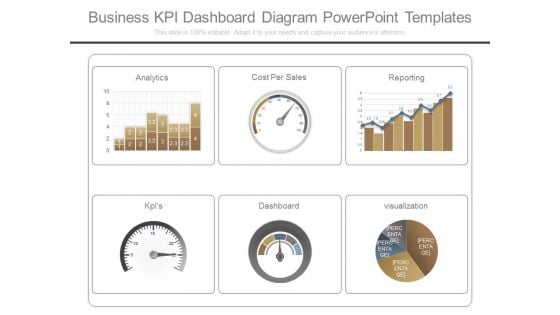
Business Kpi Dashboard Diagram Powerpoint Templates
This is a business kpi dashboard diagram powerpoint templates. This is a six stage process. The stages in this process are analytics, cost per sales, reporting, kpis, dashboard, visualization.
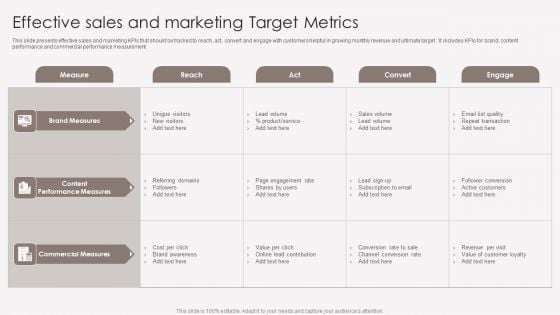
Effective Sales And Marketing Target Metrics Mockup PDF
This slide presents effective sales and marketing KPIs that should be tracked to reach, act, convert and engage with customers helpful in growing monthly revenue and ultimate target . It includes KPIs for brand, content performance and commercial performance measurement. Pitch your topic with ease and precision using this Effective Sales And Marketing Target Metrics Mockup PDF. This layout presents information on Brand Measures, Content Performance Measures, Commercial Measures. It is also available for immediate download and adjustment. So, changes can be made in the color, design, graphics or any other component to create a unique layout.

Sales Facilitation Partner Management Partner Scoreboard Summary Report Clipart PDF
This slide covers the partner scoreboard report which Is evaluated based on their performance and overall scores. Deliver and pitch your topic in the best possible manner with this sales facilitation partner management partner scoreboard summary report clipart pdf. Use them to share invaluable insights on performance, marketing, sales, capabilities, target and impress your audience. This template can be altered and modified as per your expectations. So, grab it now.
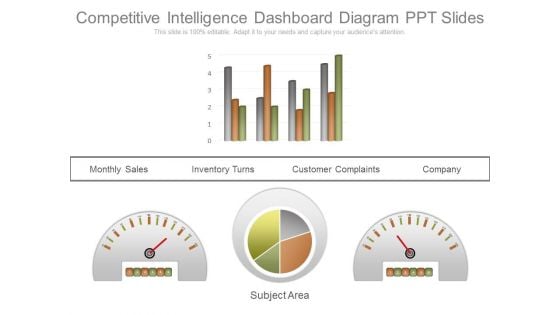
Competitive Intelligence Dashboard Diagram Ppt Slides
This is a competitive intelligence dashboard diagram ppt slides. This is a four stage process. The stages in this process are monthly sales, inventory turns, customer complaints, company, subject area.
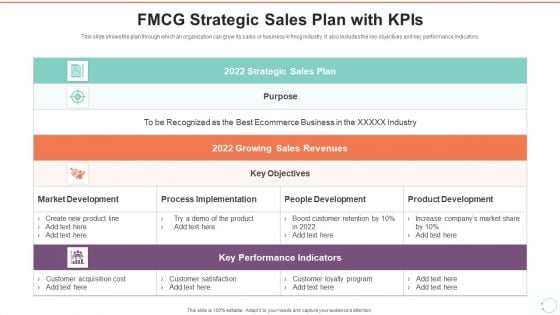
FMCG Strategic Sales Plan With Kpis Template PDF
This slide shows the plan through which an organization can grow its sales or business in fmcg industry. It also includes the key objectives and key performance indicators. Showcasing this set of slides titled FMCG Strategic Sales Plan With Kpis Template PDF The topics addressed in these templates are Strategic Sales Plan, Growing Sales Revenues, Key Performance Indicators All the content presented in this PPT design is completely editable. Download it and make adjustments in color, background, font etc. as per your unique business setting.
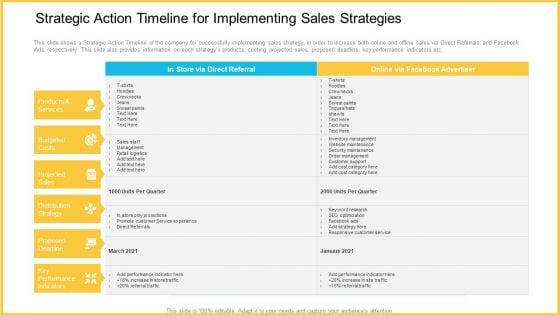
Strategic Action Timeline For Implementing Sales Strategies Infographics PDF
This slide shows a Strategic Action Timeline of the company for successfully implementing sales strategy, in order to increase both online and offline sales via Direct Referrals and Facebook Ads, respectively. This slide also provides information on each strategys products, costing, projected sales, proposed deadline, key performance indicators etc. Deliver an awe-inspiring pitch with this creative strategic action timeline for implementing sales strategies infographics pdf. bundle. Topics like budgeted costs, projected sales, distribution strategy, proposed deadline, key performance indicators can be discussed with this completely editable template. It is available for immediate download depending on the needs and requirements of the user.
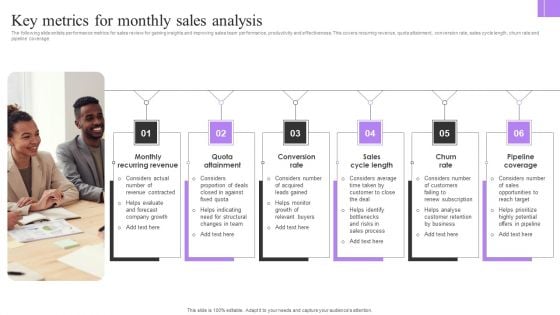
Key Metrics For Monthly Sales Analysis Mockup PDF
The following slide enlists performance metrics for sales review for gaining insights and improving sales team performance, productivity and effectiveness. This covers recurring revenue, quota attainment, conversion rate, sales cycle length, churn rate and pipeline coverage. Presenting Key Metrics For Monthly Sales Analysis Mockup PDF to dispense important information. This template comprises six stages. It also presents valuable insights into the topics including Monthly Recurring Revenue, Quota Attainment, Conversion Rate . This is a completely customizable PowerPoint theme that can be put to use immediately. So, download it and address the topic impactfully.
Sales Management Needs Analysis Solution Design Ppt Sample
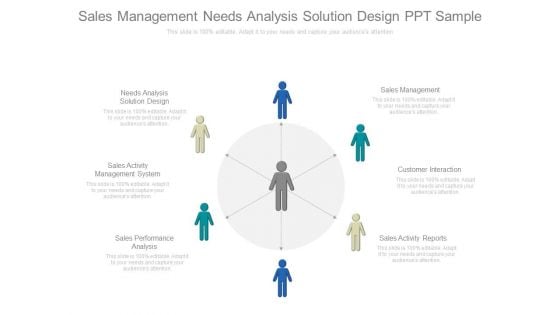
This is a sales management needs analysis solution design ppt sample. This is a six stage process. The stages in this process are needs analysis solution design, sales activity management system, sales performance analysis, sales management, customer interaction, sales activity reports.
Key Metrics To Measure Sales Market Evaluation Portrait Pdf
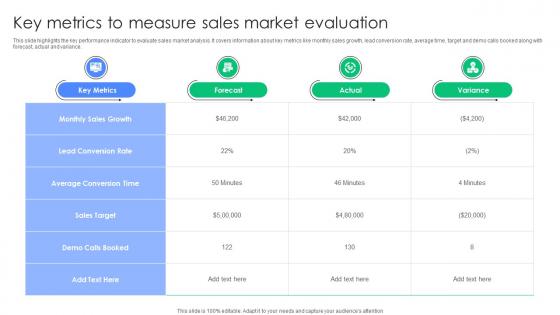
This slide highlights the key performance indicator to evaluate sales market analysis. It covers information about key metrics like monthly sales growth, lead conversion rate, average time, target and demo calls booked along with forecast, actual and variance. Showcasing this set of slides titled Key Metrics To Measure Sales Market Evaluation Portrait Pdf. The topics addressed in these templates are Monthly Sales Growth, Lead Conversion Rate, Sales Target. All the content presented in this PPT design is completely editable. Download it and make adjustments in color, background, font etc. as per your unique business setting. This slide highlights the key performance indicator to evaluate sales market analysis. It covers information about key metrics like monthly sales growth, lead conversion rate, average time, target and demo calls booked along with forecast, actual and variance.
Impact Of Sales Gap Analysis Recovery Plan Brochure PDF
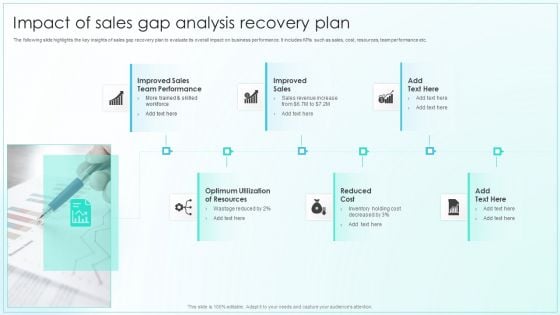
The following slide highlights the key insights of sales gap recovery plan to evaluate its overall impact on business performance. It includes KPIs such as sales, cost, resources, team performance etc. Presenting Impact Of Sales Gap Analysis Recovery Plan Brochure PDF to dispense important information. This template comprises six stages. It also presents valuable insights into the topics including Improved Sales, Reduced Cost, Optimum Utilization. This is a completely customizable PowerPoint theme that can be put to use immediately. So, download it and address the topic impactfully.
Kpis To Optimize For Overcoming Decline Of Sales Mockup PDF
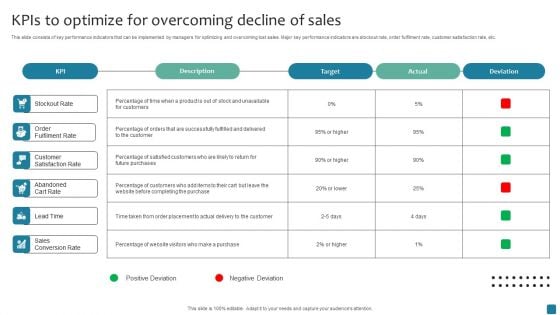
This slide consists of key performance indicators that can be implemented by managers for optimizing and overcoming lost sales. Major key performance indicators are stockout rate, order fulfilment rate, customer satisfaction rate, etc. Showcasing this set of slides titled Kpis To Optimize For Overcoming Decline Of Sales Mockup PDF. The topics addressed in these templates are Target, Actual, Deviation. All the content presented in this PPT design is completely editable. Download it and make adjustments in color, background, font etc. as per your unique business setting.
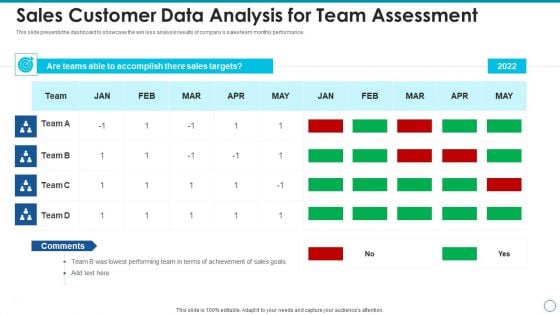
Sales Customer Data Analysis For Team Assessment Information PDF
This slide presents the dashboard to showcase the win loss analysis results of companys sales team monthly performance. Showcasing this set of slides titled sales customer data analysis for team assessment information pdf. The topics addressed in these templates are sales customer data analysis for team assessment. All the content presented in this PPT design is completely editable. Download it and make adjustments in color, background, font etc. as per your unique business setting.
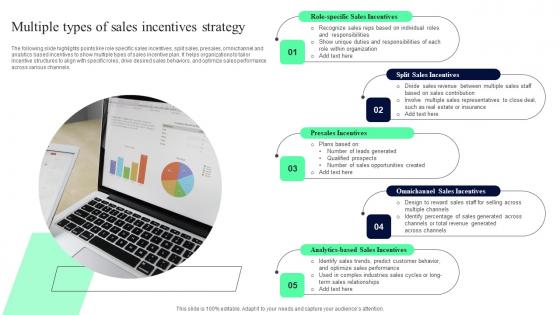
Multiple Types Of Sales Incentives Strategy Formats Pdf
The following slide highlights points like define objective and metrics, determine eligibility, target participants, design incentive structure, communicate and monitor plan to show key steps for effective sales incentive plan. It helps organization to drive motivation, improve sales performance, and achieve their business goals.Showcasing this set of slides titled Multiple Types Of Sales Incentives Strategy Formats Pdf The topics addressed in these templates are Presales Incentives, Omnichannel Sales Incentives, Sales Incentives All the content presented in this PPT design is completely editable. Download it and make adjustments in color, background, font etc. as per your unique business setting. The following slide highlights points like role specific sales incentives, split sales, presales, omnichannel and analytics based incentives to show multiple types of sales incentive plan. It helps organizations to tailor incentive structures to align with specific roles, drive desired sales behaviors, and optimize sales performance across various channels.
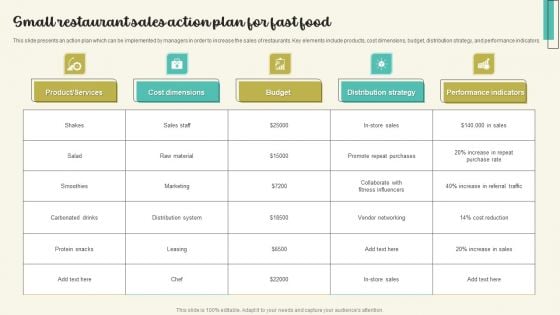
Small Restaurant Sales Action Plan For Fast Food Rules PDF
This slide presents an action plan which can be implemented by managers in order to increase the sales of restaurants. Key elements include products, cost dimensions, budget, distribution strategy, and performance indicators. Pitch your topic with ease and precision using this Small Restaurant Sales Action Plan For Fast Food Rules PDF. This layout presents information on Budget, Distribution Strategy, Performance Indicators. It is also available for immediate download and adjustment. So, changes can be made in the color, design, graphics or any other component to create a unique layout.
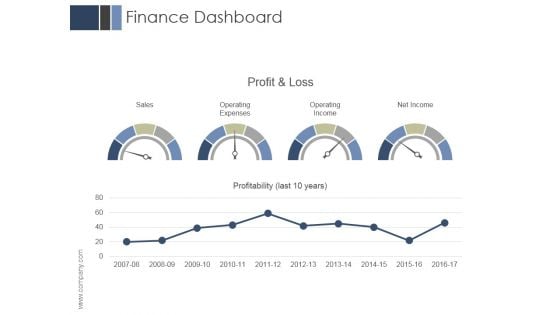
Finance Dashboard Ppt PowerPoint Presentation Design Ideas
This is a finance dashboard ppt powerpoint presentation design ideas. This is a two stage process. The stages in this process are sales, operating expenses, operating income, net income.
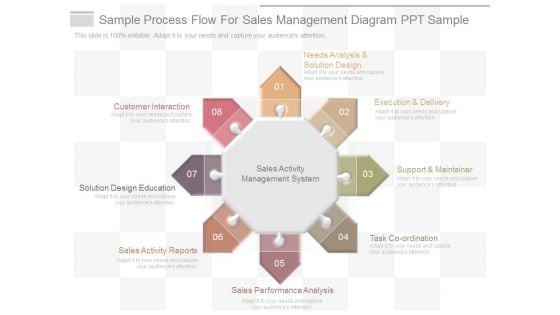
Sample Process Flow For Sales Management Diagram Ppt Sample
This is a sample process flow for sales management diagram ppt sample. This is a eight stage process. The stages in this process are needs analysis and solution design, execution and delivery, support and maintainer, task co ordination, sales performance analysis, sales activity reports, solution design education, customer interaction.
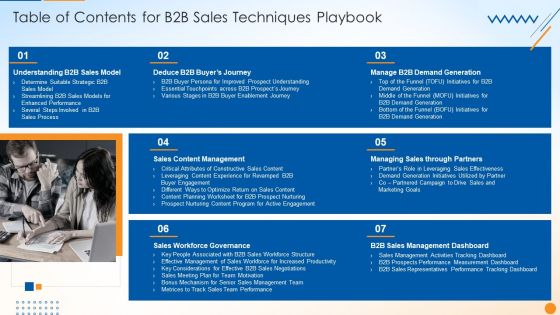
Table Of Contents For B2B Sales Techniques Playbook Microsoft PDF
Deliver an awe inspiring pitch with this creative Table Of Contents For B2B Sales Techniques Playbook Microsoft PDF bundle. Topics like Content Management, Workforce Governance, Management Dashboard can be discussed with this completely editable template. It is available for immediate download depending on the needs and requirements of the user.
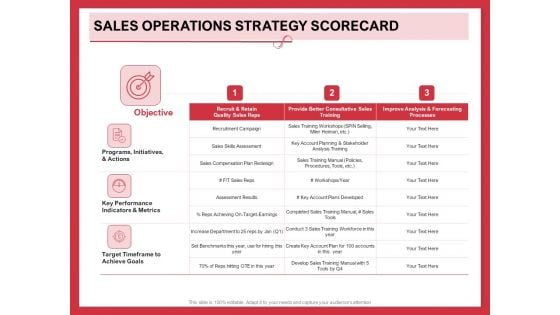
Implementing Compelling Marketing Channel Sales Operations Strategy Scorecard Pictures PDF
Presenting this set of slides with name implementing compelling marketing channel sales operations strategy scorecard pictures pdf. The topics discussed in these slides are objective, programs, initiatives, actions, key performance indicators and metrics, target timeframe to achieve goals. This is a completely editable PowerPoint presentation and is available for immediate download. Download now and impress your audience.


 Continue with Email

 Home
Home


