Sales Results
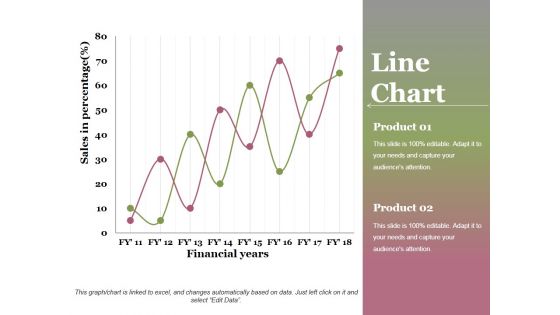
Line Chart Ppt PowerPoint Presentation Professional Graphics Design
This is a line chart ppt powerpoint presentation professional graphics design. This is a two stage process. The stages in this process are financial years, sales in percentage, product, growth, success.
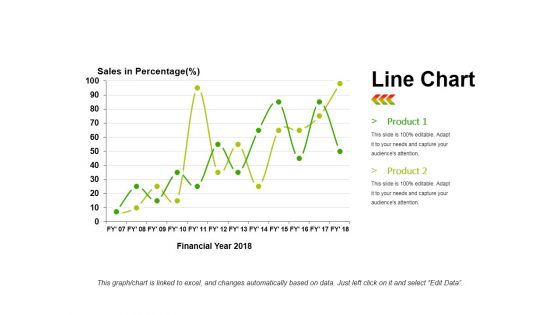
Line Chart Ppt PowerPoint Presentation Infographics Infographics
This is a line chart ppt powerpoint presentation infographics infographics. This is a two stage process. The stages in this process are product, sales in percentage, financial year, line chart, finance.
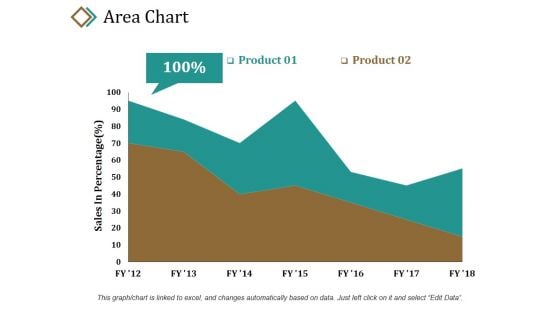
Area Chart Ppt PowerPoint Presentation Summary Example Introduction
This is a area chart ppt powerpoint presentation summary example introduction. This is a two stage process. The stages in this process are product, sales in percentage, percentage, area chart, business.
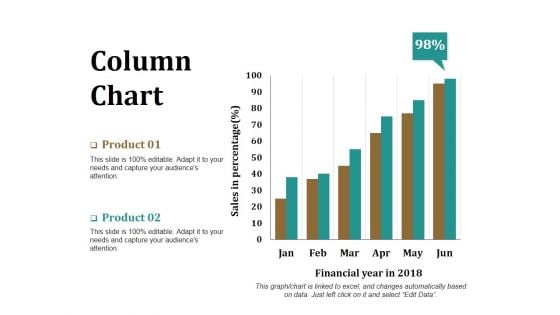
Column Chart Ppt PowerPoint Presentation Model Graphics Download
This is a column chart ppt powerpoint presentation model graphics download. This is a two stage process. The stages in this process are product, financial year, sales in percentage, bar graph, success.
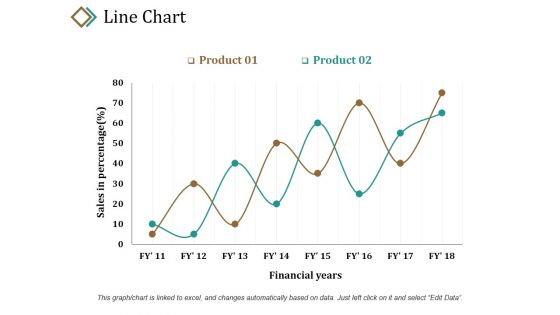
Line Chart Ppt PowerPoint Presentation Layouts Example
This is a line chart ppt powerpoint presentation layouts example. This is a two stage process. The stages in this process are sales in percentage, product, financial years, growth, success.
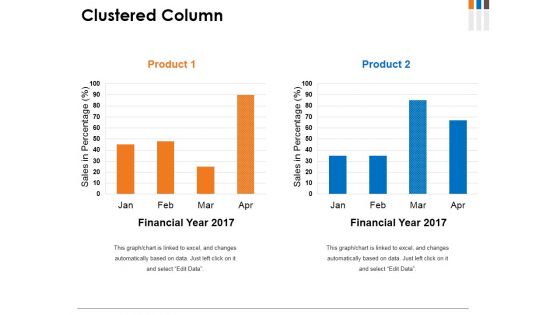
Clustered Column Ppt PowerPoint Presentation File Graphics
This is a clustered column ppt powerpoint presentation file graphics. This is a two stage process. The stages in this process are product, financial year, sales in percentage, graph, growth.
Area Chart Ppt PowerPoint Presentation Ideas Icon
This is a area chart ppt powerpoint presentation ideas icon. This is a two stage process. The stages in this process are product, area chart, sales in percentage, growth, success.
Bar Chart Ppt PowerPoint Presentation Icon Information
This is a bar chart ppt powerpoint presentation icon information. This is a one stage process. The stages in this process are product, sales in percentage, financial years, bar graph, growth.
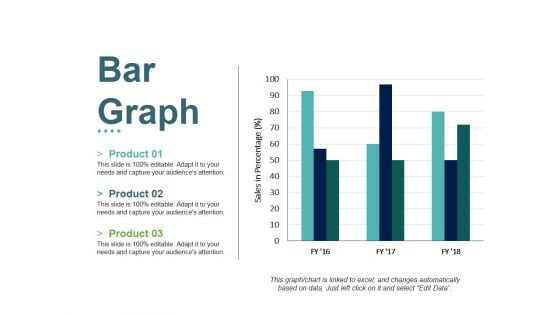
Bar Graph Ppt PowerPoint Presentation File Slides
This is a bar graph ppt powerpoint presentation file slides. This is a three stage process. The stages in this process are product, sales in percentage, bar graph, growth, success.
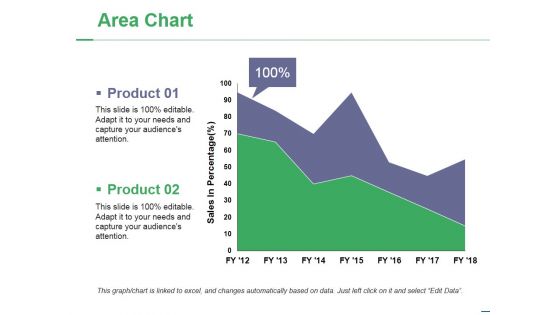
Area Chart Ppt PowerPoint Presentation Layouts Images
This is a area chart ppt powerpoint presentation layouts images. This is a two stage process. The stages in this process are product, sales in percentage, area chart, percentage, finance.

Line Chart Ppt PowerPoint Presentation Show Guide
This is a line chart ppt powerpoint presentation show guide. This is a two stage process. The stages in this process are product, sales in percentage, financial years, growth, success.
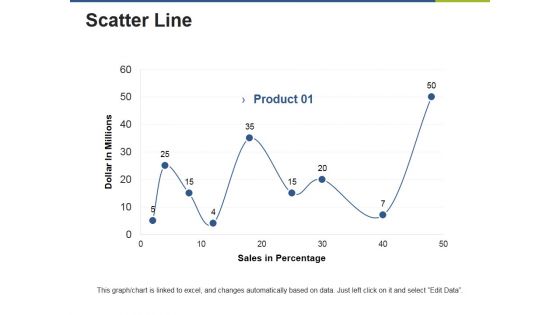
Scatter Line Ppt PowerPoint Presentation Gallery Clipart Images
This is a scatter line ppt powerpoint presentation gallery clipart images. This is a one stage process. The stages in this process are product, dollar in millions, sales in percentage.
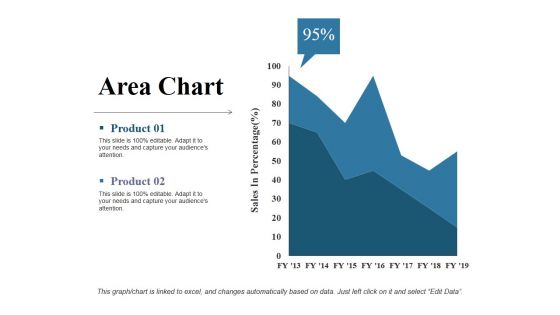
Area Chart Ppt PowerPoint Presentation Slides Example
This is a area chart ppt powerpoint presentation slides example. This is a two stage process. The stages in this process are sales in percentage, product, area chart, business, finance.
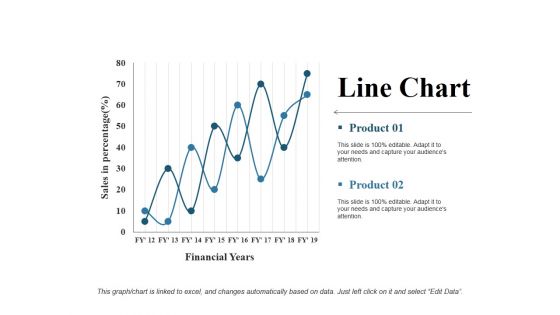
Line Chart Ppt PowerPoint Presentation Gallery Rules
This is a line chart ppt powerpoint presentation gallery rules. This is a two stage process. The stages in this process are financial years, product, sales in percentage, line chart, growth.
Scatter Line Chart Ppt PowerPoint Presentation Icon Files
This is a scatter line chart ppt powerpoint presentation icon files. This is a one stage process. The stages in this process are dollar in millions, product, sales in percentage.
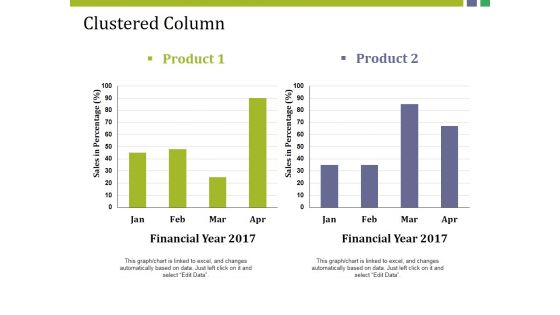
Clustered Column Ppt PowerPoint Presentation Gallery Structure
This is a clustered column ppt powerpoint presentation gallery structure. This is a two stage process. The stages in this process are product, sales in percentage, financial year, bar graph, finance.
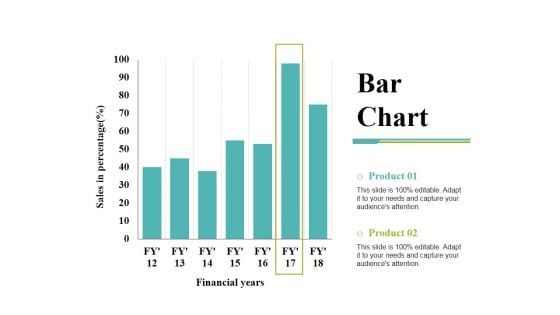
Bar Chart Ppt PowerPoint Presentation Inspiration Demonstration
This is a bar chart ppt powerpoint presentation inspiration demonstration. This is a two stage process. The stages in this process are bar chart, financial years, sales in percentage, product, finance.
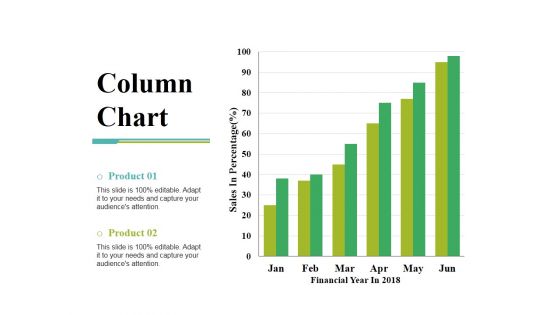
Column Chart Ppt PowerPoint Presentation Gallery Slide Portrait
This is a column chart ppt powerpoint presentation gallery slide portrait. This is a two stage process. The stages in this process are sales in percentage, financial year, product, bar graph, growth.
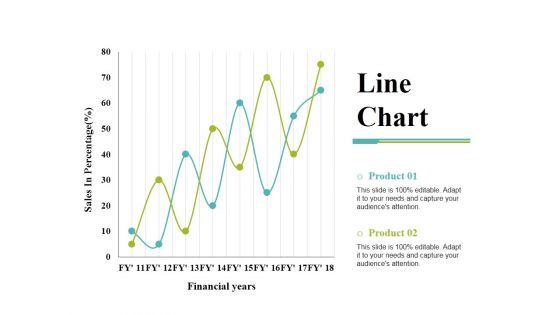
Line Chart Ppt PowerPoint Presentation Gallery Templates
This is a line chart ppt powerpoint presentation gallery templates. This is a two stage process. The stages in this process are product, financial years, sales in percentage, line chart.
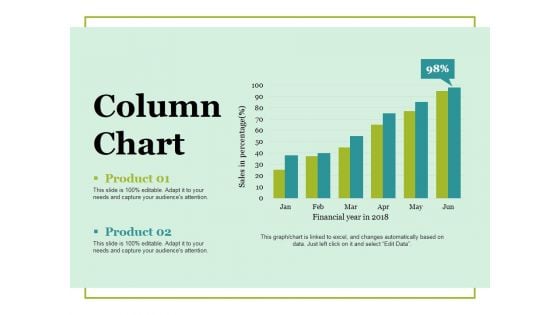
Column Chart Ppt PowerPoint Presentation Ideas Vector
This is a column chart ppt powerpoint presentation ideas vector. This is a two stage process. The stages in this process are column chart, product, financial years, sales in percentage, growth.

Scatter Line Ppt PowerPoint Presentation Professional Design Inspiration
This is a scatter line ppt powerpoint presentation professional design inspiration. This is a one stage process. The stages in this process are product, sales in percentage, dollar in millions.
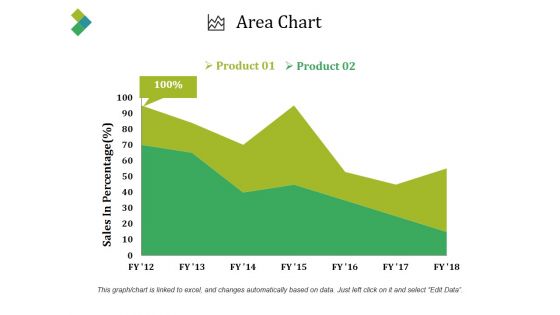
Area Chart Ppt PowerPoint Presentation Infographics Good
This is a area chart ppt powerpoint presentation infographics good. This is a two stage process. The stages in this process are sales in percentage, product, area chart, business, percentage.
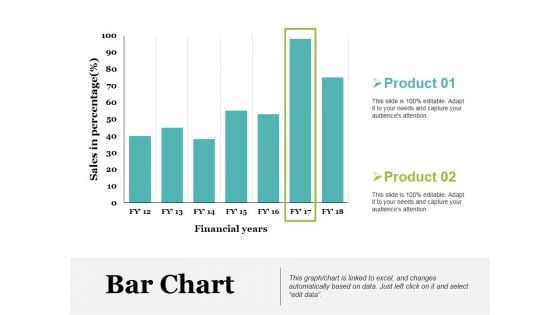
Bar Chart Ppt PowerPoint Presentation Model Picture
This is a bar chart ppt powerpoint presentation model picture. This is a two stage process. The stages in this process are product, sales in percentage, financial years, bar chart.
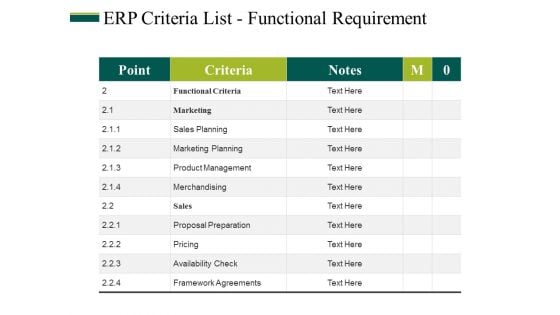
Erp Criteria List Functional Requirement Ppt PowerPoint Presentation Icon Gallery
This is a erp criteria list functional requirement ppt powerpoint presentation icon gallery. This is a five stage process. The stages in this process are functional criteria, marketing, sales planning, marketing planning, product management.
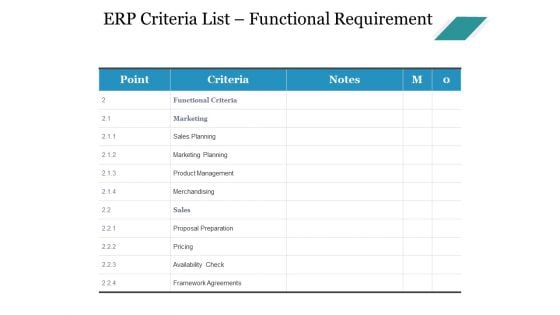
Erp Criteria List Functional Requirement Ppt PowerPoint Presentation Model Outfit
This is a erp criteria list functional requirement ppt powerpoint presentation model outfit. This is a five stage process. The stages in this process are functional criteria, marketing, sales planning, marketing planning, product management.
Erp Criteria List Functional Requirement Ppt PowerPoint Presentation Show Summary
This is a erp criteria list functional requirement ppt powerpoint presentation show summary. This is a four stage process. The stages in this process are functional criteria, marketing, sales planning, marketing planning, product management.
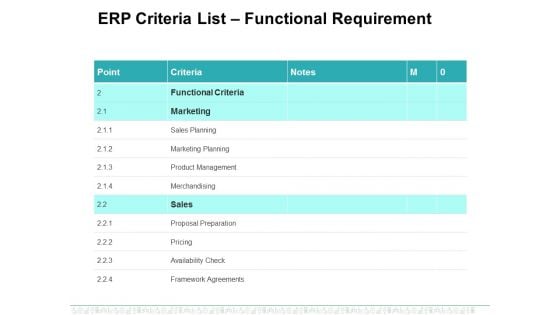
Erp Criteria List Functional Requirement Ppt PowerPoint Presentation Infographics Layouts
This is a erp criteria list functional requirement ppt powerpoint presentation infographics layouts. This is a four stage process. The stages in this process are functional criteria, marketing, sales planning, marketing planning, product management.
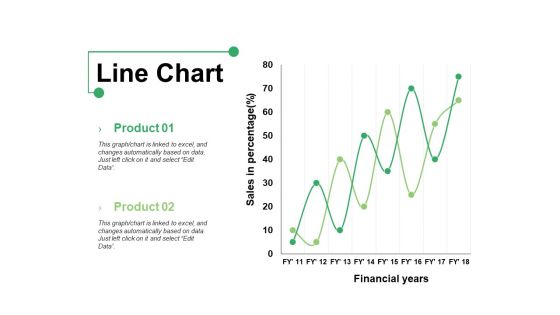
Line Chart Ppt PowerPoint Presentation Show Graphics Example
This is a line chart ppt powerpoint presentation show graphics example. This is a two stage process. The stages in this process are product, line chart, financial years, sales in percentage.
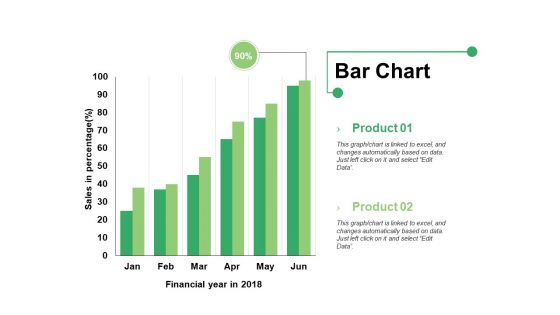
Bar Chart Ppt PowerPoint Presentation Infographics Format Ideas
This is a bar chart ppt powerpoint presentation infographics format ideas. This is a two stage process. The stages in this process are bar graph, product, financial year, sales in percentage.
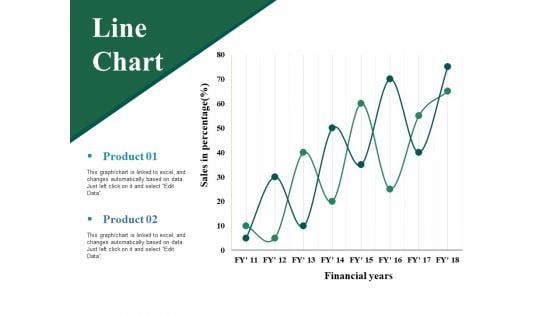
Line Chart Ppt PowerPoint Presentation Professional Grid
This is a line chart ppt powerpoint presentation professional grid. This is a two stage process. The stages in this process are sales in percentage, financial years, product, line chart.
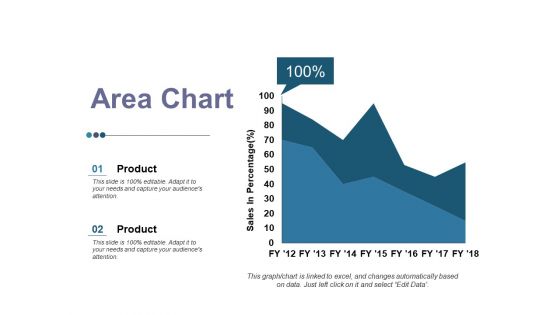
Area Chart Ppt PowerPoint Presentation Inspiration Graphics
This is a area chart ppt powerpoint presentation inspiration graphics. This is a two stage process. The stages in this process are product, area chart, business, growth, sales in percentage.
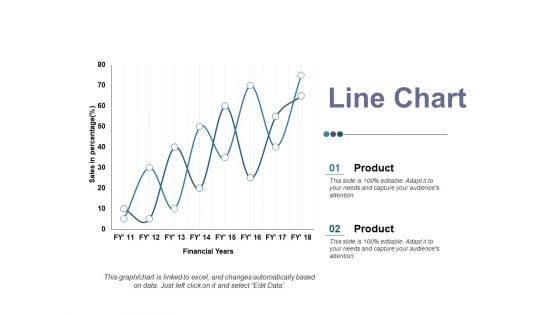
Line Chart Ppt PowerPoint Presentation Ideas Elements
This is a line chart ppt powerpoint presentation ideas elements. This is a two stage process. The stages in this process are product, sales in percentage, financial year, business, line chart.
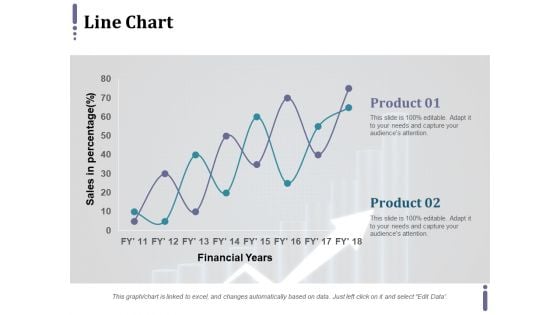
Line Chart Ppt PowerPoint Presentation Infographic Template Master Slide
This is a line chart ppt powerpoint presentation infographic template master slide. This is a two stage process. The stages in this process are product, financial years, sales in percentage.
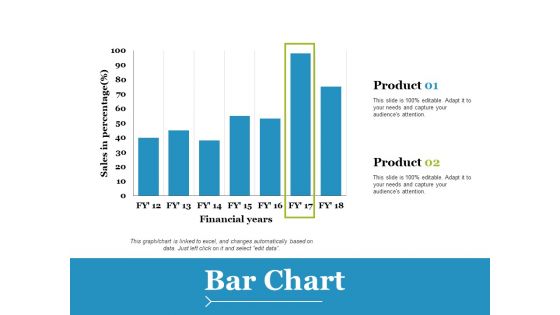
Bar Chart Ppt PowerPoint Presentation Slides Example File
This is a bar chart ppt powerpoint presentation slides example file. This is a two stage process. The stages in this process are product, financial years, sales in percentage.
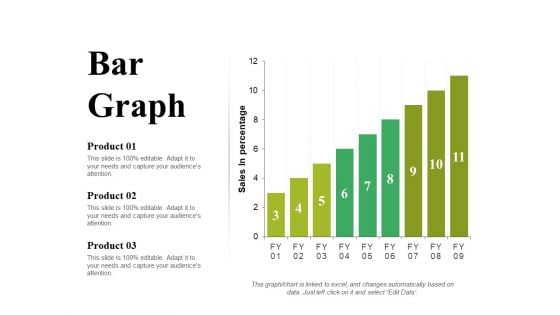
Bar Graph Ppt PowerPoint Presentation Portfolio Slide Portrait
This is a bar graph ppt powerpoint presentation portfolio slide portrait. This is a three stage process. The stages in this process are product, sales in percentage, bar graph, growth, success.

Clustered Column Ppt PowerPoint Presentation Infographic Template Backgrounds
This is a clustered column ppt powerpoint presentation infographic template backgrounds. This is a two stage process. The stages in this process are sales in percentage, financial year, product.
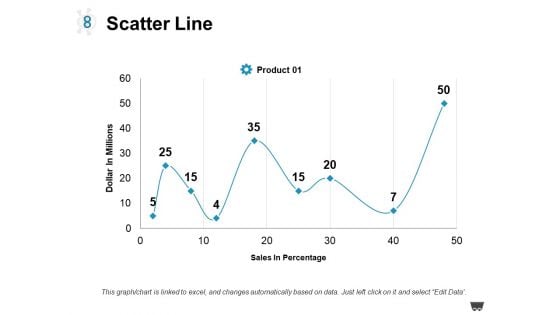
Scatter Line Ppt PowerPoint Presentation Styles Graphics Pictures
This is a scatter line ppt powerpoint presentation styles graphics pictures. This is a one stage process. The stages in this process are product, dollar in millions, sales in percentage.
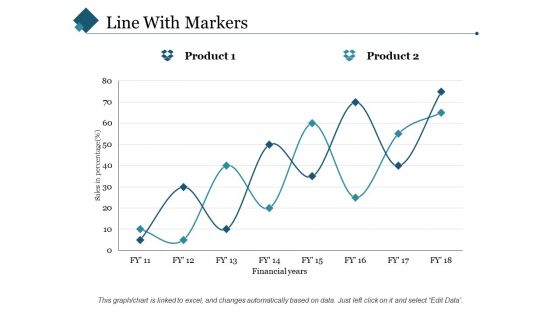
Line With Markers Ppt PowerPoint Presentation Styles Slide Portrait
This is a line with markers ppt powerpoint presentation styles slide portrait. This is a two stage process. The stages in this process are sales in percentage, financial years, product.
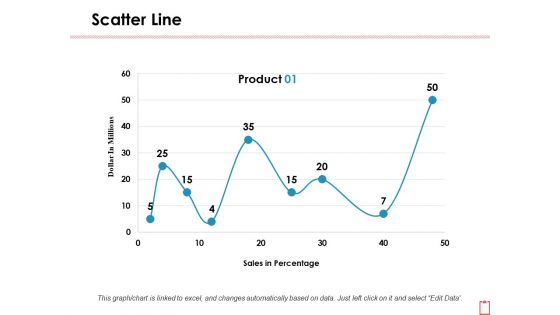
Scatter Line Ppt PowerPoint Presentation Infographics Background Images
This is a scatter line ppt powerpoint presentation infographics background images. This is a one stage process. The stages in this process are dollar in millions, product, sales in percentage.
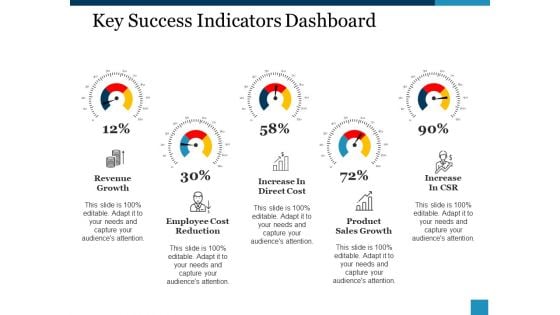
Key Success Indicators Dashboard Ppt PowerPoint Presentation Inspiration Guide
This is a key success indicators dashboard ppt powerpoint presentation inspiration guide. This is a five stage process. The stages in this process are revenue growth, increase in direct cost, increase in csr, employee cost reduction, product, sales growth.
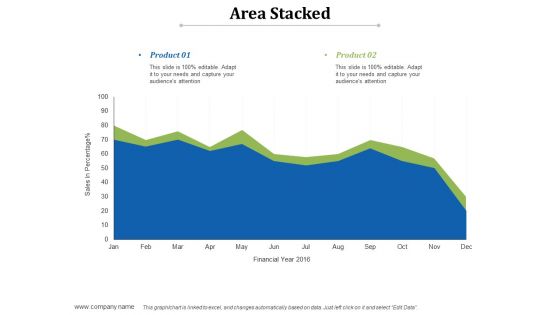
Area Stacked Ppt PowerPoint Presentation Infographics Shapes
This is a area stacked ppt powerpoint presentation infographics shapes. This is a two stage process. The stages in this process are product, area stacked, sales in percentage, financial year.
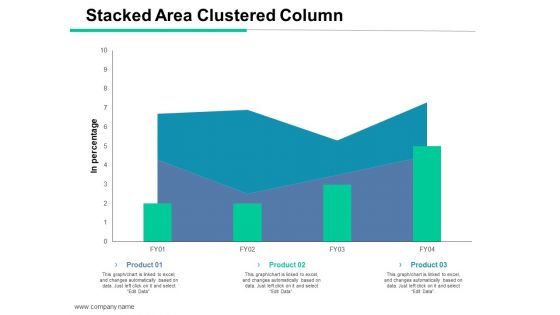
Stacked Area Clustered Column Ppt PowerPoint Presentation File Templates
This is a stacked area clustered column ppt powerpoint presentation file templates. This is a three stage process. The stages in this process are stacked area clustered column, product, financial, sales in percentage, management.
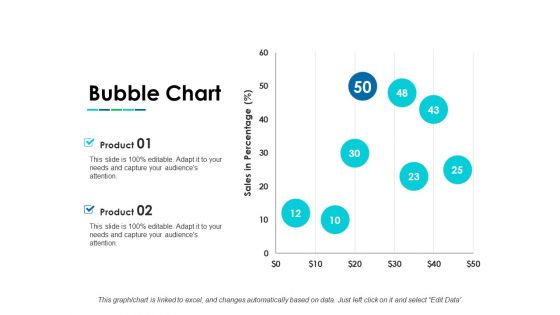
Bubble Chart Ppt PowerPoint Presentation Infographic Template Layouts
This is a bubble chart ppt powerpoint presentation infographic template layouts. This is a two stage process. The stages in this process are bubble chart, product, sales in percentage, growth.
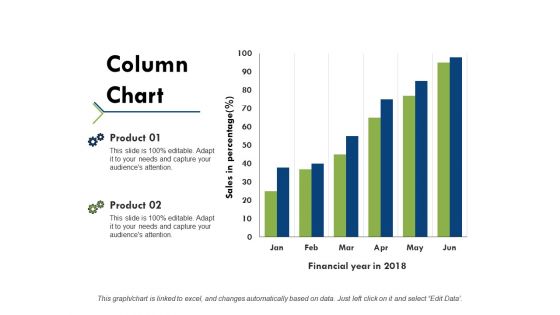
Column Chart Ppt PowerPoint Presentation Portfolio Example Topics
This is a column chart ppt powerpoint presentation portfolio example topics. This is a two stage process. The stages in this process are product, financial year, sales in percentage, column chart.
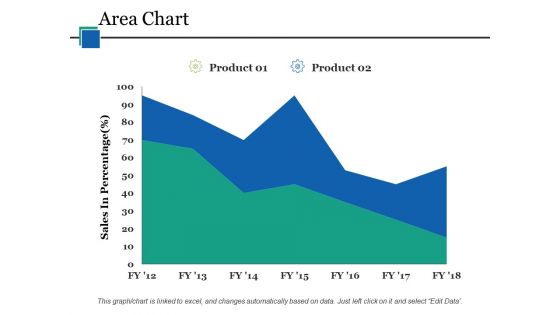
Area Chart Ppt PowerPoint Presentation Infographics Guide
This is a area chart ppt powerpoint presentation infographics guide. This is a two stage process. The stages in this process are area chart, product, sales in percentage, finance, business.
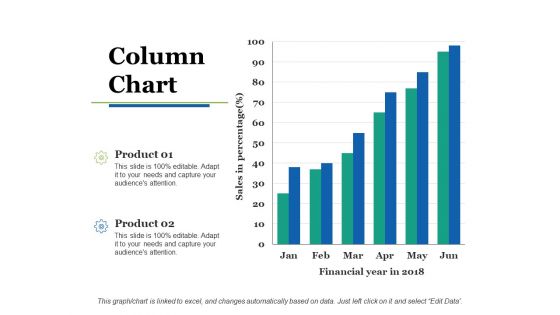
Column Chart Ppt PowerPoint Presentation Slides Show
This is a column chart ppt powerpoint presentation slides show. This is a two stage process. The stages in this process are column chart, product, sales in percentage, financial year, growth.
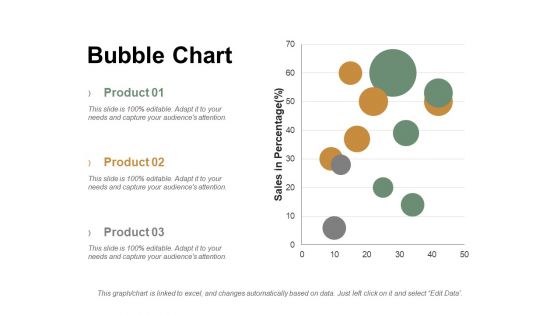
Bubble Chart Ppt PowerPoint Presentation Summary Graphics Tutorials
This is a bubble chart ppt powerpoint presentation summary graphics tutorials. This is a three stage process. The stages in this process are product, sales in percentage, bubble chart.
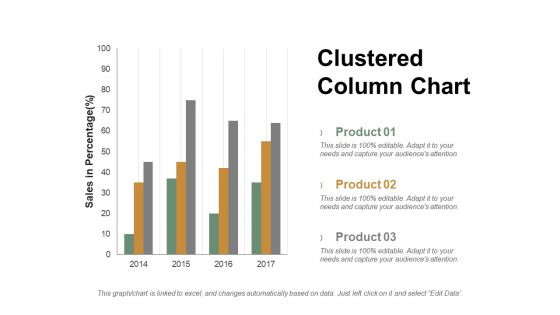
Clustered Column Chart Ppt PowerPoint Presentation Professional Ideas
This is a clustered column chart ppt powerpoint presentation professional ideas. This is a three stage process. The stages in this process are product, sales in percentage, column, years.
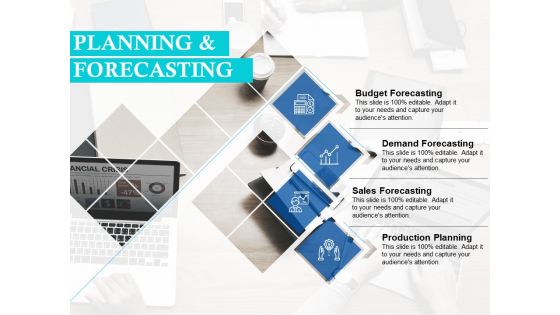
Planning And Forecasting Ppt Powerpoint Presentation Styles Graphic Images
This is a planning and forecasting ppt powerpoint presentation styles graphic images. This is a four stage process. The stages in this process are budget forecasting, demand forecasting, sales forecasting, production planning.
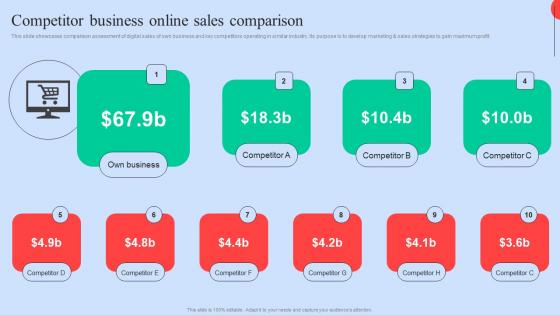
Competitor Business Online Executing Competitors Strategies To Assess Organizational Performance Clipart Pdf
This slide showcases comparison assessment of digital sales of own business and key competitors operating in similar industry. Its purpose is to develop marketing and sales strategies to gain maximum profit. The best PPT templates are a great way to save time, energy, and resources. Slidegeeks have 100 percent editable powerpoint slides making them incredibly versatile. With these quality presentation templates, you can create a captivating and memorable presentation by combining visually appealing slides and effectively communicating your message. Download Competitor Business Online Executing Competitors Strategies To Assess Organizational Performance Clipart Pdf from Slidegeeks and deliver a wonderful presentation. This slide showcases comparison assessment of digital sales of own business and key competitors operating in similar industry. Its purpose is to develop marketing and sales strategies to gain maximum profit.
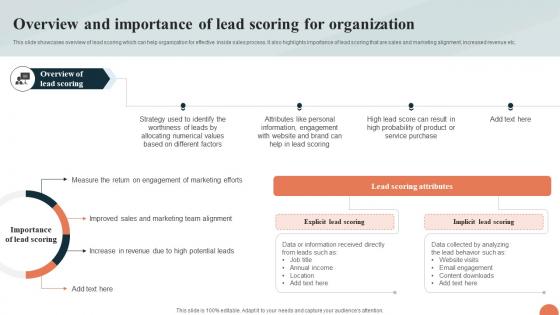
A12 Telesales Strategy For Targeting Large Customer Base Overview And Importance Strategy SS V
This slide showcases overview of lead scoring which can help organization for effective inside sales process. It also highlights importance of lead scoring that are sales and marketing alignment, increased revenue etc. Boost your pitch with our creative A12 Telesales Strategy For Targeting Large Customer Base Overview And Importance Strategy SS V. Deliver an awe-inspiring pitch that will mesmerize everyone. Using these presentation templates you will surely catch everyones attention. You can browse the ppts collection on our website. We have researchers who are experts at creating the right content for the templates. So you do not have to invest time in any additional work. Just grab the template now and use them. This slide showcases overview of lead scoring which can help organization for effective inside sales process. It also highlights importance of lead scoring that are sales and marketing alignment, increased revenue etc.
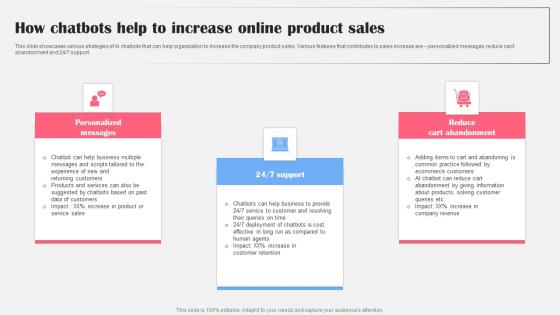
How Chatbots Help To Increase Online AI Bot Application For Various Industries Background Pdf
This slide showcases various strategies of AI chatbots that can help organization to increase the company product sales. Various features that contributes to sales increase are personalized messages, reduce card abandonment and 24 7 support Take your projects to the next level with our ultimate collection of How Chatbots Help To Increase Online AI Bot Application For Various Industries Background Pdf. Slidegeeks has designed a range of layouts that are perfect for representing task or activity duration, keeping track of all your deadlines at a glance. Tailor these designs to your exact needs and give them a truly corporate look with your own brand colors they will make your projects stand out from the rest This slide showcases various strategies of AI chatbots that can help organization to increase the company product sales. Various features that contributes to sales increase are personalized messages, reduce card abandonment and 24 7 support
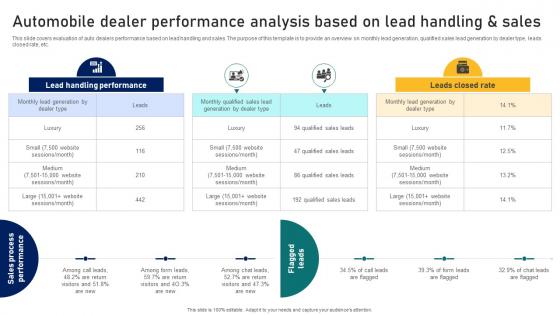
Guide To Building A Successful Automobile Dealer Performance Analysis Based On Lead Strategy SS V
This slide covers evaluation of auto dealers performance based on lead handling and sales. The purpose of this template is to provide an overview on monthly lead generation, qualified sales lead generation by dealer type, leads closed rate, etc. Boost your pitch with our creative Guide To Building A Successful Automobile Dealer Performance Analysis Based On Lead Strategy SS V. Deliver an awe-inspiring pitch that will mesmerize everyone. Using these presentation templates you will surely catch everyones attention. You can browse the ppts collection on our website. We have researchers who are experts at creating the right content for the templates. So you do not have to invest time in any additional work. Just grab the template now and use them. This slide covers evaluation of auto dealers performance based on lead handling and sales. The purpose of this template is to provide an overview on monthly lead generation, qualified sales lead generation by dealer type, leads closed rate, etc.
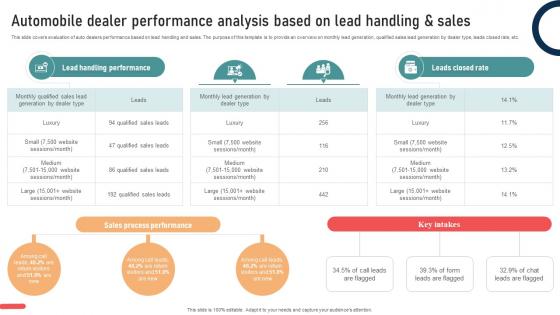
Ultimate Guide To Developing Automobile Dealer Performance Analysis Based On Lead Strategy SS V
This slide covers evaluation of auto dealers performance based on lead handling and sales. The purpose of this template is to provide an overview on monthly lead generation, qualified sales lead generation by dealer type, leads closed rate, etc. Boost your pitch with our creative Ultimate Guide To Developing Automobile Dealer Performance Analysis Based On Lead Strategy SS V. Deliver an awe-inspiring pitch that will mesmerize everyone. Using these presentation templates you will surely catch everyones attention. You can browse the ppts collection on our website. We have researchers who are experts at creating the right content for the templates. So you do not have to invest time in any additional work. Just grab the template now and use them. This slide covers evaluation of auto dealers performance based on lead handling and sales. The purpose of this template is to provide an overview on monthly lead generation, qualified sales lead generation by dealer type, leads closed rate, etc.

Define SEM Campaign Goals And Objectives Ppt Portfolio Graphics Tutorials PDF
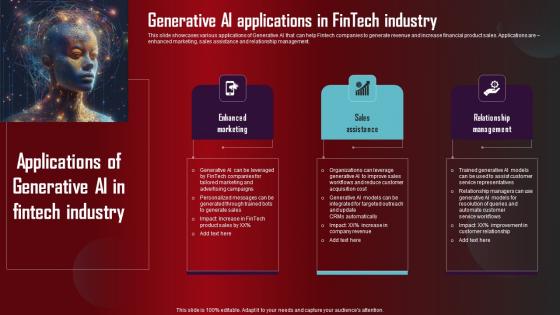
Generative AI Applications In Fintech Industry Role Of Generative AI Tools Across Ideas Pdf
This slide showcases various applications of Generative AI that can help Fintech companies to generate revenue and increase financial product sales. Applications are enhanced marketing, sales assistance and relationship management. If your project calls for a presentation, then Slidegeeks is your go to partner because we have professionally designed, easy to edit templates that are perfect for any presentation. After downloading, you can easily edit Generative AI Applications In Fintech Industry Role Of Generative AI Tools Across Ideas Pdf and make the changes accordingly. You can rearrange slides or fill them with different images. Check out all the handy templates This slide showcases various applications of Generative AI that can help Fintech companies to generate revenue and increase financial product sales. Applications are enhanced marketing, sales assistance and relationship management.
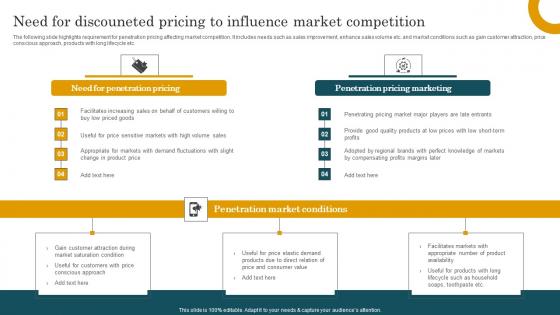
Need For Discouneted Pricing To Influence Market Competition Summary Pdf
The following slide highlights requirement for penetration pricing affecting market competition. It includes needs such as sales improvement, enhance sales volume etc. and market conditions such as gain customer attraction, price conscious approach, products with long lifecycle etc. Pitch your topic with ease and precision using this Need For Discouneted Pricing To Influence Market Competition Summary Pdf This layout presents information on Penetration Pricing, Penetration Pricing Marketing It is also available for immediate download and adjustment. So, changes can be made in the color, design, graphics or any other component to create a unique layout. The following slide highlights requirement for penetration pricing affecting market competition. It includes needs such as sales improvement, enhance sales volume etc. and market conditions such as gain customer attraction, price conscious approach, products with long lifecycle etc.
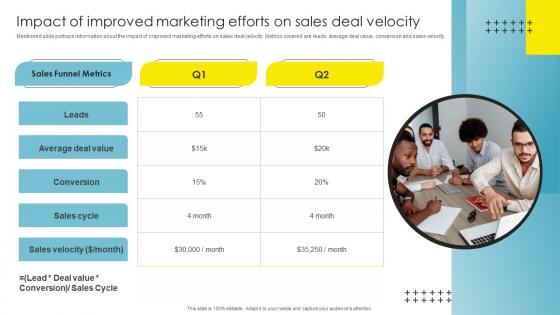
Strategic Brand Management Impact Of Improved Marketing Infographics Pdf
Mentioned slide portrays information about the impact of improved marketing efforts on sales deal velocity. Metrics covered are leads, average deal value, conversion and sales velocity. Here you can discover an assortment of the finest PowerPoint and Google Slides templates. With these templates, you can create presentations for a variety of purposes while simultaneously providing your audience with an eye catching visual experience. Download Strategic Brand Management Impact Of Improved Marketing Infographics Pdf to deliver an impeccable presentation. These templates will make your job of preparing presentations much quicker, yet still, maintain a high level of quality. Slidegeeks has experienced researchers who prepare these templates and write high quality content for you. Later on, you can personalize the content by editing the Strategic Brand Management Impact Of Improved Marketing Infographics Pdf. Mentioned slide portrays information about the impact of improved marketing efforts on sales deal velocity. Metrics covered are leads, average deal value, conversion and sales velocity.
Business Model Template 1 Ppt PowerPoint Presentation Icon
This is a business model template 1 ppt powerpoint presentation icon. This is a six stage process. The stages in this process are deliver financial results, targeted land buying and effective planning, industry leading customer experience, outstanding design, innovative sales and marketing, construction excellence and efficiency.
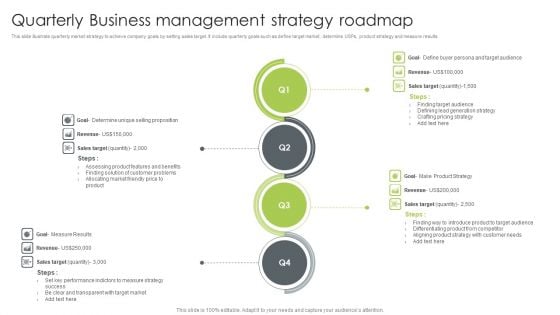
Quarterly Business Management Strategy Roadmap Mockup PDF
This slide illustrate quarterly market strategy to achieve company goals by setting sales target. It include quarterly goals such as define target market, determine USPs, product strategy and measure results. Persuade your audience using this Quarterly Business Management Strategy Roadmap Mockup PDF. This PPT design covers four stages, thus making it a great tool to use. It also caters to a variety of topics including Revenue, Goal, Sales Target. Download this PPT design now to present a convincing pitch that not only emphasizes the topic but also showcases your presentation skills.


 Continue with Email

 Home
Home


