Sales Review
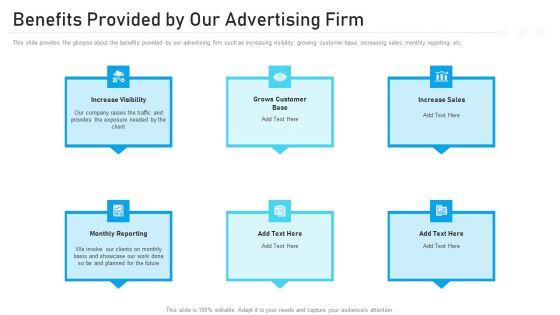
Advertising Pitch Deck Benefits Provided By Our Advertising Firm Ppt Topics PDF
This slide provides the glimpse about the benefits provided by our advertising firm such as increasing visibility, growing customer base, increasing sales, monthly reporting, etc. Presenting advertising pitch deck benefits provided by our advertising firm ppt topics pdf to provide visual cues and insights. Share and navigate important information on six stages that need your due attention. This template can be used to pitch topics like increase visibility, increase sales, monthly reporting. In addtion, this PPT design contains high resolution images, graphics, etc, that are easily editable and available for immediate download.
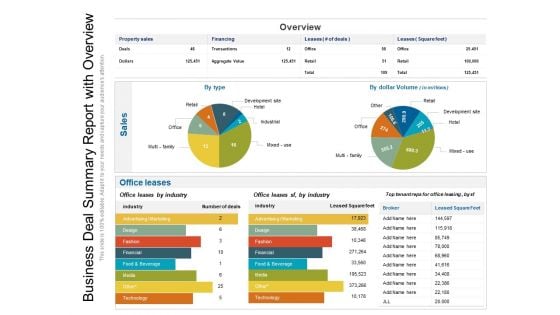
Business Deal Summary Report With Overview Ppt PowerPoint Presentation File Vector PDF
Pitch your topic with ease and precision using this business deal summary report with overview ppt powerpoint presentation file vector pdf. This layout presents information on financing, sales, industry. It is also available for immediate download and adjustment. So, changes can be made in the color, design, graphics or any other component to create a unique layout.
Short Term And Long Term Planning Icons Ppt PowerPoint Presentation Portfolio Icons
This is a short term and long term planning icons ppt powerpoint presentation portfolio icons. This is a two stage process. The stages in this process are business, management, strategy, marketing, sales.
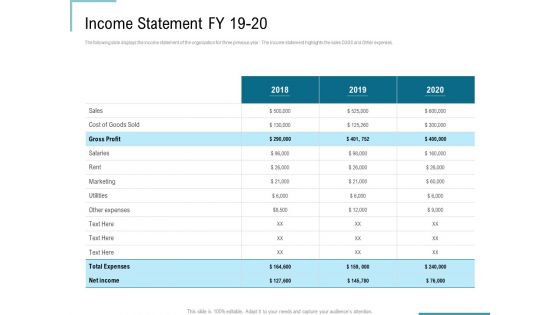
Corporate Execution And Financial Liability Report Income Statement FY 19 20 Sample PDF
Presenting this set of slides with name corporate execution and financial liability report income statement fy 19 20 sample pdf. The topics discussed in these slides are marketing, cost, sales, expenses. This is a completely editable PowerPoint presentation and is available for immediate download. Download now and impress your audience.
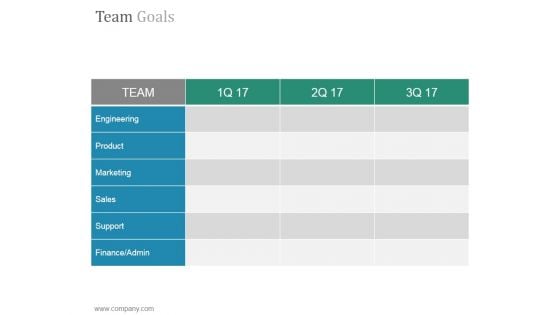
Team Goals Slide Ppt PowerPoint Presentation Tips
This is a team goals slide ppt powerpoint presentation tips. This is a six stage process. The stages in this process are engineering, product, marketing, sales, support, finance admin.
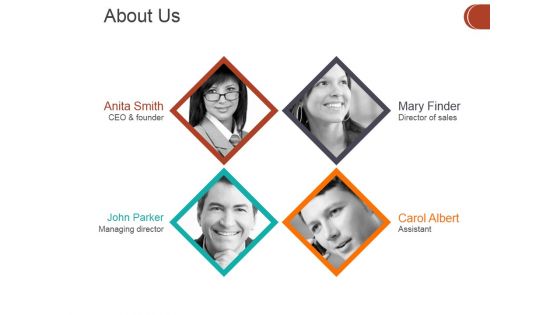
About Us Ppt PowerPoint Presentation Outline Design Ideas
This is a about us ppt powerpoint presentation outline design ideas. This is a four stage process. The stages in this process are ceo and founder, director of sales, managing director, assistant.
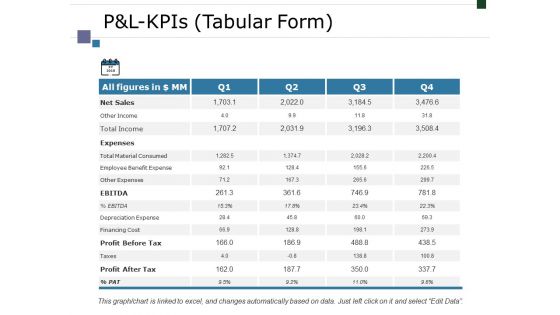
Pandl Kpis Tabular Form Ppt PowerPoint Presentation Outline Background
This is a pandl kpis tabular form ppt powerpoint presentation outline background. This is a four stage process. The stages in this process are net sales, expenses, ebitda, profit before tax, profit after tax.
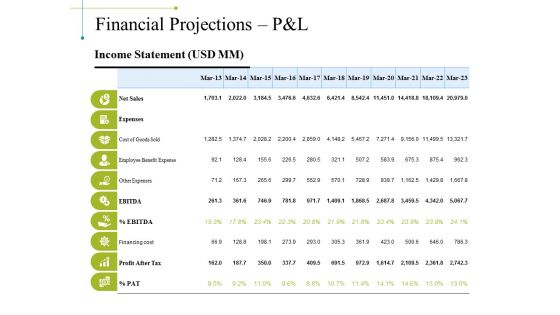
Financial Projections Pandl Ppt PowerPoint Presentation Outline Grid
This is a financial projections pandl ppt powerpoint presentation outline grid. This is a ten stage process. The stages in this process are net sales, expenses, cost of goods sold, other expenses, financing cost.
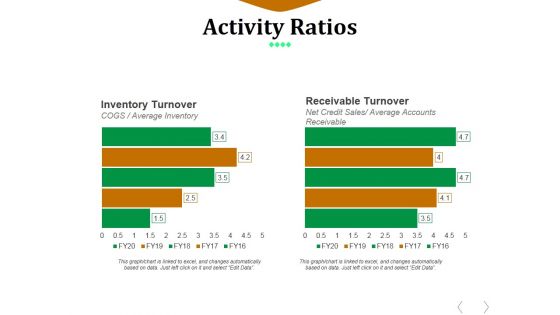
Activity Ratios Template 2 Ppt PowerPoint Presentation Summary Display
This is a activity ratios template 2 ppt powerpoint presentation summary display. This is a two stage process. The stages in this process are inventory turnover, receivable turnover, net credit sales, average accounts receivable.
Activity Ratios Template 3 Ppt PowerPoint Presentation Icon Demonstration
This is a activity ratios template 3 ppt powerpoint presentation icon demonstration. This is a two stage process. The stages in this process are total asset turnover, fixed assets turnover, net sales, fixed assets.

Activity Ratios Template 4 Ppt PowerPoint Presentation Pictures Example File
This is a activity ratios template 4 ppt powerpoint presentation pictures example file. This is a two stage process. The stages in this process are total asset turnover, fixed assets turnover, net sales, fixed assets.
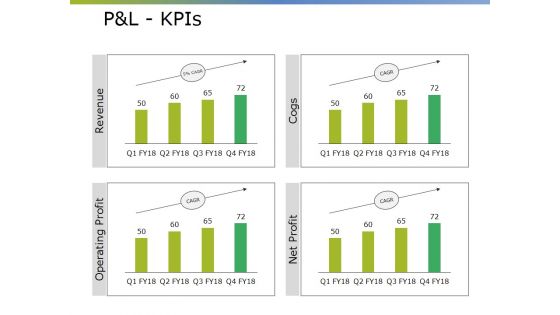
Pandl Kpis Ppt PowerPoint Presentation Gallery Display
This is a pandl kpis ppt powerpoint presentation gallery display. This is a four stage process. The stages in this process are net sales, total income, expenses, ebitda, profit after tax.
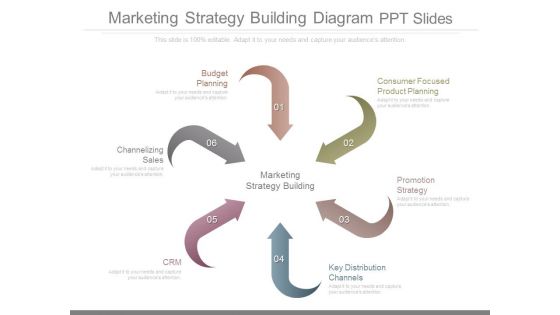
Marketing Strategy Building Diagram Ppt Slides
This is a marketing strategy building diagram ppt slides. This is a six stage process. The stages in this process are budget planning, consumer focused product planning, promotion strategy, key distribution channels, crm, channelizing sales.
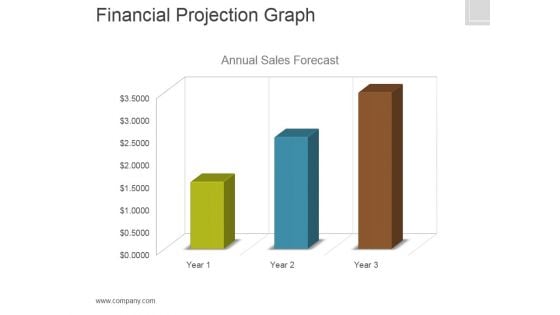
Financial Projection Graph Template 1 Ppt PowerPoint Presentation Clipart
This is a financial projection graph template 1 ppt powerpoint presentation clipart. This is a three stage process. The stages in this process are annual, sales, forecast, finance, marketing.
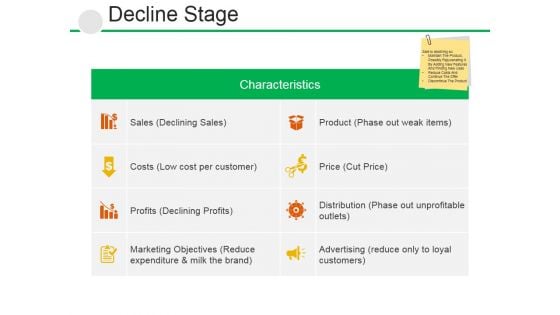
Decline Stage Ppt PowerPoint Presentation File Template
This is a decline stage ppt powerpoint presentation file template. This is a eight stage process. The stages in this process are costs, sales, profits, product, price, distribution, marketing objectives.
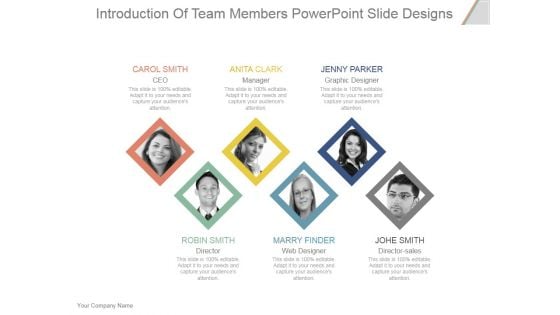
Introduction Of Team Members Ppt PowerPoint Presentation Show
This is a introduction of team members ppt powerpoint presentation show. This is a six stage process. The stages in this process are ceo, manager, graphic designer, director, web designer, director sales.
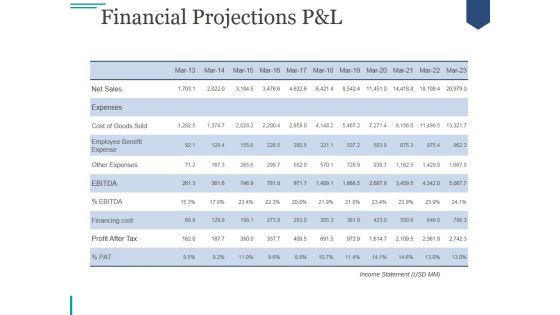
Financial Projections Pand L Ppt PowerPoint Presentation Template
This is a financial projections pand l ppt powerpoint presentation template. This is a eleven stage process. The stages in this process are net sales, expenses, cost of goods sold, employee benefit expense, other expenses, financing cost.
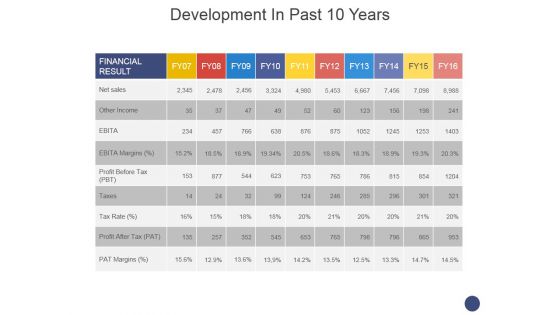
Development In Past 10 Years Template 2 Ppt PowerPoint Presentation Professional Topics
This is a development in past 10 years template 2 ppt powerpoint presentation professional topics. This is a ten stage process. The stages in this process are net sales, other income, ebita, ebita margins, profit before tax, taxes.
Our Company Achievements With Details Ppt Icon Microsoft PDF
This slide shows some business achievements over a period like Most Respected Company, Increased Global Sales, New Stores Opened etc. This is a our company achievements with details ppt icon microsoft pdf template with various stages. Focus and dispense information on five stages using this creative set, that comes with editable features. It contains large content boxes to add your information on topics like our company achievements with details. You can also showcase facts, figures, and other relevant content using this PPT layout. Grab it now.
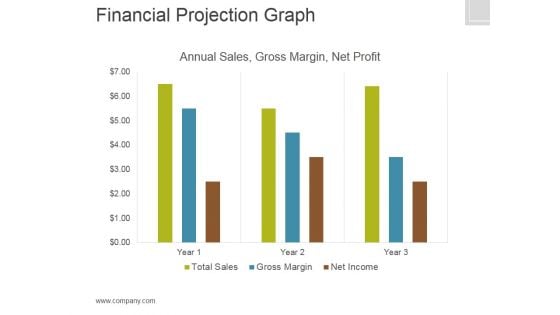
Financial Projection Graph Template 2 Ppt PowerPoint Presentation Graphics
This is a financial projection graph template 2 ppt powerpoint presentation graphics. This is a three stage process. The stages in this process are annual sales, gross margin, net profit, finance.
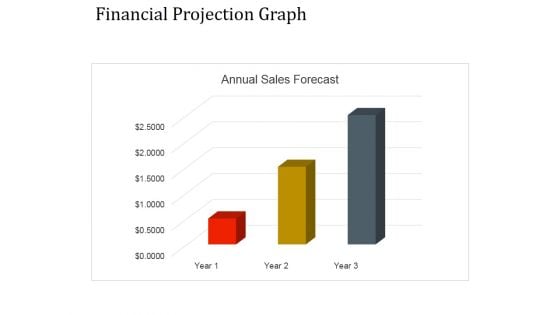
Financial Projection Graph Template 1 Ppt PowerPoint Presentation Graphics
This is a financial projection graph template 1 ppt powerpoint presentation graphics. This is a three stage process. The stages in this process are annual sales, business, management, marketing, strategy.
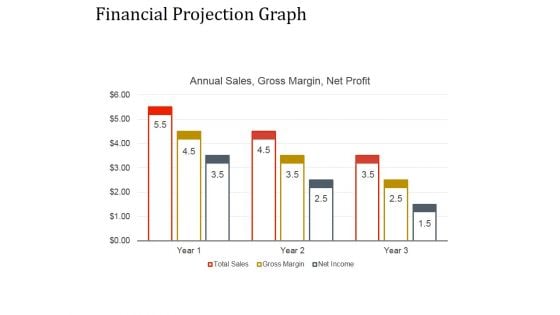
Financial Projection Graph Template 2 Ppt PowerPoint Presentation Ideas
This is a financial projection graph template 2 ppt powerpoint presentation ideas. This is a nine stage process. The stages in this process are annual sales, business, management, marketing, strategy.
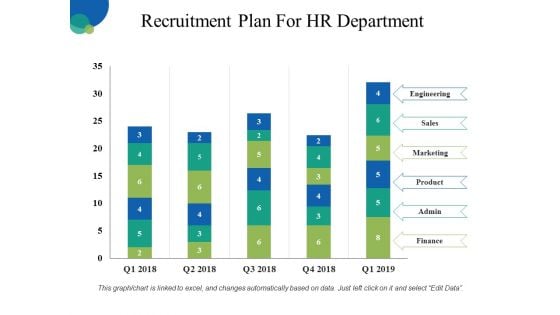
Recruitment Plan For HR Department Ppt PowerPoint Presentation Inspiration Layout Ideas
This is a recruitment plan for hr department ppt powerpoint presentation inspiration layout ideas. This is a five stage process. The stages in this process are engineering, sales, marketing, product, finance.
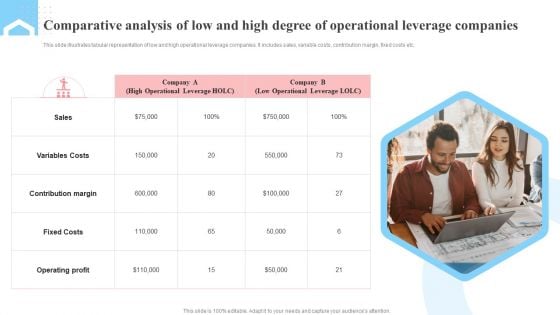
Comparative Analysis Of Low And High Degree Of Operational Leverage Companies Summary PDF
This slide illustrates tabular representation of low and high operational leverage companies. It includes sales, variable costs, contribution margin, fixed costs etc. Presenting Comparative Analysis Of Low And High Degree Of Operational Leverage Companies Summary PDF to dispense important information. This template comprises one stages. It also presents valuable insights into the topics including Sales, Variables Costs, Contribution Margin. This is a completely customizable PowerPoint theme that can be put to use immediately. So, download it and address the topic impactfully.
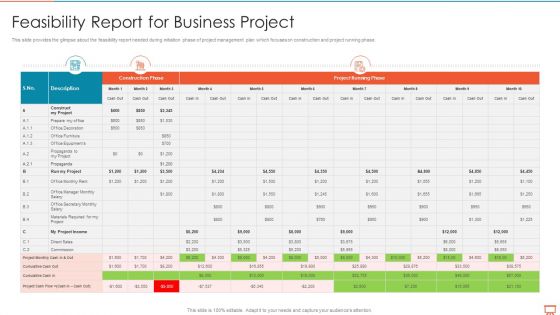
Project Management Experts Required Reports Feasibility Report For Business Project Information PDF
This slide provides the glimpse about the feasibility report needed during initiation phase of project management plan which focuses on construction and project running phase.Deliver an awe inspiring pitch with this creative project management experts required reports feasibility report for business project information pdf bundle. Topics like secretary, equipments, direct sales, commission can be discussed with this completely editable template. It is available for immediate download depending on the needs and requirements of the user.
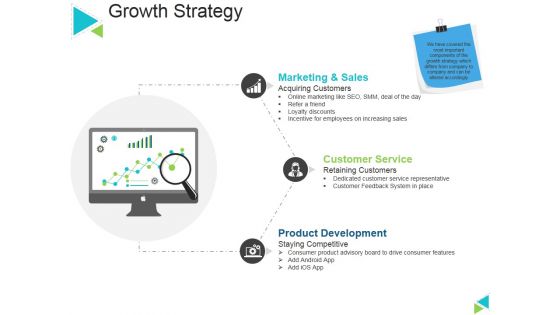
Growth Strategy Ppt PowerPoint Presentation Ideas Graphic Images
This is a growth strategy ppt powerpoint presentation ideas graphic images. This is a three stage process. The stages in this process are marketing and sales, customer service, product development, acquiring customers, staying competitive.

Describing Business Performance Administration Goals For Achieving Key Outcomes Complete Deck
Conduct adequate research on all facets of your business and grow its in sales,profit,etc using this ready made PPT slide. This Describing Business Performance Administration Goals For Achieving Key Outcomes Complete Deck displays parameters to help you evaluate business environment from all angles. Incorporate this organized PPT Design in sixty two slides to classify your top challengers. It is a customizable slide,so use it as per your requirement. Download now to showcase your expertise in all things business,and the specialized knowledge you may have. Our Describing Business Performance Administration Goals For Achieving Key Outcomes Complete Deck are topically designed to provide an attractive backdrop to any subject. Use them to look like a presentation pro.
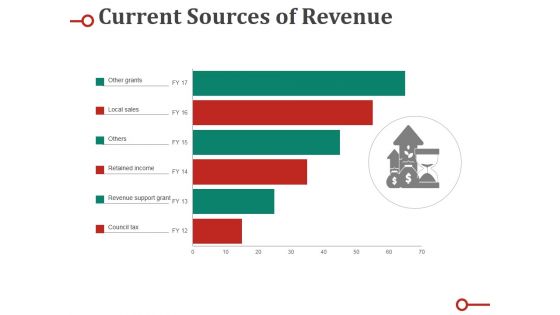
Current Sources Of Revenue Ppt PowerPoint Presentation Pictures Skills
This is a current sources of revenue ppt powerpoint presentation pictures skills. This is a six stage process. The stages in this process are other grants, local sales, others, retained income, revenue support grant.
Pandl Kpis Tabular Form Ppt PowerPoint Presentation Icon
This is a pandl kpis tabular form ppt powerpoint presentation icon. This is a four stage process. The stages in this process are business, net sales, total income, expenses, profit before tax, profit after tax.
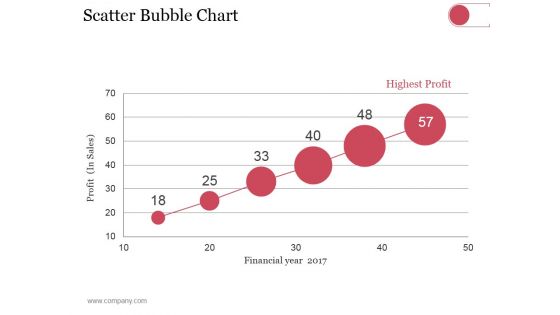
Scatter Bubble Chart Ppt PowerPoint Presentation Summary Pictures
This is a scatter bubble chart ppt powerpoint presentation summary pictures. This is a six stage process. The stages in this process are highest profit, financial year, profit in sales.
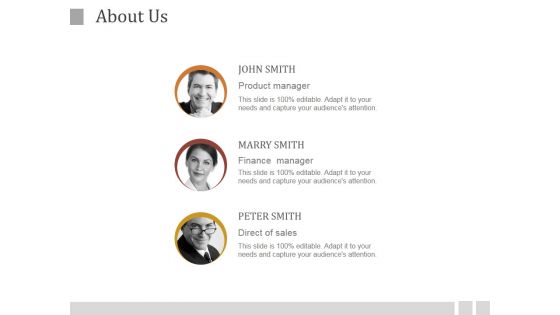
About Us Ppt PowerPoint Presentation Background Image
This is a about us ppt powerpoint presentation background image. This is a three stage process. The stages in this process are product manager, finance manager, director of sales.
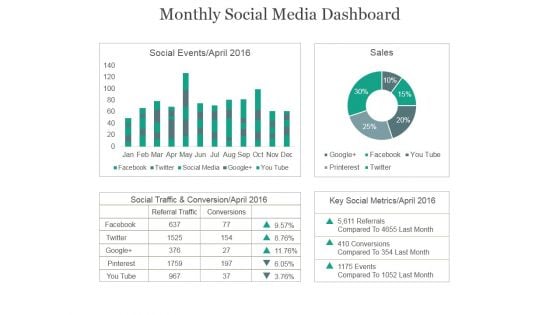
Monthly Social Media Dashboard Ppt PowerPoint Presentation Example 2015
This is a monthly social media dashboard ppt powerpoint presentation example 2015. This is a four stage process. The stages in this process are social events, sales, social traffic, conservation, key social metrics.
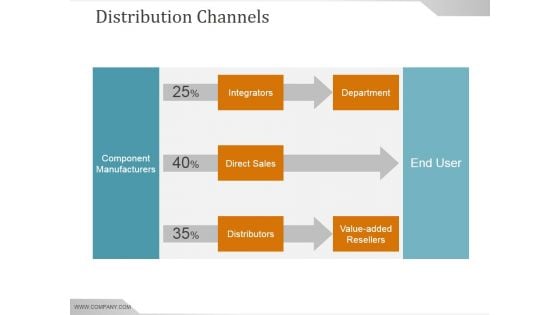
Distribution Channels Ppt PowerPoint Presentation Graphics
This is a distribution channels ppt powerpoint presentation graphics. This is a three stage process. The stages in this process are integrators, direct sales, distributors, value added, resellers, department, component manufacturers, end user.

Financial Projection Graph Template 1 Ppt PowerPoint Presentation Guide
This is a financial projection graph template 1 ppt powerpoint presentation guide. This is a three stage process. The stages in this process are annual sales, gross margin, net profit.
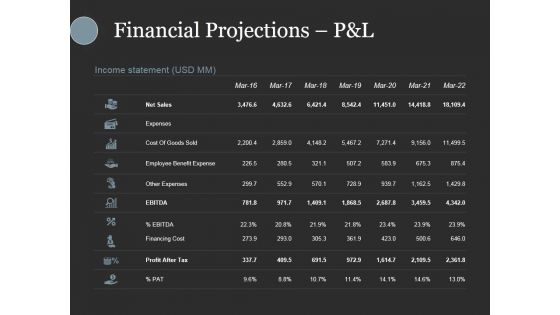
Financial Projections Pandl Ppt PowerPoint Presentation Slides Show
This is a financial projections pandl ppt powerpoint presentation slides show. This is a seven stage process. The stages in this process are net sales, expenses, cost of goods sold, employee benefit expense, other expenses.
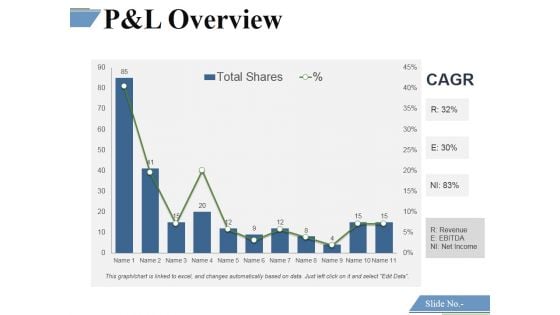
P And L Overview Template 3 Ppt PowerPoint Presentation Model Gridlines
This is a p and l overview template 3 ppt powerpoint presentation model gridlines. This is a eleven stage process. The stages in this process are financing cost, net sales, profit before tax, profit after tax.
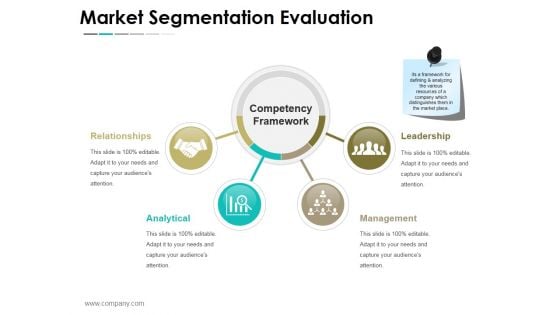
Market Segmentation Evaluation Ppt PowerPoint Presentation Layouts Images
This is a market segmentation evaluation ppt powerpoint presentation layouts images. This is a two stage process. The stages in this process are market sales, net profit, confectionary, milk products, beverages, nutrition and health care.
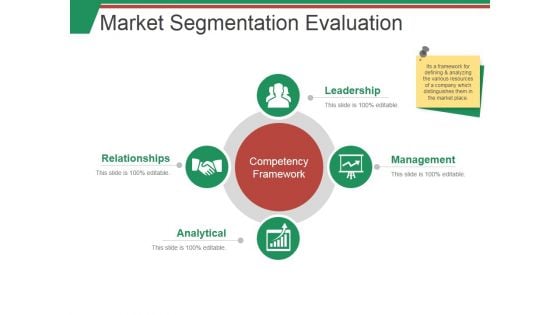
Market Segmentation Evaluation Template 1 Ppt PowerPoint Presentation Summary Smartart
This is a market segmentation evaluation template 1 ppt powerpoint presentation summary smartart. This is a two stage process. The stages in this process are market sales, net profit, beverages, milk product, nutrition.
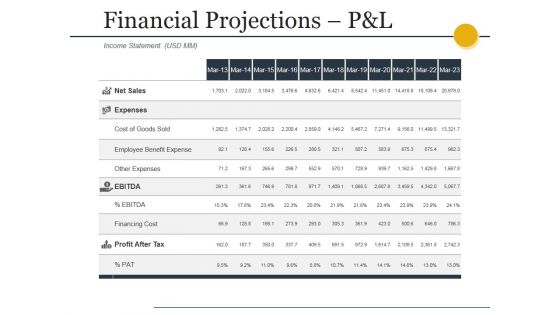
Financial Projections Pandl Ppt PowerPoint Presentation Styles Gallery
This is a financial projections pandl ppt powerpoint presentation styles gallery. This is a eleven stage process. The stages in this process are net sales, expenses, cost of goods sold, employee benefit expense, other expenses.
Financial Summary Ppt PowerPoint Presentation Icon Pictures
This is a financial summary ppt powerpoint presentation icon pictures. This is a seven stage process. The stages in this process are net sales, expenses, ebitda, profit after tax.
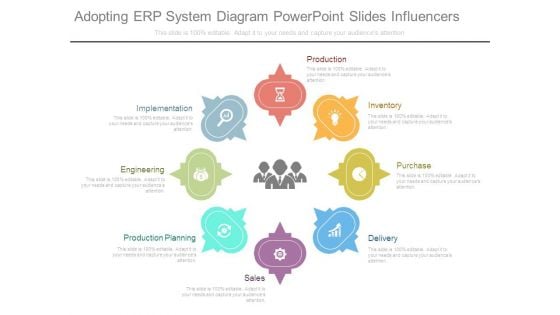
Adopting Erp System Diagram Powerpoint Slides Influencers
This is a adopting erp system diagram powerpoint slides influencers. This is a eight stage process. The stages in this process are implementation, engineering, production planning, sales, delivery, purchase, inventory, production.
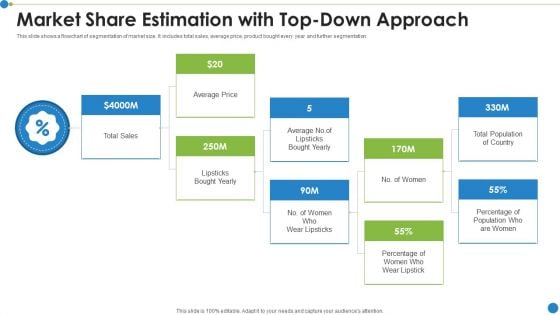
Market Share Estimation With Top Down Approach Ppt PowerPoint Presentation Gallery Design Templates PDF
This slide shows a flowchart of segmentation of market size. It includes total sales, average price, product bought every year and further segmentation. Showcasing this set of slides titled market share estimation with top down approach ppt powerpoint presentation gallery design templates pdf. The topics addressed in these templates are average price, sales. All the content presented in this PPT design is completely editable. Download it and make adjustments in color, background, font etc. as per your unique business setting.
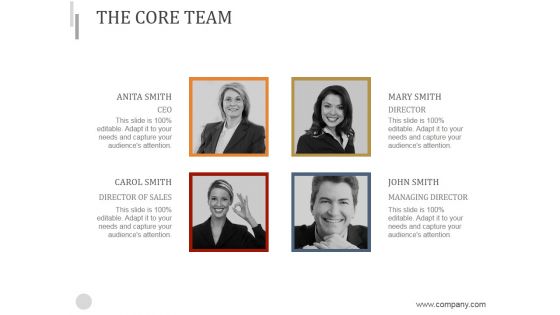
The Core Team Ppt PowerPoint Presentation Visual Aids
This is a the core team ppt powerpoint presentation visual aids. This is a four stage process. The stages in this process are ceo, director of sales, director, managing director.
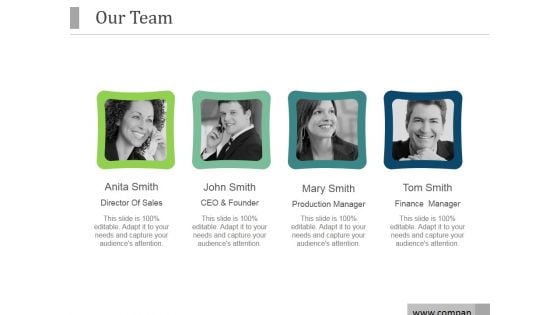
Our Team Ppt PowerPoint Presentation Deck
This is a our team ppt powerpoint presentation deck. This is a four stage process. The stages in this process are director of sales, ceo and founder, production manager, finance manager .
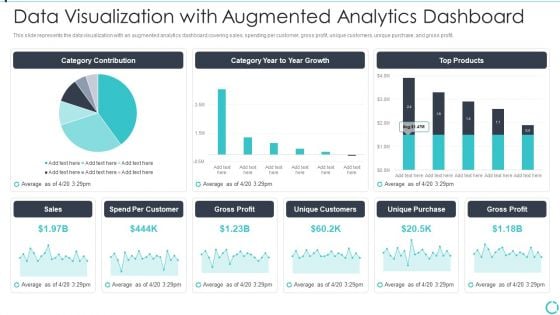
Augmented Analytics Implementation IT Data Visualization With Augmented Analytics Microsoft PDF
This slide represents the data visualization with an augmented analytics dashboard covering sales, spending per customer, gross profit, unique customers, unique purchase, and gross profit. Deliver an awe inspiring pitch with this creative Augmented Analytics Implementation IT Data Visualization With Augmented Analytics Microsoft PDF bundle. Topics like Category Contribution, Category Year To Year Growth, Top Products, Sales, Gross Profit can be discussed with this completely editable template. It is available for immediate download depending on the needs and requirements of the user.
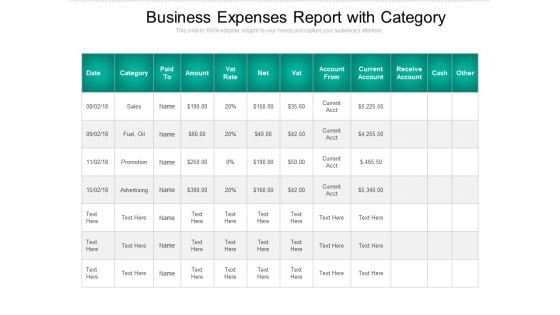
Business Expenses Report With Category Ppt PowerPoint Presentation Pictures Template PDF
Presenting this set of slides with name business expenses report with category ppt powerpoint presentation pictures template pdf. The topics discussed in these slides are sales, fuel, oil, promotion, advertising, cash. This is a completely editable PowerPoint presentation and is available for immediate download. Download now and impress your audience.
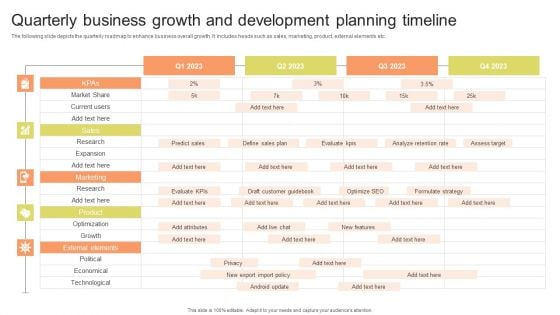
Quarterly Business Growth And Development Planning Timeline Background PDF
The following slide depicts the quarterly roadmap to enhance business overall growth. It includes heads such as sales, marketing, product, external elements etc. Pitch your topic with ease and precision using this Quarterly Business Growth And Development Planning Timeline Background PDF. This layout presents information on Predict Sales, Assess Target, Formulate Strategy. It is also available for immediate download and adjustment. So, changes can be made in the color, design, graphics or any other component to create a unique layout.
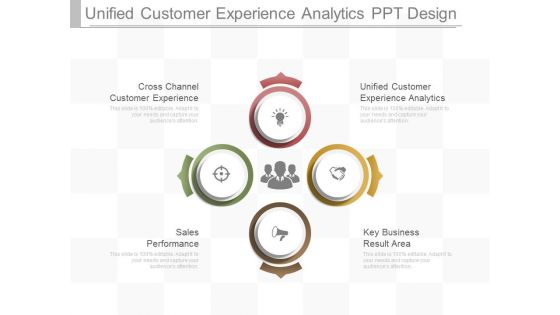
Unified Customer Experience Analytics Ppt Design
This is a unified customer experience analytics ppt design. This is a four stage process. The stages in this process are cross channel customer experience, unified customer experience analytics, sales, performance, key business result area.
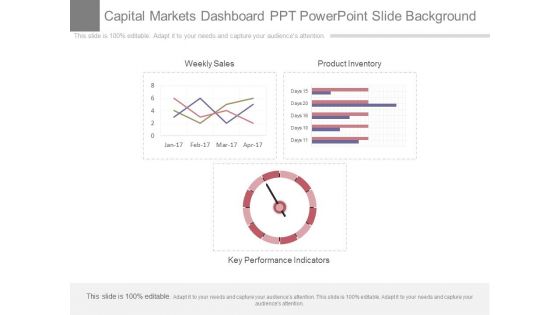
Capital Markets Dashboard Ppt Powerpoint Slide Background
This is a capital markets dashboard ppt powerpoint slide background. This is a three stage process. The stages in this process are weekly sales, product inventory, key performance indicators.

Example Of Optimized Investment Sample Diagram Powerpoint Graphics
This is a example of optimized investment sample diagram powerpoint graphics. This is a eight stage process. The stages in this process are customer, performance, profit, capital protection, leverage, yield enhancement, sales, brand growth.

Business Interrelationship Graphic Design Powerpoint Presentation Examples
This is a business interrelationship graphic design powerpoint presentation examples. This is a six stage process. The stages in this process are data integration, performance management, sales, accounting, assemble product, decision support systems.
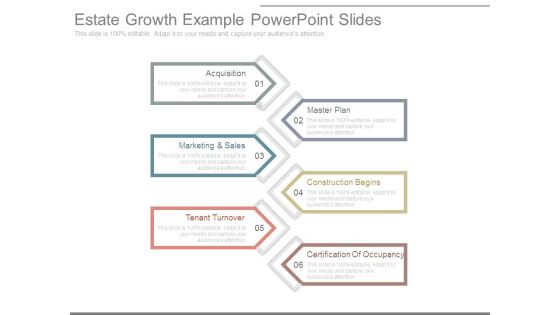
Estate Growth Example Powerpoint Slides
This is a estate growth example powerpoint slides. This is a six stage process. The stages in this process are acquisition, master plan, marketing and sales, construction begins, tenant turnover, certification of occupancy.
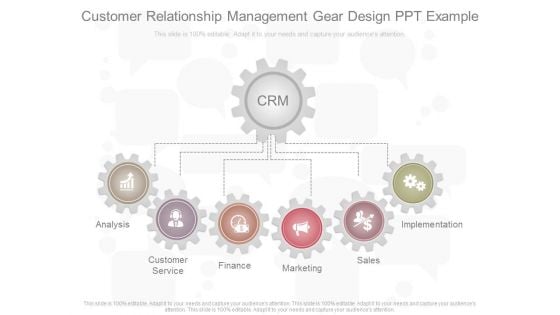
Customer Relationship Management Gear Design Ppt Example
This is a customer relationship management gear design ppt example. This is a six stage process. The stages in this process are crm, analysis, customer service, finance, marketing, sales, implementation.
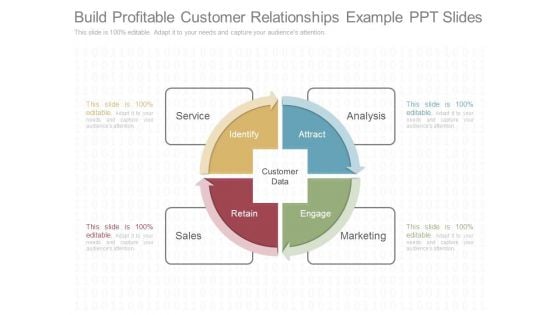
Build Profitable Customer Relationships Example Ppt Slides
This is a build profitable customer relationships example ppt slides. This is a four stage process. The stages in this process are service, sales, marketing, analysis, attract, engage, retain, identify, customer data.
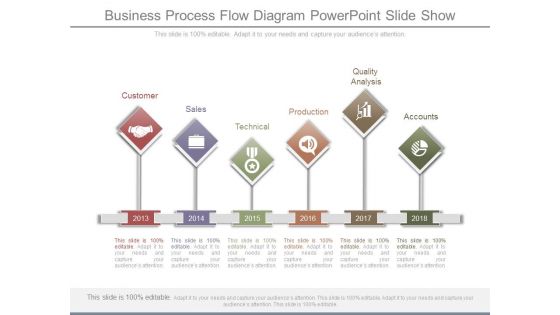
Business Process Flow Diagram Powerpoint Slide Show
This is a business process flow diagram powerpoint slide show. This is a six stage process. The stages in this process are customer, sales, technical, production, quality analysis, accounts.
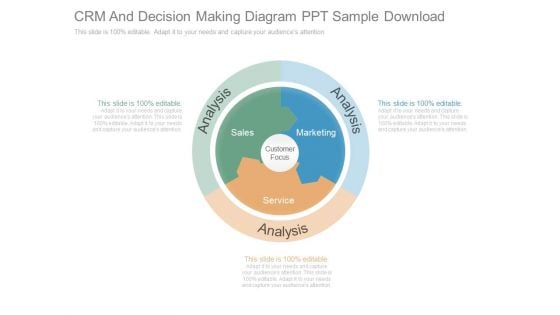
Crm And Decision Making Diagram Ppt Sample Download
This is a crm and decision making diagram ppt sample download. This is a three stage process. The stages in this process are analysis, service, sales, marketing, customer focus.

Customer Relationship Marketing Diagram Example Of Ppt Presentation
This is a customer relationship marketing diagram example of ppt presentation. This is a seven stage process. The stages in this process are new customers, qualified prospects, loyal customer base, marketing, service, sales, analysis.
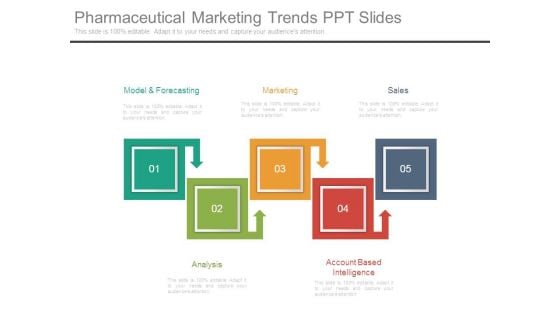
Pharmaceutical Marketing Trends Ppt Slides
This is a pharmaceutical marketing trends ppt slides. This is a five stage process. The stages in this process are model and forecasting, marketing, sales, analysis, account based intelligence.
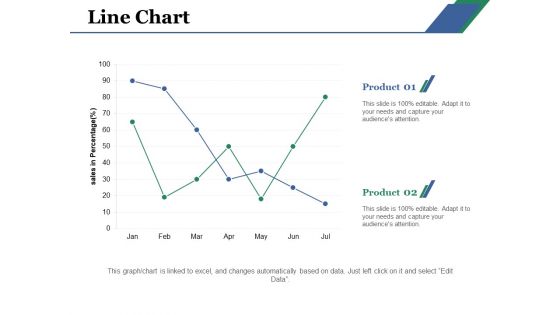
Line Chart Ppt PowerPoint Presentation Layouts Example File
This is a line chart ppt powerpoint presentation layouts example file. This is a two stage process. The stages in this process are line chart, product, business, sales, analysis.

Key Channels CRMS Platform Business Model BMC SS V
This slide showcases the various points the company connects with its customers. It includes channels such as direct sales, online sales, physical networks, and physical stores. From laying roadmaps to briefing everything in detail, our templates are perfect for you. You can set the stage with your presentation slides. All you have to do is download these easy-to-edit and customizable templates. Key Channels CRMS Platform Business Model BMC SS V will help you deliver an outstanding performance that everyone would remember and praise you for. Do download this presentation today. This slide showcases the various points the company connects with its customers. It includes channels such as direct sales, online sales, physical networks, and physical stores.


 Continue with Email

 Home
Home


