Sales Trend
Combo Chart Ppt PowerPoint Presentation Icon Rules
This is a combo chart ppt powerpoint presentation icon rules. This is a ten stage process. The stages in this process are cumulative, value, sales, graph, business.
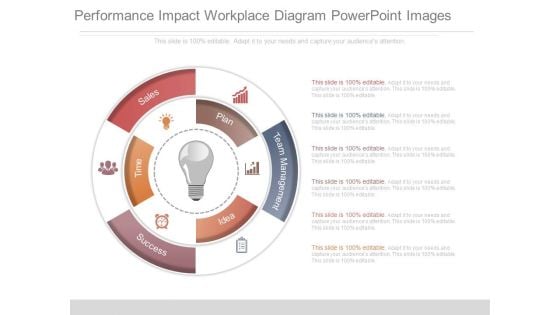
Performance Impact Workplace Diagram Powerpoint Images
This is a performance impact workplace diagram powerpoint images. This is a six stage process. The stages in this process are sales, success, team management, plan, idea, time.
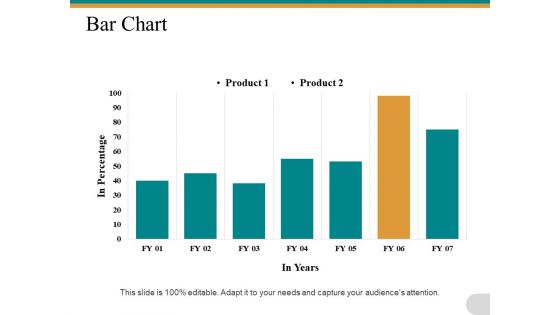
Bar Chart Marketing Ppt PowerPoint Presentation Outline Deck
This is a bar chart marketing ppt powerpoint presentation outline deck. This is a two stage process. The stages in this process are business, management, marketing, financial, sales.
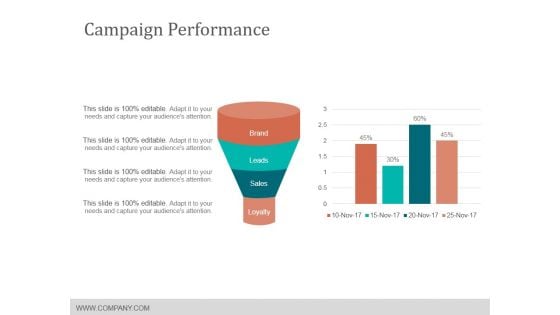
Campaign Performance Ppt Powerpoint Presentation Visual Aids Layouts
This is a campaign performance ppt powerpoint presentation visual aids layouts. This is a four stage process. The stages in this process are brand, leads, sales, loyalty.
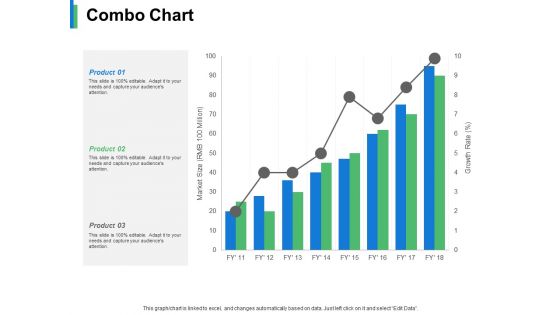
Combo Chart Product Ppt PowerPoint Presentation Slides Aids
This is a combo chart product ppt powerpoint presentation slides aids. This is a three stage process. The stages in this process are business, management, marketing, strategy, sales.
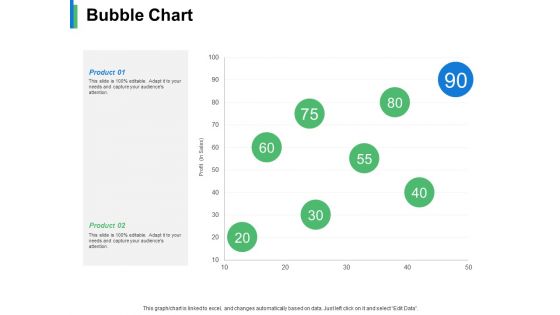
Bubble Chart Product Ppt PowerPoint Presentation Infographics Backgrounds
This is a bubble chart product ppt powerpoint presentation infographics backgrounds. This is a two stage process. The stages in this process are business, management, strategy, marketing, sales.
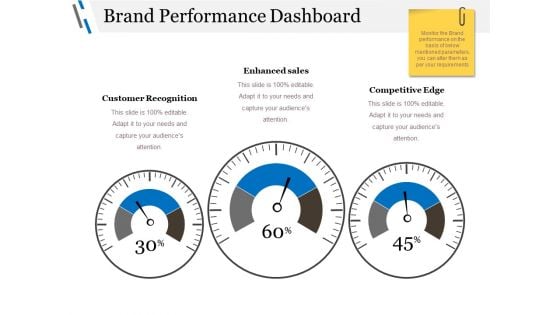
Brand Performance Dashboard Ppt PowerPoint Presentation Professional Grid
This is a brand performance dashboard ppt powerpoint presentation professional grid. This is a three stage process. The stages in this process are customer recognition, enhanced sales, competitive edge, dashboard, business.
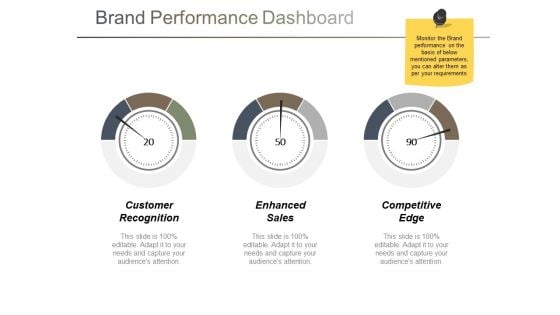
Brand Performance Dashboard Ppt PowerPoint Presentation Layouts Summary
This is a brand performance dashboard ppt powerpoint presentation layouts summary. This is a three stage process. The stages in this process are customer recognition, enhanced sales, competitive edge, dashboard, business.
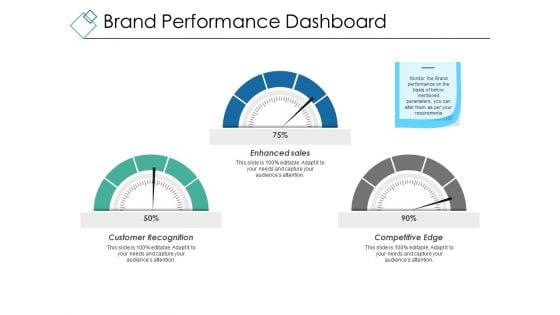
Brand Performance Dashboard Ppt PowerPoint Presentation Show Graphic Tips
This is a brand performance dashboard ppt powerpoint presentation show graphic tips. This is a three stage process. The stages in this process are customer recognition, enhanced sales, competitive edge, dashboard, business, percentage.
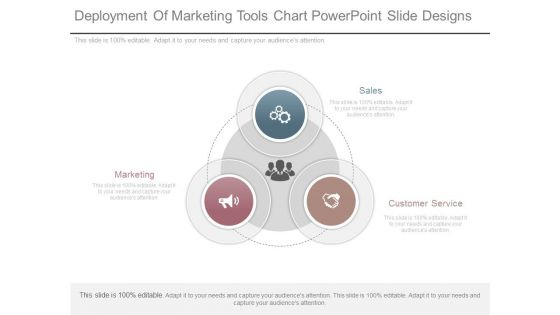
Deployment Of Marketing Tools Chart Powerpoint Slide Designs
This is a deployment of marketing tools chart powerpoint slide designs. This is a three stage process. The stages in this process are sales, customer service, marketing.
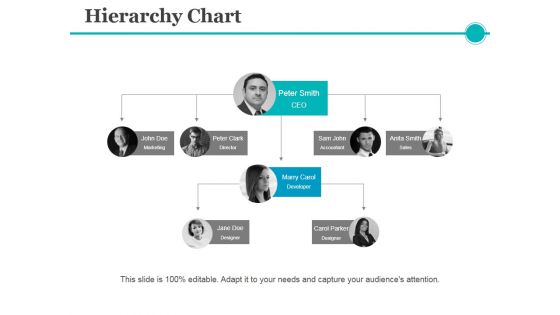
Hierarchy Chart Ppt PowerPoint Presentation Model Graphics Pictures
This is a hierarchy chart ppt powerpoint presentation model graphics pictures. This is a four stage process. The stages in this process are ceo, accountant, sales, developer, designer.
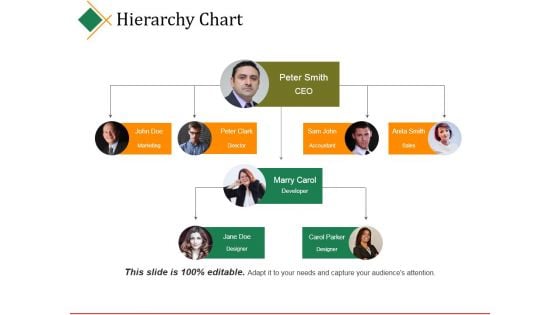
Hierarchy Chart Ppt PowerPoint Presentation Infographic Template Graphics
This is a hierarchy chart ppt powerpoint presentation infographic template graphics. This is a four stage process. The stages in this process are ceo, director, accountant, sales, developer.
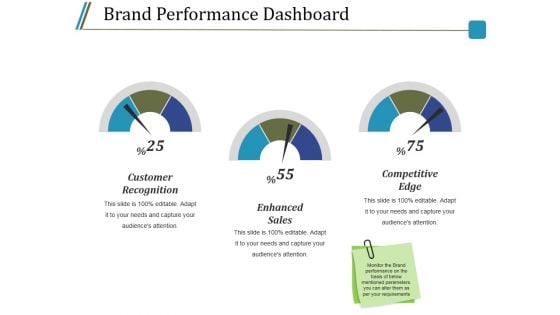
Brand Performance Dashboard Ppt PowerPoint Presentation Infographics Shapes
This is a brand performance dashboard ppt powerpoint presentation infographics shapes. This is a three stage process. The stages in this process are customer recognition, enhanced sales, competitive edge.
Brand Performance Dashboard Ppt PowerPoint Presentation Icon Microsoft
This is a brand performance dashboard ppt powerpoint presentation icon microsoft. This is a three stage process. The stages in this process are customer recognition, enhanced sales, competitive edge.
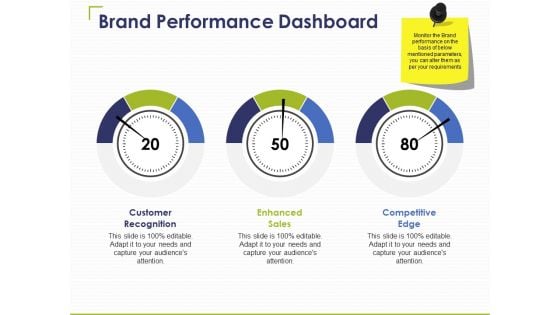
Brand Performance Dashboard Ppt PowerPoint Presentation Infographic Template Designs
This is a brand performance dashboard ppt powerpoint presentation infographic template designs. This is a three stage process. The stages in this process are customer recognition, enhanced sales, competitive edge.

Example Of Economic Growth Powerpoint Slide
This is an example of economic growth powerpoint slide. This is a five stage process. The stages in this process are industry, income, money, profit, trends.
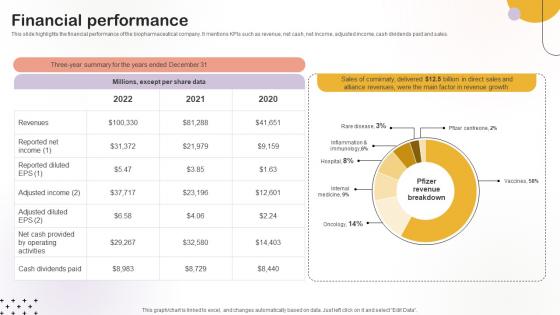
Financial Performance Medical Research Organization Pitch Deck
This slide highlights the financial performance of the biopharmaceutical company. It mentions KPIs such as revenue, net cash, net income, adjusted income, cash dividends paid and sales.From laying roadmaps to briefing everything in detail, our templates are perfect for you. You can set the stage with your presentation slides. All you have to do is download these easy-to-edit and customizable templates. Financial Performance Medical Research Organization Pitch Deck will help you deliver an outstanding performance that everyone would remember and praise you for. Do download this presentation today. This slide highlights the financial performance of the biopharmaceutical company. It mentions KPIs such as revenue, net cash, net income, adjusted income, cash dividends paid and sales.

Mass Producing Firm Performance Assessment Income Statement In FY20 Information PDF
This slide shows profit and loss statement of the company. It includes net sales, cost of goods manufactured, cost of goods sold, gross margin from sales, total operating expenses, income from operations, income before taxes and net income.Deliver an awe-inspiring pitch with this creative mass producing firm performance assessment income statement in fy20 information pdf. bundle. Topics like net sales, gross sales, values can be discussed with this completely editable template. It is available for immediate download depending on the needs and requirements of the user.

KPI Dashboard To Track Amazon Performance Ppt Styles Guidelines PDF
This slide provides information regarding dashboard to monitor Amazon performance. The KPIs include tracking of product sales, conversion rate, advertising spends, session, organic sales, etc. There are so many reasons you need a KPI Dashboard To Track Amazon Performance Ppt Styles Guidelines PDF. The first reason is you can not spend time making everything from scratch, Thus, Slidegeeks has made presentation templates for you too. You can easily download these templates from our website easily.
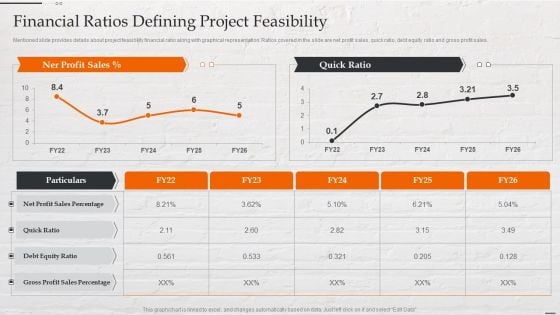
Capital Investment Options Financial Ratios Defining Project Feasibility Guidelines PDF
Mentioned slide provides details about project feasibility financial ratio along with graphical representation. Ratios covered in the slide are net profit sales, quick ratio, debt equity ratio and gross profit sales. Deliver an awe inspiring pitch with this creative Capital Investment Options Financial Ratios Defining Project Feasibility Guidelines PDF bundle. Topics like Net Profit Sales, Quick Ratio, Debt Equity Ratio can be discussed with this completely editable template. It is available for immediate download depending on the needs and requirements of the user.
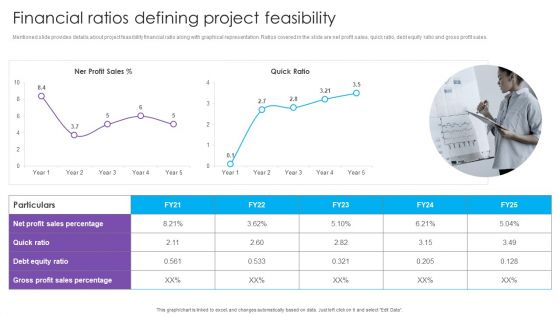
Financial Ratios Defining Project Feasibility Real Estate Project Funding Clipart PDF
Mentioned slide provides details about project feasibility financial ratio along with graphical representation. Ratios covered in the slide are net profit sales, quick ratio, debt equity ratio and gross profit sales.Deliver an awe inspiring pitch with this creative Financial Ratios Defining Project Feasibility Real Estate Project Funding Clipart PDF bundle. Topics like Profit Sales, Debt Equity, Gross Profit can be discussed with this completely editable template. It is available for immediate download depending on the needs and requirements of the user.
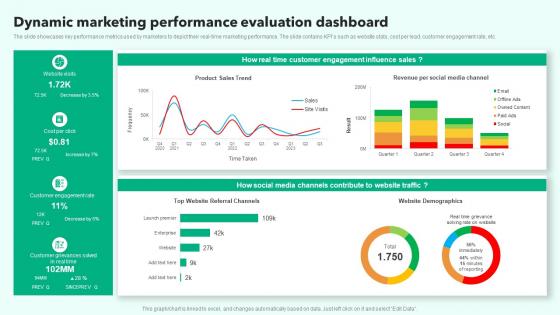
Dynamic Marketing Performance Evaluation Dashboard Microsoft Pdf
The slide showcases key performance metrics used by marketers to depict their real time marketing performance. The slide contains KPIs such as website stats, cost per lead, customer engagement rate, etc. Pitch your topic with ease and precision using this Dynamic Marketing Performance Evaluation Dashboard Microsoft Pdf. This layout presents information on Influence Sales, Customer Engagement, Customer Engagement Rate. It is also available for immediate download and adjustment. So, changes can be made in the color, design, graphics or any other component to create a unique layout. The slide showcases key performance metrics used by marketers to depict their real time marketing performance. The slide contains KPIs such as website stats, cost per lead, customer engagement rate, etc.

Closed Loop Supply Chain Management Reverse Logistics Dashboard Ppt File Demonstration PDF
Presenting this set of slides with name closed loop supply chain management reverse logistics dashboard ppt file demonstration pdf. The topics discussed in these slides are sales, sales, order, need attention, product. This is a completely editable PowerPoint presentation and is available for immediate download. Download now and impress your audience.

Executing Guide For Waterfall Model In Managing Project Ppt Powerpoint Presentation Complete Deck
Conduct adequate research on all facets of your business and grow its in sales, profit, etc using this ready-made PPT slide. This Executing Guide For Waterfall Model In Managing Project Ppt Powerpoint Presentation Complete Deck displays parameters to help you evaluate business environment from all angles. Incorporate this organized PPT Design in forty six slides to classify your top challengers. It is a customizable slide, so use it as per your requirement. Download now to showcase your expertise in all things business, and the specialized knowledge you may have. Our Executing Guide For Waterfall Model In Managing Project Ppt Powerpoint Presentation Complete Deck are topically designed to provide an attractive backdrop to any subject. Use them to look like a presentation pro.
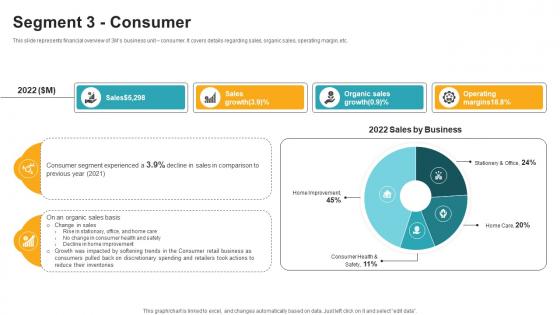
Segment 3 Consumer Innovative Industrial Solutions Company Profile CP SS V
This slide represents financial overview of 3Ms business unit consumer. It covers details regarding sales, organic sales, operating margin, etc.The best PPT templates are a great way to save time, energy, and resources. Slidegeeks have 100 percent editable powerpoint slides making them incredibly versatile. With these quality presentation templates, you can create a captivating and memorable presentation by combining visually appealing slides and effectively communicating your message. Download Segment 3 Consumer Innovative Industrial Solutions Company Profile CP SS V from Slidegeeks and deliver a wonderful presentation. This slide represents financial overview of 3Ms business unit consumer. It covers details regarding sales, organic sales, operating margin, etc.
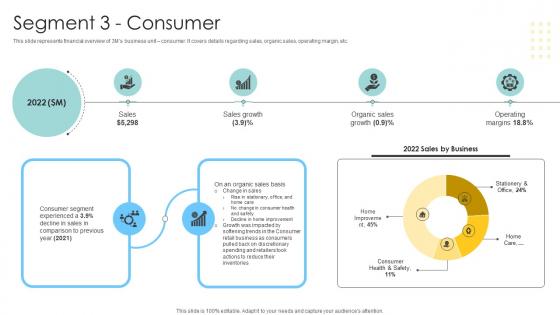
Segment 3 Consumer Multinational Conglomerate Company Profile CP SS V
This slide represents financial overview of 3Ms business unit consumer. It covers details regarding sales, organic sales, operating margin, etc.The best PPT templates are a great way to save time, energy, and resources. Slidegeeks have 100 percent editable powerpoint slides making them incredibly versatile. With these quality presentation templates, you can create a captivating and memorable presentation by combining visually appealing slides and effectively communicating your message. Download Segment 3 Consumer Multinational Conglomerate Company Profile CP SS V from Slidegeeks and deliver a wonderful presentation. This slide represents financial overview of 3Ms business unit consumer. It covers details regarding sales, organic sales, operating margin, etc.
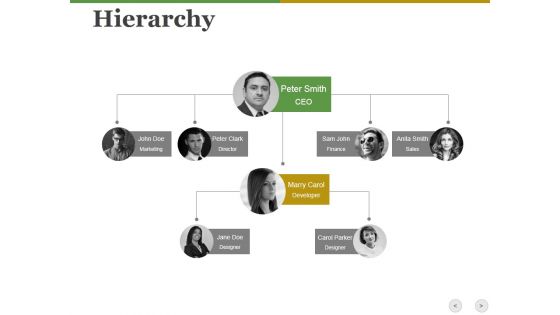
Hierarchy Ppt PowerPoint Presentation Gallery Elements
This is a hierarchy ppt powerpoint presentation gallery elements. This is a four stage process. The stages in this process are marketing, director, ceo, finance, sales, developer, designer.

Organizational Structure Ppt PowerPoint Presentation Show Slides
This is a organizational structure ppt powerpoint presentation show slides. This is a three stage process. The stages in this process are director marketing, director sales, ceo, manager.
Organizational Structure Ppt PowerPoint Presentation File Icon
This is a organizational structure ppt powerpoint presentation file icon. This is a two stage process. The stages in this process are manager, director marketing, director sales, employee.
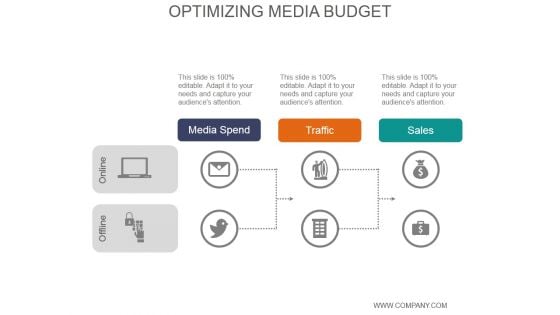
Optimizing Media Budget Ppt PowerPoint Presentation Inspiration
This is a optimizing media budget ppt powerpoint presentation inspiration. This is a three stage process. The stages in this process are media spend, traffic, sales.
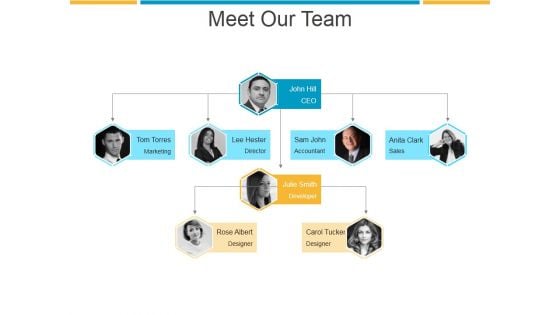
Meet Our Team Ppt PowerPoint Presentation Professional
This is a meet our team ppt powerpoint presentation professional. This is a three stage process. The stages in this process are marketing, director, accountant, sales, designer.
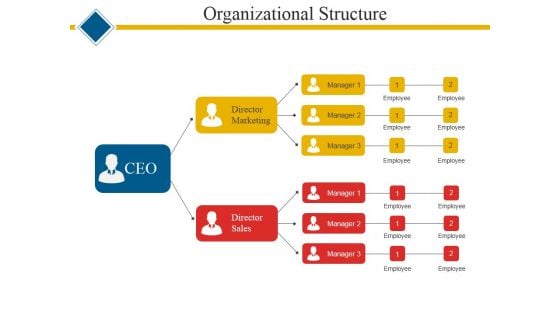
Organizational Structure Ppt PowerPoint Presentation Ideas Samples
This is a organizational structure ppt powerpoint presentation ideas samples. This is a two stage process. The stages in this process are director marketing, director sales, employee, manager.
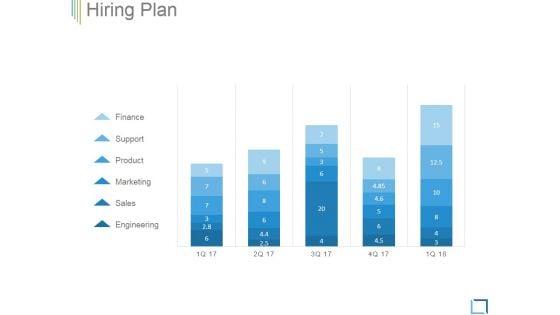
Hiring Plan Ppt PowerPoint Presentation Graphics
This is a hiring plan ppt powerpoint presentation graphics. This is a five stage process. The stages in this process are finance, support, product, marketing, sales, engineering .
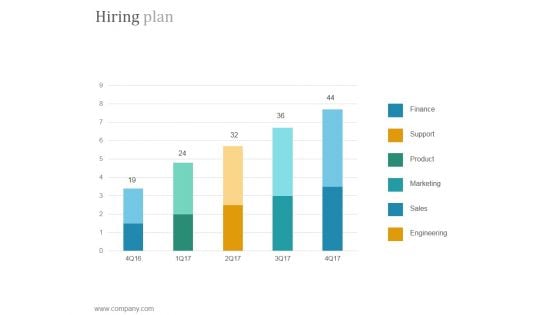
Hiring Plan Ppt PowerPoint Presentation Tips
This is a hiring plan ppt powerpoint presentation tips. This is a five stage process. The stages in this process are finance, support, product, marketing, sales, engineering.
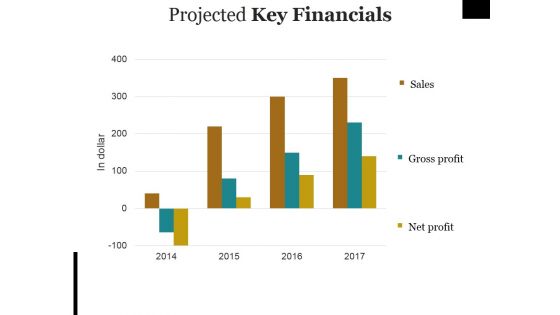
Projected Key Financials Ppt PowerPoint Presentation Pictures Objects
This is a projected key financials ppt powerpoint presentation pictures objects. This is a three stage process. The stages in this process are sales, gross profit, net profit.
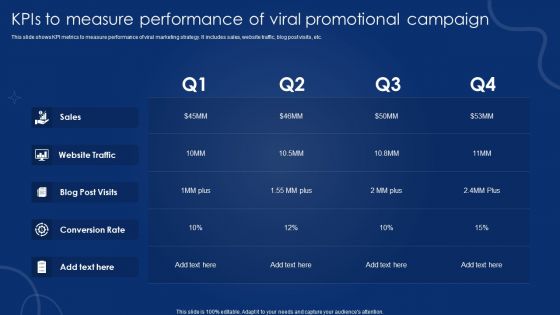
Kpis To Measure Performance Of Viral Promotional Campaign Topics PDF
This slide shows KPI metrics to measure performance of viral marketing strategy. It includes sales, website traffic, blog post visits, etc. Showcasing this set of slides titled Kpis To Measure Performance Of Viral Promotional Campaign Topics PDF. The topics addressed in these templates are Website Traffic, Sales, Blog Post Visits, Conversion Rate. All the content presented in this PPT design is completely editable. Download it and make adjustments in color, background, font etc. as per your unique business setting.
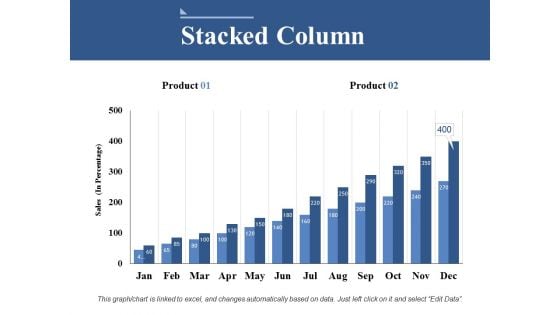
Stacked Column Ppt PowerPoint Presentation Model Information
This is a stacked column ppt powerpoint presentation model information. This is a two stage process. The stages in this process are business, sales, marketing, finance, strategy.
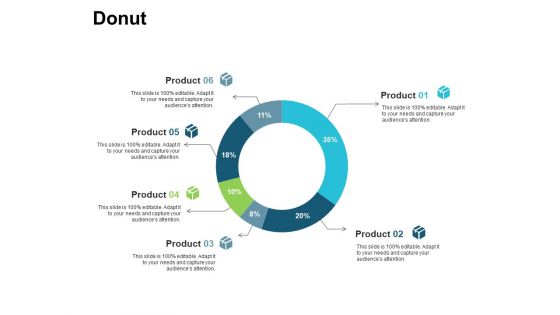
Donut Ppt PowerPoint Presentation Inspiration Files
This is a donut ppt powerpoint presentation inspiration files. This is a six stage process. The stages in this process are business, management, marketing, strategy, sales.
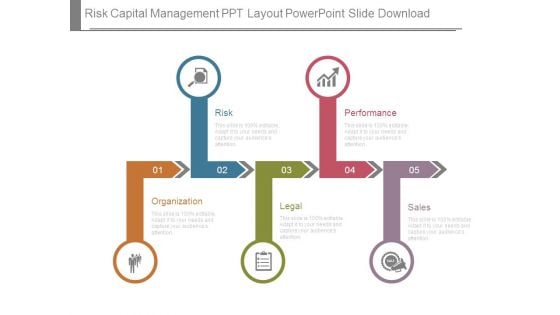
Risk Capital Management Ppt Layout Powerpoint Slide Download
This is a risk capital management ppt layout powerpoint slide download. This is a five stage process. The stages in this process are risk, performance, organization, legal, sales.
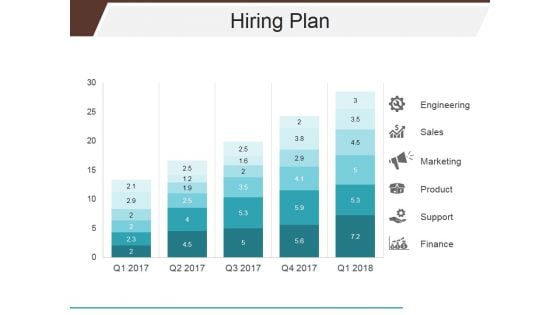
Hiring Plan Ppt PowerPoint Presentation Slide
This is a hiring plan ppt powerpoint presentation slide. This is a five stage process. The stages in this process are engineering, sales, marketing, product, support, finance.
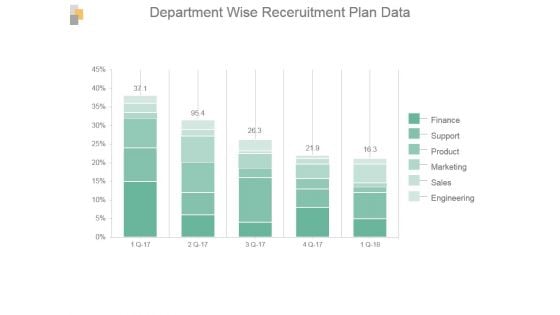
Department Wise Recruitment Plan Data Ppt Infographics
This is a department wise recruitment plan data ppt infographics. This is a five stage process. The stages in this process are finance, support, product, marketing, sales, engineering.
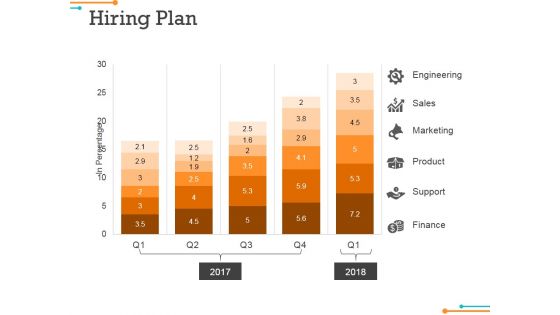
Hiring Plan Ppt Powerpoint Presentation Show Files
This is a hiring plan ppt powerpoint presentation show files. This is a five stage process. The stages in this process are engineering, sales, marketing, product.
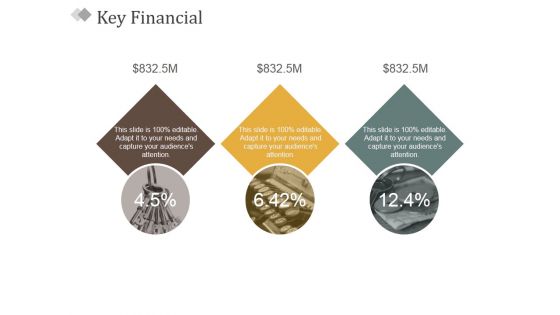
Key Financial Ppt PowerPoint Presentation Inspiration Design Ideas
This is a key financial ppt powerpoint presentation inspiration design ideas. This is a three stage process. The stages in this process are financial, business, sales, marketing, success.
Financial Ppt PowerPoint Presentation Slides Inspiration
This is a financial ppt powerpoint presentation slides inspiration. This is a three stage process. The stages in this process are financial, business, marketing, management, sales.
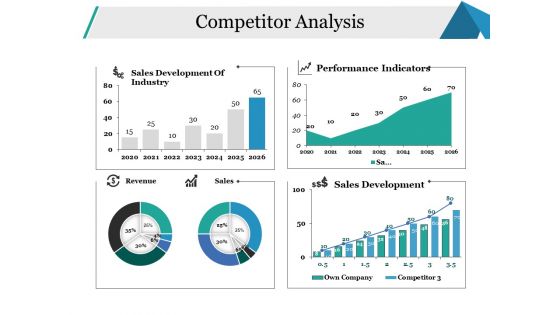
Competitor Analysis Ppt PowerPoint Presentation Infographic Template Elements
This is a competitor analysis ppt powerpoint presentation infographic template elements. This is a four stage process. The stages in this process are revenue, sales, business, marketing, finance.
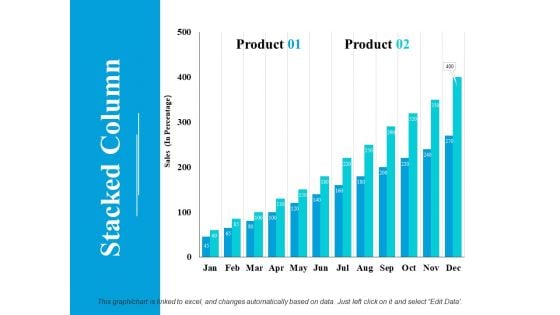
Stacked Column Ppt PowerPoint Presentation Model Inspiration
This is a stacked column ppt powerpoint presentation model inspiration. This is a two stage process. The stages in this process are product, sales, stacked column.
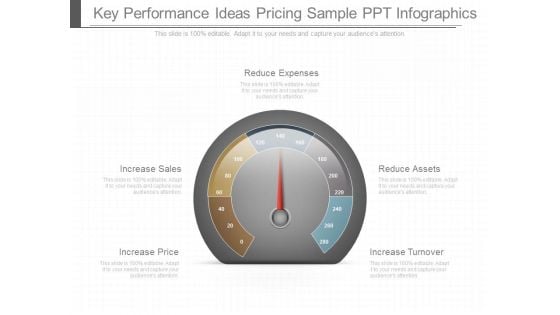
Key Performance Ideas Pricing Sample Ppt Infographics
This is a key performance ideas pricing sample ppt infographics. This is a five stage process. The stages in this process are increase price, increase sales, reduce expenses, reduce assets, increase turnover.
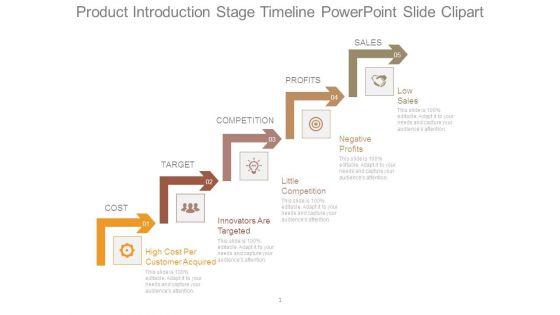
Product Introduction Stage Timeline Powerpoint Slide Clipart
This is a product introduction stage timeline powerpoint slide clipart. This is a five stage process. The stages in this process are cost, target, competition, profits, sales.
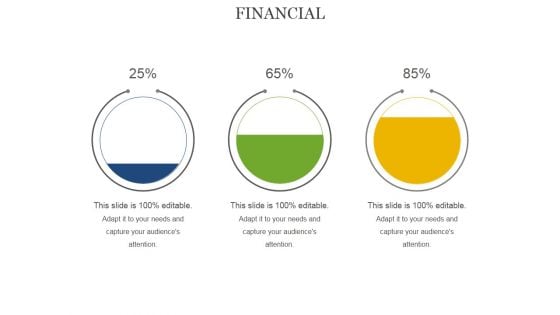
Financial Ppt PowerPoint Presentation Ideas Graphics Download
This is a financial ppt powerpoint presentation ideas graphics download. This is a three stage process. The stages in this process are financial, process., sales, plan, business.
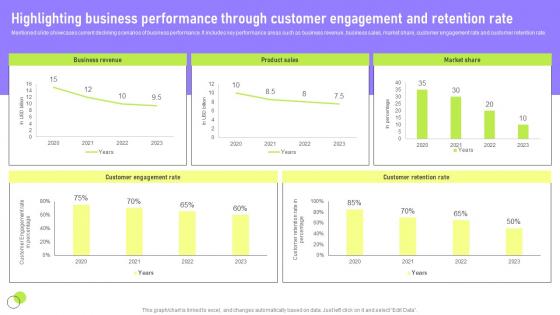
Highlighting Business Performance Deployment Of Marketing Communication Elements Pdf
Mentioned slide showcases current declining scenarios of business performance. It includes key performance areas such as business revenue, business sales, market share, customer engagement rate and customer retention rate. Find highly impressive Highlighting Business Performance Deployment Of Marketing Communication Elements Pdf on Slidegeeks to deliver a meaningful presentation. You can save an ample amount of time using these presentation templates. No need to worry to prepare everything from scratch because Slidegeeks experts have already done a huge research and work for you. You need to download Highlighting Business Performance Deployment Of Marketing Communication Elements Pdf for your upcoming presentation. All the presentation templates are 100 percent editable and you can change the color and personalize the content accordingly. Download now. Mentioned slide showcases current declining scenarios of business performance. It includes key performance areas such as business revenue, business sales, market share, customer engagement rate and customer retention rate.
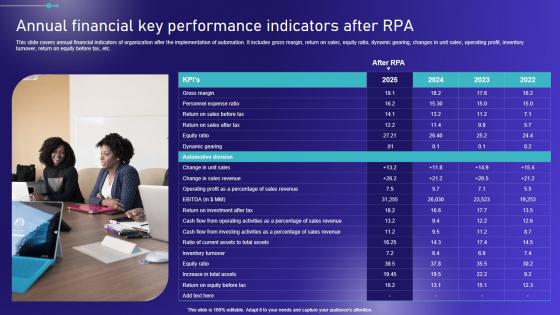
Annual Financial Key Performance Indicators After Embracing Robotic Process Elements PDF
This slide covers annual financial indicators of organization after the implementation of automation. It includes gross margin, return on sales, equity ratio, dynamic gearing, changes in unit sales, operating profit, inventory turnover, return on equity before tax, etc. Slidegeeks is one of the best resources for PowerPoint templates. You can download easily and regulate Annual Financial Key Performance Indicators After Embracing Robotic Process Elements PDF for your personal presentations from our wonderful collection. A few clicks is all it takes to discover and get the most relevant and appropriate templates. Use our Templates to add a unique zing and appeal to your presentation and meetings. All the slides are easy to edit and you can use them even for advertisement purposes. This slide covers annual financial indicators of organization after the implementation of automation. It includes gross margin, return on sales, equity ratio, dynamic gearing, changes in unit sales, operating profit, inventory turnover, return on equity before tax, etc.
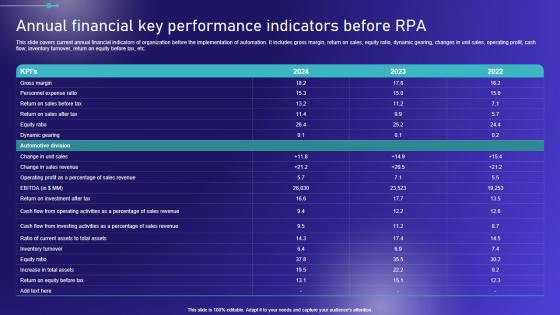
Annual Financial Key Performance Indicators Before Embracing Robotic Process Graphics PDF
This slide covers current annual financial indicators of organization before the implementation of automation. It includes gross margin, return on sales, equity ratio, dynamic gearing, changes in unit sales, operating profit, cash flow, inventory turnover, return on equity before tax, etc. Want to ace your presentation in front of a live audience Our Annual Financial Key Performance Indicators Before Embracing Robotic Process Graphics PDF can help you do that by engaging all the users towards you. Slidegeeks experts have put their efforts and expertise into creating these impeccable powerpoint presentations so that you can communicate your ideas clearly. Moreover, all the templates are customizable, and easy-to-edit and downloadable. Use these for both personal and commercial use. This slide covers current annual financial indicators of organization before the implementation of automation. It includes gross margin, return on sales, equity ratio, dynamic gearing, changes in unit sales, operating profit, cash flow, inventory turnover, return on equity before tax, etc.
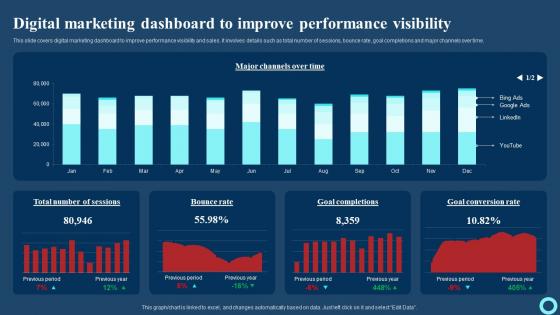
Digital Marketing Dashboard To Improve Performance Effective Strategies To Enhance Background Pdf
This slide covers digital marketing dashboard to improve performance visibility and sales. It involves details such as total number of sessions, bounce rate, goal completions and major channels over time. Do you know about Slidesgeeks Digital Marketing Dashboard To Improve Performance Effective Strategies To Enhance Background Pdf These are perfect for delivering any kind od presentation. Using it, create PowerPoint presentations that communicate your ideas and engage audiences. Save time and effort by using our pre-designed presentation templates that are perfect for a wide range of topic. Our vast selection of designs covers a range of styles, from creative to business, and are all highly customizable and easy to edit. Download as a PowerPoint template or use them as Google Slides themes. This slide covers digital marketing dashboard to improve performance visibility and sales. It involves details such as total number of sessions, bounce rate, goal completions and major channels over time.
The Csr Model Ppt PowerPoint Presentation Model Format Ideas
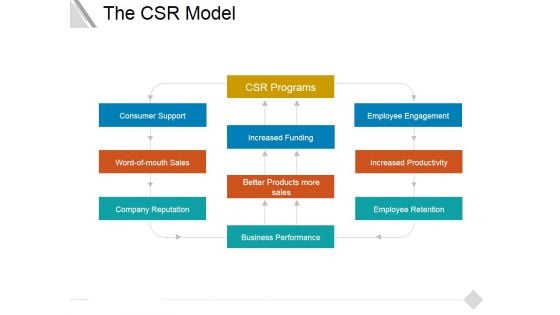
This is a the csr model ppt powerpoint presentation model format ideas. This is a ten stage process. The stages in this process are consumer support, word of mouth sales, company reputation, increased funding, employee engagement, increased productivity, better products more sales, business performance, employee retention.
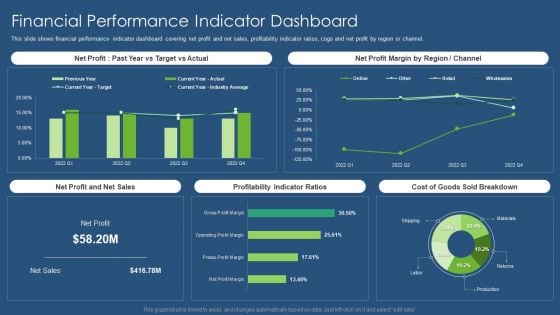
Metrics To Measure Business Performance Financial Performance Indicator Dashboard Pictures PDF
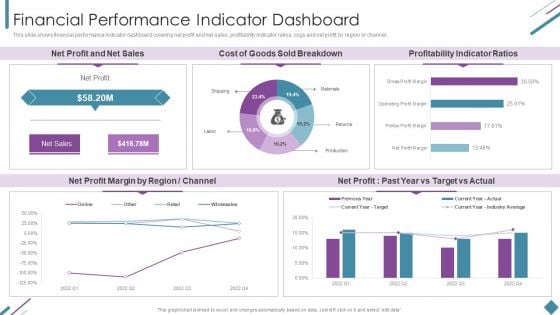
This slide shows financial performance indicator dashboard covering net profit and net sales, profitability indicator ratios, cogs and net profit by region or channel. Deliver an awe inspiring pitch with this creative Metrics To Measure Business Performance Financial Performance Indicator Dashboard Pictures PDF bundle. Topics like Net Profit, Net Sales, Cost Goods, Sold Breakdown can be discussed with this completely editable template. It is available for immediate download depending on the needs and requirements of the user.
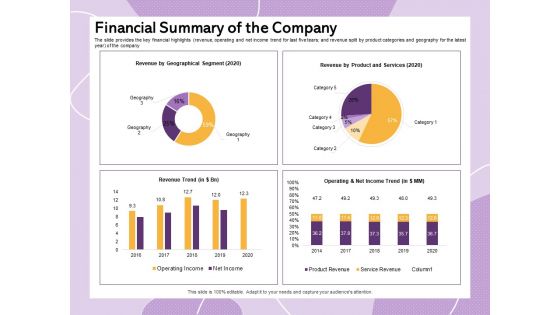
Pitch Deck To Raise Funding From Equity Crowdfunding Financial Summary Of The Company Ppt File Grid PDF
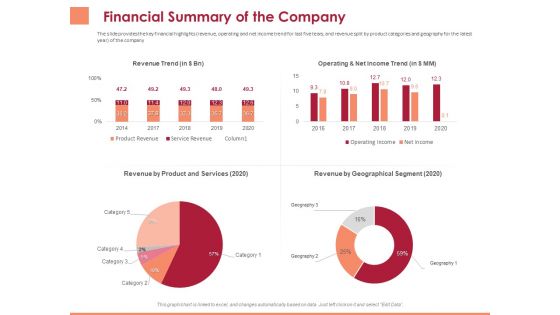
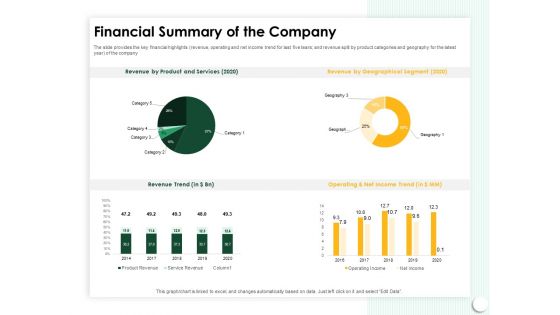
Presenting this set of slides with name pitch deck to raise funding from equity crowdfunding financial summary of the company ppt file grid pdf. The topics discussed in these slides are revenue trend, operating and net income trend, revenue product and services, revenue geographical segment. This is a completely editable PowerPoint presentation and is available for immediate download. Download now and impress your audience.
Startup Presentation For Collaborative Capital Funding Financial Summary Of The Company Diagrams PDF
Presenting this set of slides with name startup presentation for collaborative capital funding financial summary of the company diagrams pdf. The topics discussed in these slides are revenue by product and services 2020, revenue by geographical segment 2020, revenue trend, operating and net income trend. This is a completely editable PowerPoint presentation and is available for immediate download. Download now and impress your audience.
Investor Presentation For Society Funding Financial Summary Of The Company Inspiration PDF
Presenting this set of slides with name investor presentation for society funding financial summary of the company inspiration pdf. The topics discussed in these slides are revenue by product and services 2020, revenue by geographical segment 2020, revenue trend, operating and net income trend. This is a completely editable PowerPoint presentation and is available for immediate download. Download now and impress your audience.
Business Kpi Dashboard Diagram Powerpoint Templates
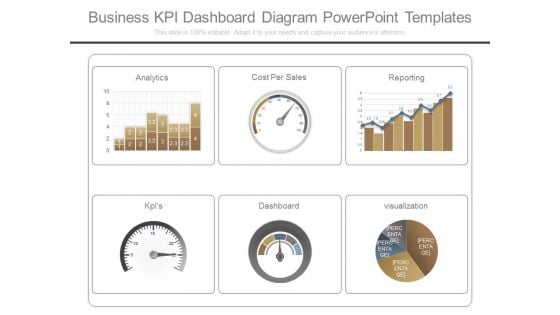
This is a business kpi dashboard diagram powerpoint templates. This is a six stage process. The stages in this process are analytics, cost per sales, reporting, kpis, dashboard, visualization.
Sustainability Calculation With KPI Financial Performance Indicator Dashboard Infographics PDF Template PDF
This slide shows financial performance indicator dashboard covering net profit and net sales, profitability indicator ratios, cogs and net profit by region or channel. Deliver an awe inspiring pitch with this creative sustainability calculation with kpi financial performance indicator dashboard infographics pdf bundle. Topics like net profit margin, net profit and net sales, profitability indicator ratios, sold breakdown can be discussed with this completely editable template. It is available for immediate download depending on the needs and requirements of the user.


 Continue with Email

 Home
Home


