Scatter
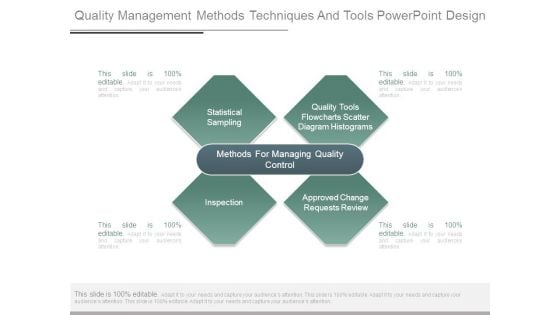
Quality Management Methods Techniques And Tools Powerpoint Design
This is a quality management methods techniques and tools powerpoint design. This is a four stage process. The stages in this process are statistical sampling, quality tools flowcharts scatter diagram histograms, methods for managing quality control, inspection, approved change requests review.
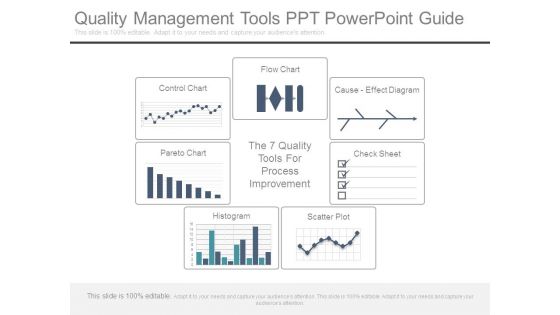
Quality Management Tools Ppt Powerpoint Guide
This is a quality management tools ppt powerpoint guide. This is a seven stage process. The stages in this process are control chart, flow chart, cause effect diagram, pareto chart, the 7 quality tools, for process improvement, check sheet, histogram, scatter plot.
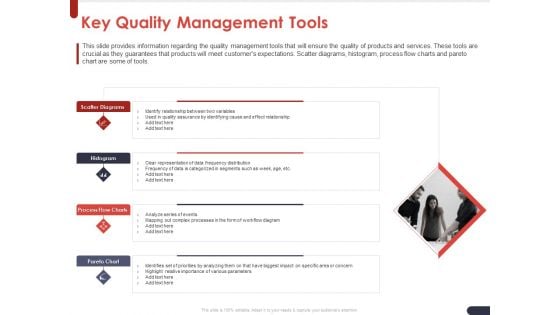
Project Quality Planning And Controlling Key Quality Management Tools Introduction PDF
Presenting this set of slides with name project quality planning and controlling key quality management tools introduction pdf. This is a four stage process. The stages in this process are scatter diagrams, histogram, process flow charts, pareto chart. This is a completely editable PowerPoint presentation and is available for immediate download. Download now and impress your audience.
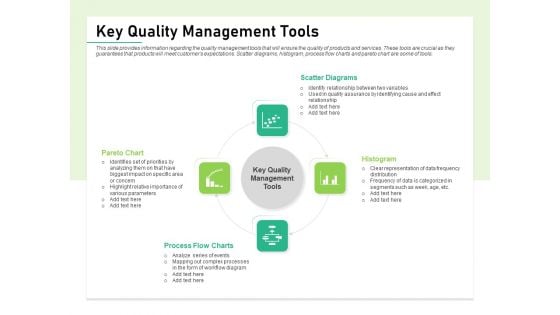
Quality Management Plan QMP Key Quality Management Tools Summary PDF
Presenting this set of slides with name quality management plan qmp key quality management tools summary pdf. This is a four stage process. The stages in this process are scatter diagrams, histogram, process flow charts, pareto chart. This is a completely editable PowerPoint presentation and is available for immediate download. Download now and impress your audience.
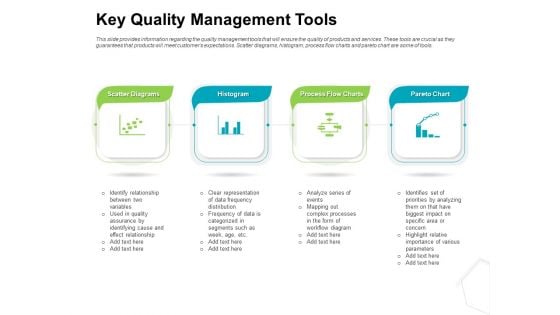
Project Quality Management Plan Key Quality Management Tools Slides PDF
Presenting this set of slides with name project quality management plan key quality management tools slides pdf. This is a four stage process. The stages in this process are scatter diagrams, histogram, process flow charts, pareto chart. This is a completely editable PowerPoint presentation and is available for immediate download. Download now and impress your audience.
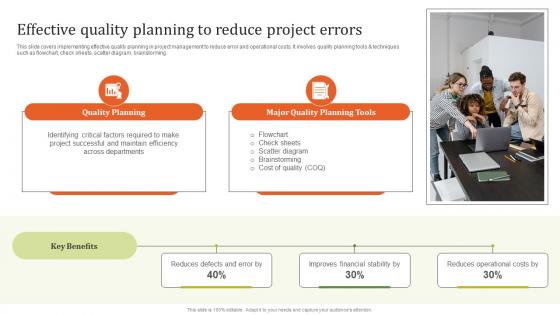
Effective Quality Planning To Executing Effective Quality Enhancement Guidelines Pdf
This slide covers implementing effective quality planning in project management to reduce error and operational costs. It involves quality planning tools and techniques such as flowchart, check sheets, scatter diagram, brainstorming. Do you have an important presentation coming up Are you looking for something that will make your presentation stand out from the rest Look no further than Effective Quality Planning To Executing Effective Quality Enhancement Guidelines Pdf. With our professional designs, you can trust that your presentation will pop and make delivering it a smooth process. And with Slidegeeks, you can trust that your presentation will be unique and memorable. So why wait Grab Effective Quality Planning To Executing Effective Quality Enhancement Guidelines Pdf today and make your presentation stand out from the rest. This slide covers implementing effective quality planning in project management to reduce error and operational costs. It involves quality planning tools and techniques such as flowchart, check sheets, scatter diagram, brainstorming.
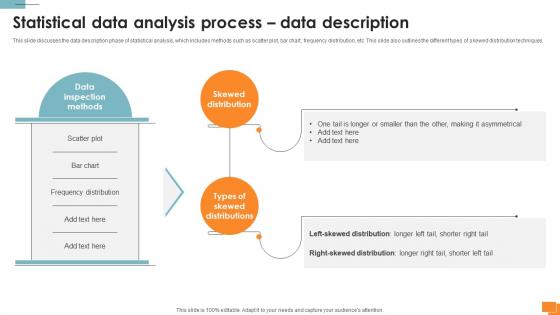
Statistical Tools For Evidence Statistical Data Analysis Process Data Description
This slide discusses the data description phase of statistical analysis, which includes methods such as scatter plot, bar chart, frequency distribution, etc. This slide also outlines the different types of skewed distribution techniques. Do you have to make sure that everyone on your team knows about any specific topic I yes, then you should give Statistical Tools For Evidence Statistical Data Analysis Process Data Description a try. Our experts have put a lot of knowledge and effort into creating this impeccable Statistical Tools For Evidence Statistical Data Analysis Process Data Description. You can use this template for your upcoming presentations, as the slides are perfect to represent even the tiniest detail. You can download these templates from the Slidegeeks website and these are easy to edit. So grab these today This slide discusses the data description phase of statistical analysis, which includes methods such as scatter plot, bar chart, frequency distribution, etc. This slide also outlines the different types of skewed distribution techniques.
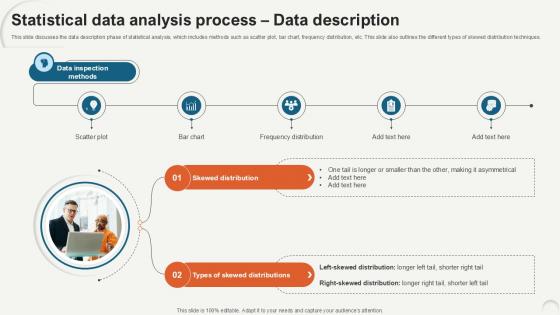
Statistical Data Analysis Process Data Description Ppt Example
This slide discusses the data description phase of statistical analysis, which includes methods such as scatter plot, bar chart, frequency distribution, etc. This slide also outlines the different types of skewed distribution techniques. Create an editable Statistical Data Analysis Process Data Description Ppt Example that communicates your idea and engages your audience. Whether you are presenting a business or an educational presentation, pre-designed presentation templates help save time. Statistical Data Analysis Process Data Description Ppt Example is highly customizable and very easy to edit, covering many different styles from creative to business presentations. Slidegeeks has creative team members who have crafted amazing templates. So, go and get them without any delay. This slide discusses the data description phase of statistical analysis, which includes methods such as scatter plot, bar chart, frequency distribution, etc. This slide also outlines the different types of skewed distribution techniques.
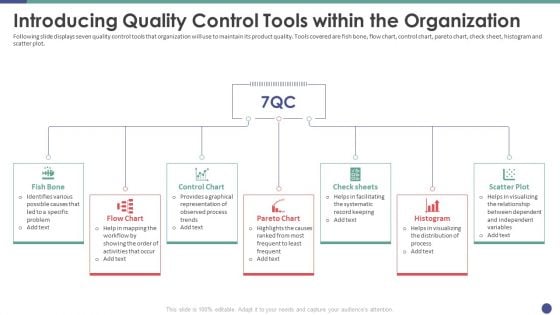
QC Engineering Introducing Quality Control Tools Within The Organization Ppt Infographic Template Design Templates PDF
Following slide displays seven quality control tools that organization will use to maintain its product quality. Tools covered are fish bone, flow chart, control chart, pareto chart, check sheet, histogram and scatter plot. Presenting qc engineering introducing quality control tools within the organization ppt infographic template design templates pdf to provide visual cues and insights. Share and navigate important information on seven stages that need your due attention. This template can be used to pitch topics like fish bone, flow chart, control chart, pareto chart, check sheets. In addtion, this PPT design contains high resolution images, graphics, etc, that are easily editable and available for immediate download.

Quality Assurance Templates Set 3 Seven Basic Quality Control Tools Template PDF
Following slide illustrates seven basic quality control tools that organization may use to maintain its product quality. Tools covered are fish bone, flow chart, control chart, pareto chart, check sheet, histogram and scatter plot. This is a quality assurance templates set 3 seven basic quality control tools template pdf template with various stages. Focus and dispense information on seven stages using this creative set, that comes with editable features. It contains large content boxes to add your information on topics like fish bone, flow charts, control chart, pareto chart, check sheets. You can also showcase facts, figures, and other relevant content using this PPT layout. Grab it now.
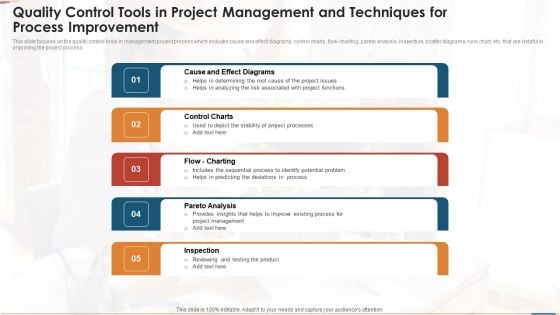
Quality Control Tools In Project Management And Techniques For Process Improvement Guidelines PDF
This slide focuses on the quality control tools in management project process which includes cause and effect diagrams, control charts, flow-charting, pareto analysis, inspection, scatter diagrams, runs chart, etc. that are helpful in improving the project process. Presenting quality control tools in project management and techniques for process improvement guidelines pdf to dispense important information. This template comprises five stages. It also presents valuable insights into the topics including cause and effect diagrams, control charts, flow charting, pareto analysis, inspection. This is a completely customizable PowerPoint theme that can be put to use immediately. So, download it and address the topic impactfully.
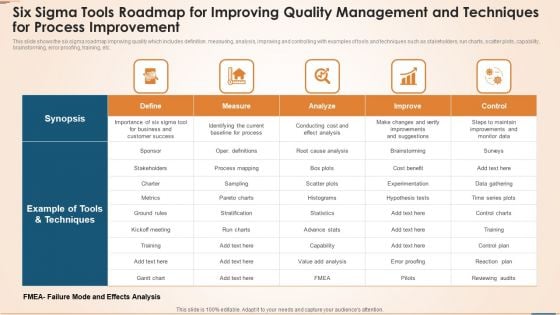
Six Sigma Tools Roadmap For Improving Quality Management And Techniques For Process Improvement Professional PDF
This slide shows the six sigma roadmap improving quality which includes definition, measuring, analysis, improving and controlling with examples of tools and techniques such as stakeholders, run charts, scatter plots, capability, brainstorming, error proofing, training, etc. Pitch your topic with ease and precision using this six sigma tools roadmap for improving quality management and techniques for process improvement professional pdf. This layout presents information on example of tools and techniques, synopsis, improve, control, analyze. It is also available for immediate download and adjustment. So, changes can be made in the color, design, graphics or any other component to create a unique layout.
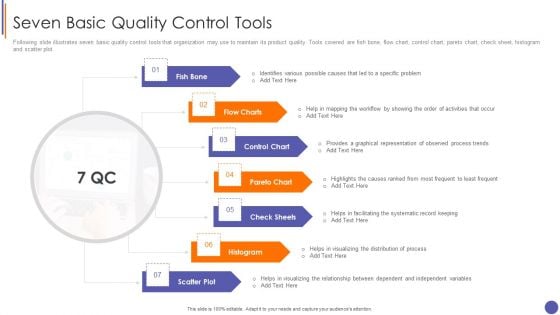
Contents For QA Plan And Process Set 3 Seven Basic Quality Control Tools Demonstration PDF
Following slide illustrates seven basic quality control tools that organization may use to maintain its product quality. Tools covered are fish bone, flow chart, control chart, pareto chart, check sheet, histogram and scatter plot.This is a Contents For QA Plan And Process Set 3 Seven Basic Quality Control Tools Demonstration PDF template with various stages. Focus and dispense information on seven stages using this creative set, that comes with editable features. It contains large content boxes to add your information on topics like Identifies Various, Graphical Representation, Facilitating The Systematic You can also showcase facts, figures, and other relevant content using this PPT layout. Grab it now.
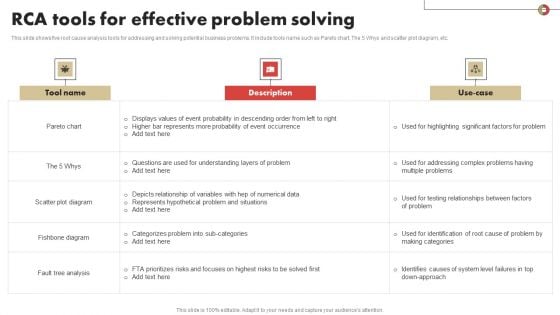
RCA Tools For Effective Problem Solving Portrait PDF
This slide shows five root cause analysis tools for addressing and solving potential business problems. It include tools name such as Pareto chart, The 5 Whys and scatter plot diagram, etc. Showcasing this set of slides titled RCA Tools For Effective Problem Solving Portrait PDF Clipart. The topics addressed in these templates are Tool Name, Description, Problem Solving. All the content presented in this PPT design is completely editable. Download it and make adjustments in color, background, font etc. as per your unique business setting.

New Year 2011 Festival PowerPoint Backgrounds And Templates 0111
Microsoft PowerPoint Template and Background with new year's date among scattered figures Arrive at a complete consensus with our New Year 2011 Festival PowerPoint Backgrounds And Templates 0111. The audience will put all differences aside.

Teal Approaching Land Animals PowerPoint Templates And PowerPoint Backgrounds 0211
Microsoft PowerPoint Template and Background with teal swimming towards step with food scattered Be on the ball with our Teal Approaching Land Animals PowerPoint Templates And PowerPoint Backgrounds 0211. Just download, type and present.
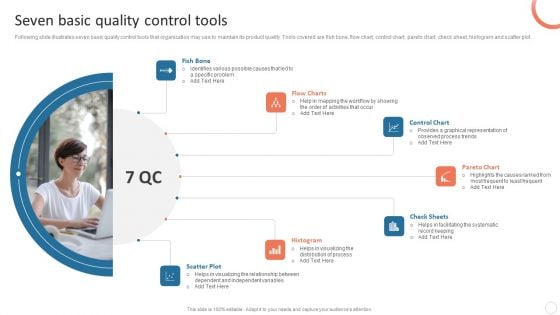
Quality Control Plan Seven Basic Quality Control Tools Brochure PDF
Following slide illustrates seven basic quality control tools that organization may use to maintain its product quality. Tools covered are fish bone, flow chart, control chart, pareto chart, check sheet, histogram and scatter plot. Coming up with a presentation necessitates that the majority of the effort goes into the content and the message you intend to convey. The visuals of a PowerPoint presentation can only be effective if it supplements and supports the story that is being told. Keeping this in mind our experts created Quality Control Plan Seven Basic Quality Control Tools Brochure PDF to reduce the time that goes into designing the presentation. This way, you can concentrate on the message while our designers take care of providing you with the right template for the situation.
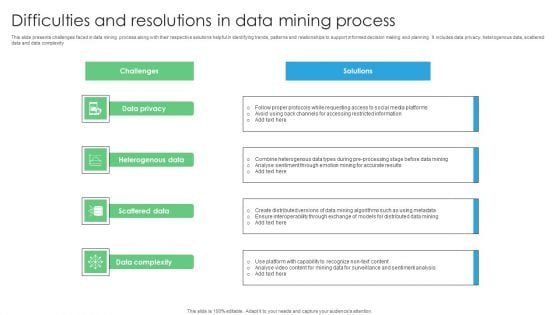
Difficulties And Resolutions In Data Mining Process Diagrams PDF
This slide presents challenges faced in data mining process along with their respective solutions helpful in identifying trends, patterns and relationships to support informed decision making and planning. It includes data privacy, heterogenous data, scattered data and data complexity. Introducing Difficulties And Resolutions In Data Mining Process Diagrams PDF. to increase your presentation threshold. Encompassed with four stages, this template is a great option to educate and entice your audience. Dispence information on Data Privacy, Heterogenous Data, Scattered Data, using this template. Grab it now to reap its full benefits.
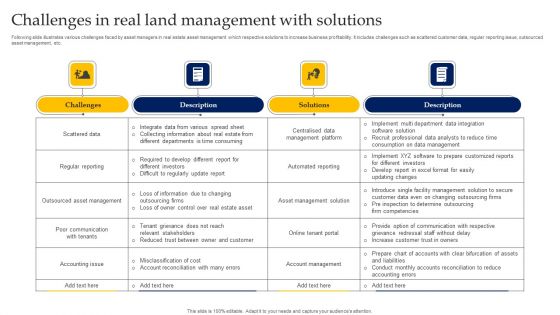
Challenges In Real Land Management With Solutions Guidelines PDF
Following slide illustrates various challenges faced by asset managers in real estate asset management which respective solutions to increase business profitability. It includes challenges such as scattered customer data, regular reporting issue, outsourced asset management, etc. Pitch your topic with ease and precision using this Challenges In Real Land Management With Solutions Guidelines PDF. This layout presents information on Outsourced Asset Management, Scattered Data, Collecting Information. It is also available for immediate download and adjustment. So, changes can be made in the color, design, graphics or any other component to create a unique layout.

Challenges And Solutions In Data Mining Process PPT Slides SS
This slide presents challenges faced in data mining process along with their respective solutions helpful in identifying trends, patterns and relationships to support informed decision making and planning. It includes data privacy, heterogenous data, scattered data and data complexity. Boost your pitch with our creative Challenges And Solutions In Data Mining Process PPT Slides SS. Deliver an awe-inspiring pitch that will mesmerize everyone. Using these presentation templates you will surely catch everyones attention. You can browse the ppts collection on our website. We have researchers who are experts at creating the right content for the templates. So you do not have to invest time in any additional work. Just grab the template now and use them. This slide presents challenges faced in data mining process along with their respective solutions helpful in identifying trends, patterns and relationships to support informed decision making and planning. It includes data privacy, heterogenous data, scattered data and data complexity
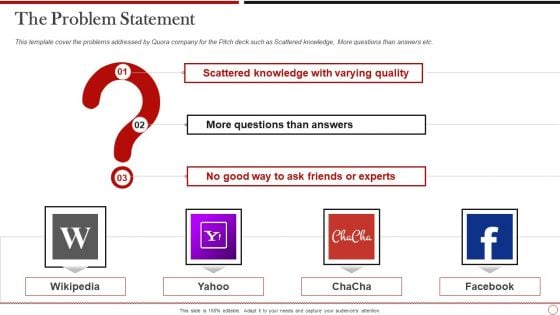
Quora Investor Funding The Problem Statement Template PDF
This template cover the problems addressed by Quora company for the Pitch deck such as Scattered knowledge, More questions than answers etc. Presenting quora investor funding the problem statement template pdf to provide visual cues and insights. Share and navigate important information on four stages that need your due attention. This template can be used to pitch topics like the problem statement. In addtion, this PPT design contains high resolution images, graphics, etc, that are easily editable and available for immediate download.

Colorful Puzzle Pieces PowerPoint Templates And PowerPoint Themes 1012
Colorful Puzzle Pieces PowerPoint Templates And PowerPoint Themes 1012-This is a High resolution 3d Business PowerPoint Template showing the Scattered pieces of Puzzles. This template represents the concept of business, dice, discount, earn, fall, finance, financial, growth, interest, investment, loss, luck, market, mathematical and money. Create captivating presentations to deliver comparative and weighted arguments.-Colorful Puzzle Pieces PowerPoint Templates And PowerPoint Themes 1012-This PowerPoint template can be used for presentations relating to-Colorful puzzle pieces, puzzles or jigsaws, teamwork, business, shapes, marketing Create an absorbing atmosphere with our Colorful Puzzle Pieces PowerPoint Templates And PowerPoint Themes 1012. Ensure your audience remains attentive.
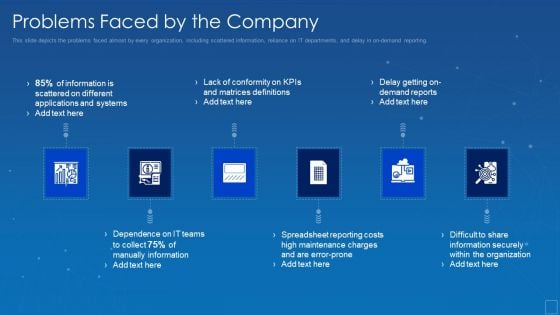
Oracle Cloud Data Analytics Administration IT Problems Faced By The Company Structure PDF
This slide depicts the problems faced almost by every organization, including scattered information, reliance on IT departments, and delay in on demand reporting. Presenting oracle cloud data analytics administration it problems faced by the company structure pdf to provide visual cues and insights. Share and navigate important information on six stages that need your due attention. This template can be used to pitch topics like systems, applications, information, conformity, matrices. In addtion, this PPT design contains high resolution images, graphics, etc, that are easily editable and available for immediate download.
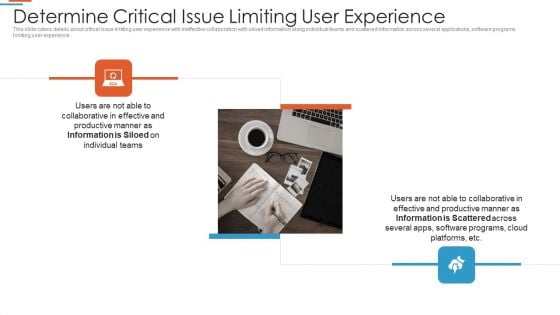
Efficiency Administration Software Investor Financing Determine Critical Issue Rules PDF
This slide caters details about critical issue limiting user experience with ineffective collaboration with siloed information along individual teams and scattered information across several applications, software programs limiting user experience. Presenting efficiency administration software investor financing determine critical issue rules pdf to provide visual cues and insights. Share and navigate important information on two stages that need your due attention. This template can be used to pitch topics like determine critical issue limiting user experience. In addtion, this PPT design contains high resolution images, graphics, etc, that are easily editable and available for immediate download.

Organizational Productivity Administration Software Determine Critical Issue Limiting User Experience Professional PDF
This slide caters details about critical issue limiting user experience with ineffective collaboration with siloed information along individual teams and scattered information across several applications, software programs limiting user experience. This is a organizational productivity administration software determine critical issue limiting user experience professional pdf template with various stages. Focus and dispense information on two stages using this creative set, that comes with editable features. It contains large content boxes to add your information on topics like several apps, software programs, cloud platforms. You can also showcase facts, figures, and other relevant content using this PPT layout. Grab it now.

Determine Critical Issue Limiting User Experience Notion Investor Elevator Introduction PDF
This slide caters details about critical issues of scattered information across several applications, software programs limiting user experience. This is a determine critical issue limiting user experience notion investor elevator introduction pdf template with various stages. Focus and dispense information on one stages using this creative set, that comes with editable features. It contains large content boxes to add your information on topics like determine critical issue limiting user experience. You can also showcase facts, figures, and other relevant content using this PPT layout. Grab it now.
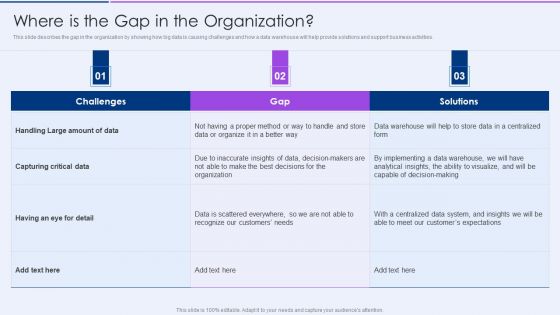
Executive Information Database System Where Is The Gap In The Organization Background PDF
This slide describes the gap in the organization by showing how big data is causing challenges and how a data warehouse will help provide solutions and support business activities.Deliver and pitch your topic in the best possible manner with this Executive Information Database System Where Is The Gap In The Organization Background PDF. Use them to share invaluable insights on Capturing Critical, Amount Of Data, Data Is Scattered and impress your audience. This template can be altered and modified as per your expectations. So, grab it now.

Associated Data IT What Are Triples In Linked Data Template PDF
This slide represents the overview of triples in linked data and how it connects scattered data sets, indexes them for semantic search, and enriches them with text analysis to create large knowledge graphs. Triples are essential elements of linked data. Deliver an awe inspiring pitch with this creative Associated Data IT What Are Triples In Linked Data Template PDF bundle. Topics like Fundamental Elements, Environments, Dynamic can be discussed with this completely editable template. It is available for immediate download depending on the needs and requirements of the user.
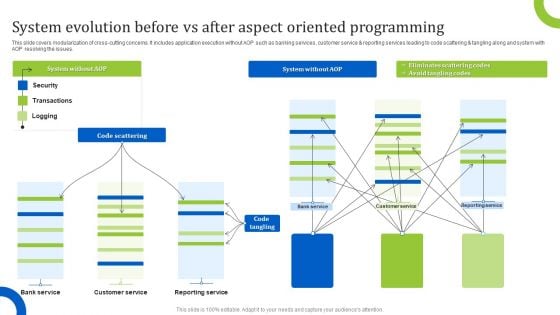
System Evolution Before Vs After Aspect Oriented Programming Download PDF
This slide covers modularization of cross cutting concerns. It includes application execution without AOP such as banking services, customer service and reporting services leading to code scattering and tangling along and system with AOP resolving the issues. Showcasing this set of slides titled System Evolution Before Vs After Aspect Oriented Programming Download PDF. The topics addressed in these templates are System Evolution, Before After Aspect, Oriented Programming . All the content presented in this PPT design is completely editable. Download it and make adjustments in color, background, font etc. as per your unique business setting.
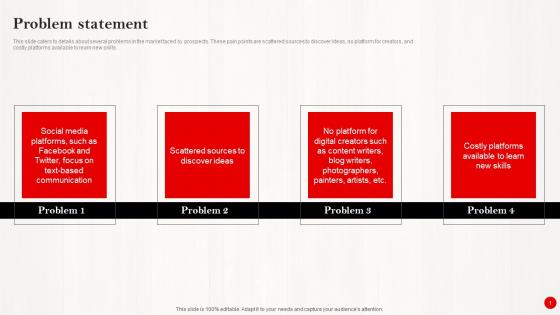
Problem Statement Investor Funding Pitch Deck For Pinterests Expansion Professional Pdf
This slide caters to details about several problems in the market faced by prospects. These pain points are scattered sources to discover ideas, no platform for creators, and costly platforms available to learn new skills. Formulating a presentation can take up a lot of effort and time, so the content and message should always be the primary focus. The visuals of the PowerPoint can enhance the presenters message, so our Problem Statement Investor Funding Pitch Deck For Pinterests Expansion Professional Pdf was created to help save time. Instead of worrying about the design, the presenter can concentrate on the message while our designers work on creating the ideal templates for whatever situation is needed. Slidegeeks has experts for everything from amazing designs to valuable content, we have put everything into Problem Statement Investor Funding Pitch Deck For Pinterests Expansion Professional Pdf This slide caters to details about several problems in the market faced by prospects. These pain points are scattered sources to discover ideas, no platform for creators, and costly platforms available to learn new skills.
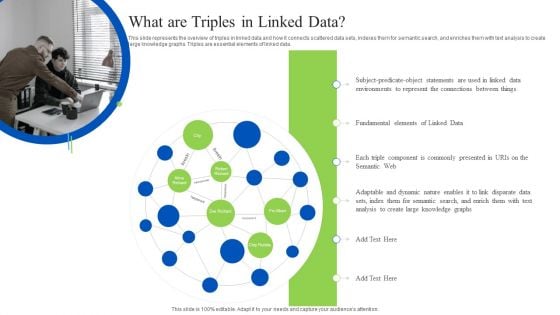
Linked Data Visualization What Are Triples In Linked Data Ppt Model Topics PDF
This slide represents the overview of triples in linked data and how it connects scattered data sets, indexes them for semantic search, and enriches them with text analysis to create large knowledge graphs. Triples are essential elements of linked data. Retrieve professionally designed Linked Data Visualization What Are Triples In Linked Data Ppt Model Topics PDF to effectively convey your message and captivate your listeners. Save time by selecting pre-made slideshows that are appropriate for various topics, from business to educational purposes. These themes come in many different styles, from creative to corporate, and all of them are easily adjustable and can be edited quickly. Access them as PowerPoint templates or as Google Slides themes. You dont have to go on a hunt for the perfect presentation because Slidegeeks got you covered from everywhere.

What Are Triples In Linked Data Integrating Linked Data To Enhance Operational Effectiveness Ideas PDF
This slide represents the overview of triples in linked data and how it connects scattered data sets, indexes them for semantic search, and enriches them with text analysis to create large knowledge graphs. Triples are essential elements of linked data.Explore a selection of the finest What Are Triples In Linked Data Integrating Linked Data To Enhance Operational Effectiveness Ideas PDF here. With a plethora of professionally designed and pre-made slide templates, you can quickly and easily find the right one for your upcoming presentation. You can use our What Are Triples In Linked Data Integrating Linked Data To Enhance Operational Effectiveness Ideas PDF to effectively convey your message to a wider audience. Slidegeeks has done a lot of research before preparing these presentation templates. The content can be personalized and the slides are highly editable. Grab templates today from Slidegeeks.
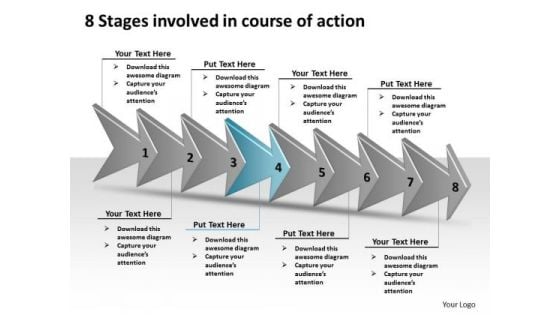
8 Stages Involved Course Of Action Make Flowchart PowerPoint Slides
We present our 8 stages involved course of action make flowchart PowerPoint Slides.Use our Leadership PowerPoint Templates because this diagram can be used to illustrate the logical path or system. Download and present our Shapes PowerPoint Templates because with the help of our Slides you can Illustrate your plans on using the many social media modes available to inform soceity at large of the benefits of your product. Use our Signs PowerPoint Templates because you must Evolve the strategy to take you down the required path with appropriate, efficient and effective marketing along the way. Download our Arrows PowerPoint Templates because we provide the means to project your views. Download and present our Process and Flows PowerPoint Templates because the Venn graphic comprising interlinking circles geometrically demonstate how various functions operating independantly, to a large extent, are essentially interdependant.Use these PowerPoint slides for presentations relating to Designator, blue bottom, circular cobalt banner, clean group badge, clear directional, crimson application icon, down load, download, circle marker, filter grain, front, grunge, grungy, internet page site, left orientation, magenta cursor symbol, monochromatic texture, monochrome pattern, navigation panel, next indicator, noise effect, Arrows sign, push, red pointer pictogram, redo, right, round shape, scattered surface,. The prominent colors used in the PowerPoint template are Blue light, White, Gray. The feedback we get is that our 8 stages involved course of action make flowchart PowerPoint Slides are Pleasant. People tell us our cobalt PowerPoint templates and PPT Slides are Attractive. We assure you our 8 stages involved course of action make flowchart PowerPoint Slides are Upbeat. Presenters tell us our cobalt PowerPoint templates and PPT Slides are One-of-a-kind. We assure you our 8 stages involved course of action make flowchart PowerPoint Slides will make you look like a winner. Use our group PowerPoint templates and PPT Slides are Splendid. Beat mediocrity with our 8 Stages Involved Course Of Action Make Flowchart PowerPoint Slides. You will come out on top.
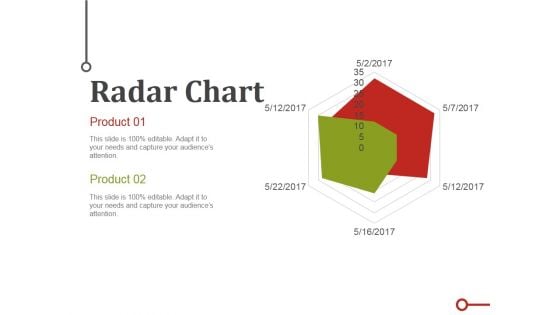
Radar Chart Ppt PowerPoint Presentation Infographics Templates
This is a radar chart ppt powerpoint presentation infographics templates. This is a two stage process. The stages in this process are business, marketing, charts, radar, scatter.
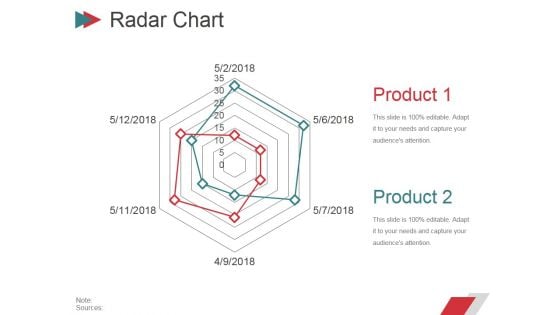
Radar Chart Ppt PowerPoint Presentation Summary Introduction
This is a radar chart ppt powerpoint presentation summary introduction. This is a six stage process. The stages in this process are business, marketing, scatter, radar, chart.
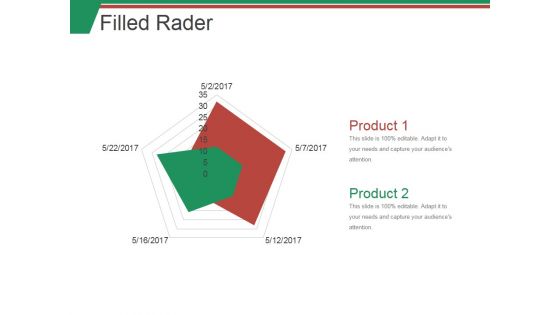
Filled Rader Ppt PowerPoint Presentation Example
This is a filled rader ppt powerpoint presentation example. This is a five stage process. The stages in this process are business, graph, scatter, marketing, planning.
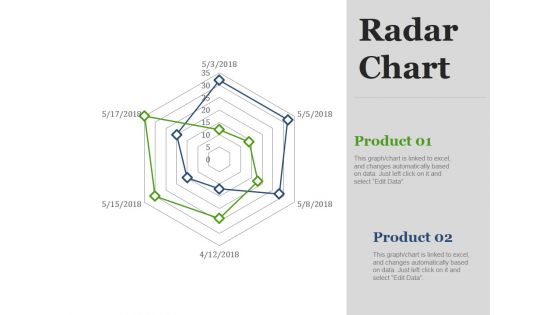
Radar Chart Ppt PowerPoint Presentation Model Slide Portrait
This is a radar chart ppt powerpoint presentation model slide portrait. This is a six stage process. The stages in this process are charts, scatter, business, marketing, planning.
Quality Management And Quality Control Diagram Ppt Slides
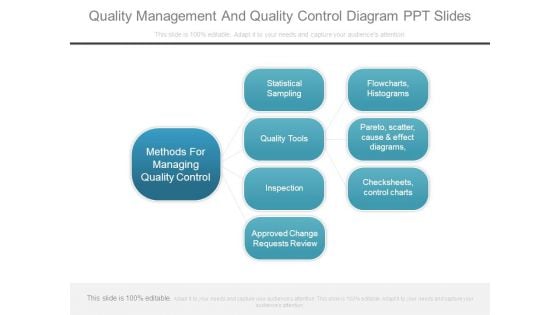
This is a quality management and quality control diagram ppt slides. This is a three stage process. The stages in this process are methods for managing quality control, statistical sampling, quality tools, inspection, approved change requests review, flowcharts, histograms, pareto, scatter, cause and effect diagrams, checksheets, control charts.
Graphical Representation Of Research IT Bivariate Analysis Techniques Formats PDF
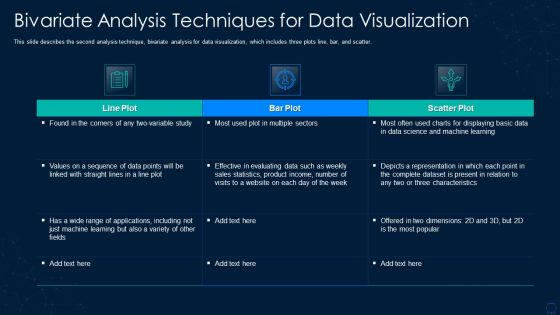
This slide describes the second analysis technique, bivariate analysis for data visualization, which includes three plots line, bar, and scatter. Deliver and pitch your topic in the best possible manner with this graphical representation of research it bivariate analysis techniques formats pdf. Use them to share invaluable insights on bivariate analysis techniques for data visualization and impress your audience. This template can be altered and modified as per your expectations. So, grab it now.
Branches For Visualization Research And Development Bivariate Analysis Techniques For Data Structure PDF
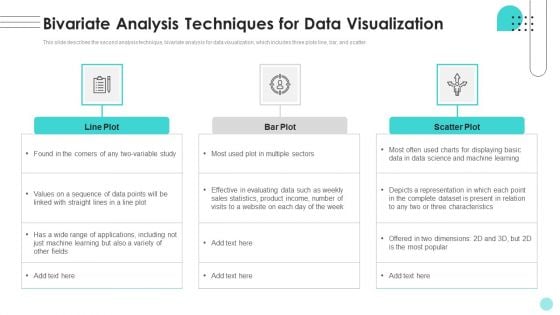
This slide describes the second analysis technique, bivariate analysis for data visualization, which includes three plots line, bar, and scatter. There are so many reasons you need a Branches For Visualization Research And Development Bivariate Analysis Techniques For Data Structure PDF. The first reason is you cant spend time making everything from scratch, Thus, Slidegeeks has made presentation templates for you too. You can easily download these templates from our website easily.
Ppt Brown Crossword Puzzle PowerPoint Template Step Templates
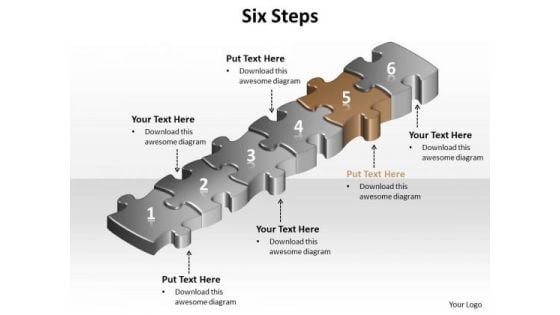
PPT brown crossword puzzle powerpoint template step Templates-This PowerPoint Diagram shows the Complete Process Represented by Puzzles. It signifies the Whole Process that is involved in Business. This PowerPoint diagram will fit for Business Presentations.-PPT brown crossword puzzle powerpoint template step Templates-1, 2, 3, 4, 5, 6, abstract, alphabet, background, beginning, blue, calculations, childhood, colorful, count, cutout, design, easy, education, eight, elementary, figure, fun, green, indoor, isolated, knowledge, learn, letter, maths, nine, number, object, one, pieces, play, preschool, puzzle, scattered, step, still, studio, symbol, text, three, two, type, typeset, white, yellow Get people out of bed with our Ppt Brown Crossword Puzzle PowerPoint Template Step Templates. Just download, type and present.
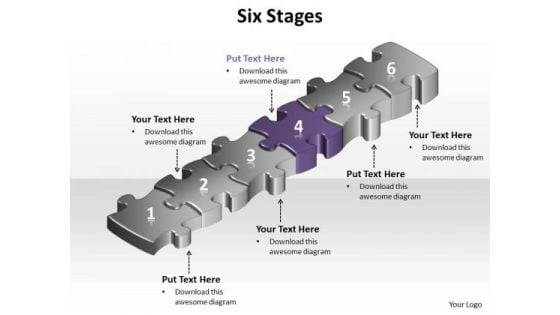
Ppt Purple Puzzle Step PowerPoint Templates
PPT purple puzzle step PowerPoint Templates-This PowerPoint Diagram shows the Complete Process Represented by Puzzle. It signifies the Whole Process that is involved in Business. This PowerPoint diagram will fit for Business Presentations.-PPT purple puzzle step PowerPoint Templates-1, 2, 3, 4, 5, 6, abstract, alphabet, background, beginning, blue, calculations, childhood, colorful, count, cutout, design, easy, education, eight, elementary, figure, fun, green, indoor, isolated, knowledge, learn, letter, maths, nine, number, object, one, pieces, play, preschool, puzzle, scattered, step, still, studio, symbol, text, three, two, type, typeset, white, yellow Our Ppt Purple Puzzle Step PowerPoint Templates aredelightfully crafted. Designed to charm the biggest disbelievers.
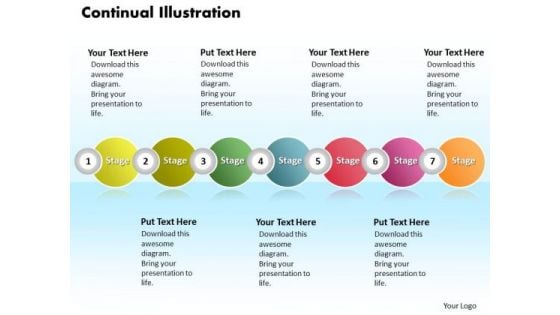
Ppt Continual Illustration Of Action Using 7 State Diagram PowerPoint Templates
PPT continual illustration of action using 7 state diagram PowerPoint Templates-We have designed this diagram in all loops up to 7stages. You can edit color to fit your own needs. This type of slide is particularly well suited to showing ongoing education.-PPT continual illustration of action using 7 state diagram PowerPoint Templates-Abstract, Art, Stic, Background, Beautiful, Circles, Concept, Create, Decorative, Design, Detail, Digital, Faded, Fun, Gradient, Graphic, Illustration, Ink, Multicolored, Nostalgia, Outline, Pattern, Scattered, Shape, Spot, Spring, Stylistic Keep your thoughts evergreen with our Ppt Continual Illustration Of Action Using 7 State Diagram PowerPoint Templates. They will stay fresh and relevant for long.
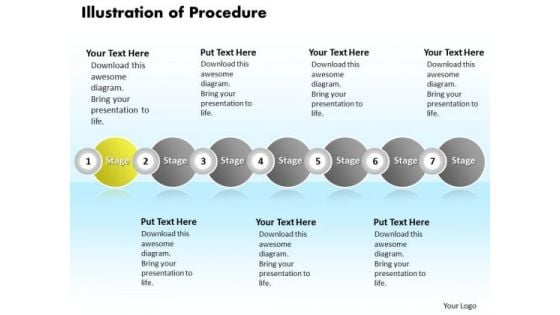
Ppt Continual Illustration Of Agenda Using 7 Power Point Stage PowerPoint Templates
PPT continual illustration of agenda using 7 power point stage PowerPoint Templates-We have designed this diagram in all loops up to 7stages. You can edit color to fit your own needs. This type of slide is particularly well suited to showing ongoing education.-PPT continual illustration of agenda using 7 power point stage PowerPoint Templates-Abstract, Art, Stic, Background, Beautiful, Circles, Concept, Create, Decorative, Design, Detail, Digital, Faded, Fun, Gradient, Graphic, Illustration, Ink, Multicolored, Nostalgia, Outline, Pattern, Scattered, Shape, Spot, Spring, Stylistic Your thoughts will leave an everlasting image. Etch them in the memory with our Ppt Continual Illustration Of Agenda Using 7 Power Point Stage PowerPoint Templates.
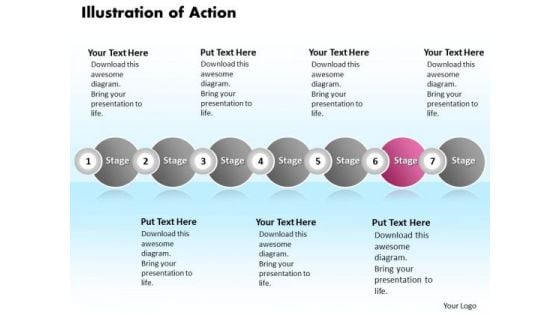
Ppt Continual Illustration Of Procedure Using 7 Stages PowerPoint Templates
PPT continual illustration of procedure using 7 stages PowerPoint Templates-We have designed this diagram in all loops up to 7stages. You can edit color to fit your own needs. This type of slide is particularly well suited to showing ongoing education.-PPT continual illustration of procedure using 7 stages PowerPoint Templates-Abstract, Art, Stic, Background, Beautiful, Circles, Concept, Create, Decorative, Design, Detail, Digital, Faded, Fun, Gradient, Graphic, Illustration, Ink, Multicolored, Nostalgia, Outline, Pattern, Scattered, Shape, Spot, Spring, Stylistic Leave a good taste with our Ppt Continual Illustration Of Procedure Using 7 Stages PowerPoint Templates. They always add to the fare.
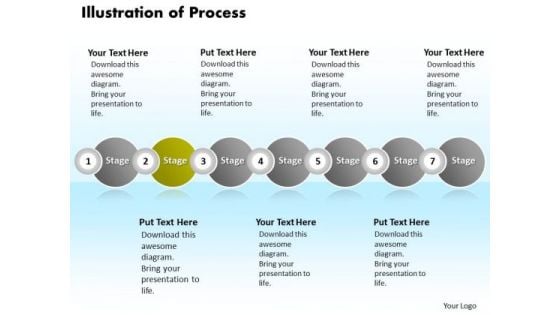
Ppt Continual Illustration Of Process Using 7 Stages PowerPoint Templates
PPT continual illustration of process using 7 stages PowerPoint Templates-We have designed this diagram in all loops up to 7stages. You can edit color to fit your own needs. This type of slide is particularly well suited to showing ongoing education.-PPT continual illustration of process using 7 stages PowerPoint Templates-Abstract, Art, Stic, Background, Beautiful, Circles, Concept, Create, Decorative, Design, Detail, Digital, Faded, Fun, Gradient, Graphic, Illustration, Ink, Multicolored, Nostalgia, Outline, Pattern, Scattered, Shape, Spot, Spring, Stylistic Open their eyes with our Ppt Continual Illustration Of Process Using 7 Stages PowerPoint Templates. Acquaint them with the new challenges coming their way.
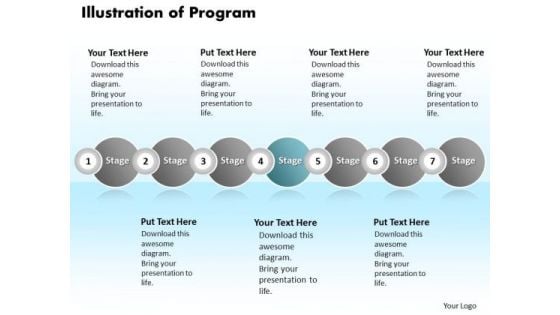
Ppt Continual Illustration Of Program Using 7 Power Point Stage PowerPoint Templates
PPT continual illustration of program using 7 power point stage PowerPoint Templates-We have designed this diagram in all loops up to 7stages. You can edit color to fit your own needs. This type of slide is particularly well suited to showing ongoing education.-PPT continual illustration of program using 7 power point stage PowerPoint Templates-Abstract, Art, Stic, Background, Beautiful, Circles, Concept, Create, Decorative, Design, Detail, Digital, Faded, Fun, Gradient, Graphic, Illustration, Ink, Multicolored, Nostalgia, Outline, Pattern, Scattered, Shape, Spot, Spring, Stylistic Our Ppt Continual Illustration Of Program Using 7 Power Point Stage PowerPoint Templates have a enabling effect. They allow youto act as per your choice.

Ppt Continual Illustration Of Scheme Using 7 State Diagram PowerPoint Templates
PPT continual illustration of scheme using 7 state diagram PowerPoint Templates-We have designed this diagram in all loops up to 7stages. You can edit color to fit your own needs. This type of slide is particularly well suited to showing ongoing education.-PPT continual illustration of scheme using 7 state diagram PowerPoint Templates-Abstract, Art, Stic, Background, Beautiful, Circles, Concept, Create, Decorative, Design, Detail, Digital, Faded, Fun, Gradient, Graphic, Illustration, Ink, Multicolored, Nostalgia, Outline, Pattern, Scattered, Shape, Spot, Spring, Stylistic Take your audience on a fantastic journey. Allow them entry with our Ppt Continual Illustration Of Scheme Using 7 State Diagram PowerPoint Templates.
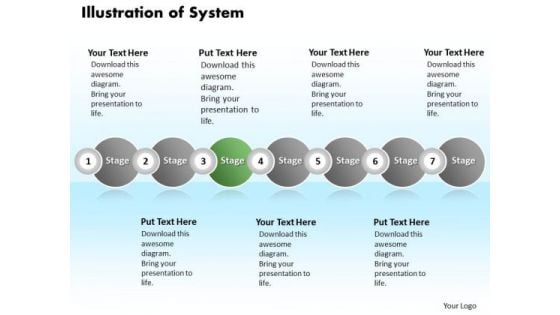
Ppt Continual Illustration Of System Using 7 State Diagram PowerPoint Templates
PPT continual illustration of system using 7 state diagram PowerPoint Templates-We have designed this diagram in all loops up to 7stages. You can edit color to fit your own needs. This type of slide is particularly well suited to showing ongoing education.-PPT continual illustration of system using 7 state diagram PowerPoint Templates-Abstract, Art, Stic, Background, Beautiful, Circles, Concept, Create, Decorative, Design, Detail, Digital, Faded, Fun, Gradient, Graphic, Illustration, Ink, Multicolored, Nostalgia, Outline, Pattern, Scattered, Shape, Spot, Spring, Stylistic Develop their craving for your creativity. Become a brand name with our Ppt Continual Illustration Of System Using 7 State Diagram PowerPoint Templates.
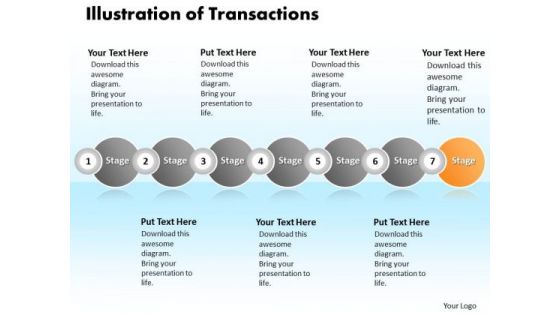
Ppt Continual Illustration Of Transactions Using 7 Phase Diagram PowerPoint Templates
PPT continual illustration of transactions using 7 phase diagram PowerPoint Templates-We have designed this diagram in all loops up to 7stages. You can edit color to fit your own needs. This type of slide is particularly well suited to showing ongoing education.-PPT continual illustration of transactions using 7 phase diagram PowerPoint Templates-Abstract, Art, Stic, Background, Beautiful, Circles, Concept, Create, Decorative, Design, Detail, Digital, Faded, Fun, Gradient, Graphic, Illustration, Ink, Multicolored, Nostalgia, Outline, Pattern, Scattered, Shape, Spot, Spring, Stylistic Address them in your charismatic style. Boost your aura with our Ppt Continual Illustration Of Transactions Using 7 Phase Diagram PowerPoint Templates.

Departments Of Visualization Research Bivariate Analysis Techniques For Data Visualization Ideas PDF
This slide describes the second analysis technique, bivariate analysis for data visualization, which includes three plots line, bar, and scatter.This is a Departments Of Visualization Research Bivariate Analysis Techniques For Data Visualization Ideas PDF template with various stages. Focus and dispense information on three stages using this creative set, that comes with editable features. It contains large content boxes to add your information on topics like Effective In Evaluating, Displaying Basic, Range Of Applications, Including You can also showcase facts, figures, and other relevant content using this PPT layout. Grab it now.

Sustainable Energy Installation Of Wind Turbines We Offer Ppt PowerPoint Presentation Inspiration Images PDF
This slide represents the installation of wind turbines offered by green energy power plant firm such as land-based wind turbines, offshore wind turbines, and distributed wind turbines.Deliver and pitch your topic in the best possible manner with this Sustainable Energy Installation Of Wind Turbines We Offer Ppt PowerPoint Presentation Inspiration Images PDF. Use them to share invaluable insights on Quantities Electricity, Employed Scattered, Generate Utilized and impress your audience. This template can be altered and modified as per your expectations. So, grab it now.
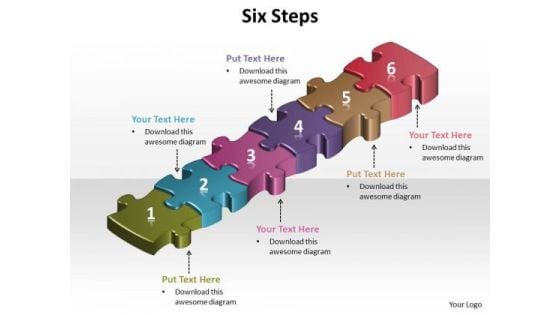
Ppt 6 Jigsaw Autoshape Puzzle PowerPoint Template Free Steps Templates
PPT 6 jigsaw autoshape puzzle powerpoint template free steps Templates-This PowerPoint Diagram consists of colorful Puzzles attached to each other forming a complete process and defining its steps. This PowerPoint Diagram can be used in Investor presentations for Initial Public Offerings, Annual general meetings and financial seminars.-PPT 6 jigsaw autoshape puzzle powerpoint template free steps Templates-1, 2, 3, 4, 5, 6, abstract, alphabet, background, beginning, blue, calculations, childhood, colorful, count, cutout, design, easy, education, eight, elementary, figure, fun, green, indoor, isolated, knowledge, learn, letter, maths, nine, number, object, one, pieces, play, preschool, puzzle, scattered, step, still, studio, symbol, text, three, two, type, typeset, white, yellow Our content is terrific for meeting deadlines. Speed it up with our Ppt 6 Jigsaw Autoshape Puzzle PowerPoint Template Free Steps Templates. You'll always stay ahead of the game.
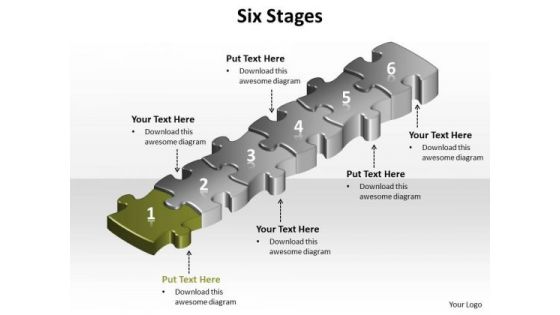
Ppt Green Puzzle Modifying Slide Layouts PowerPoint Free Download Step Templates
PPT green puzzle modifying slide layouts powerpoint free download step Templates-This PowerPoint Diagram shows the Complete Process Represented by Green Puzzle. It signifies the Whole Process that is involved in Business. This PowerPoint diagram will fit for Business Presentations.-PPT green puzzle modifying slide layouts powerpoint free download step Templates-1, 2, 3, 4, 5, 6, abstract, alphabet, background, beginning, blue, calculations, childhood, colorful, count, cutout, design, easy, education, eight, elementary, figure, fun, green, indoor, isolated, knowledge, learn, letter, maths, nine, number, object, one, pieces, play, preschool, puzzle, scattered, step, still, studio, symbol, text, three, two, type, typeset, white, yellow Exhilirate your audience with our Ppt Green Puzzle Modifying Slide Layouts PowerPoint Free Download Step Templates. Entertain them in your characteristic way.
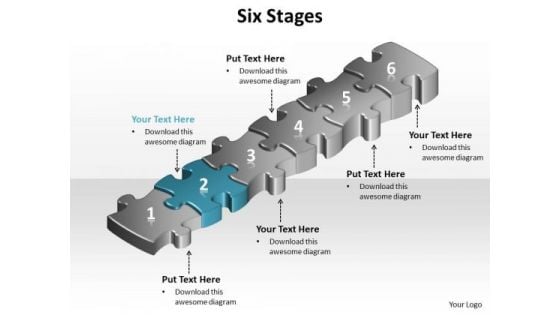
Ppt Orange And Blue PowerPoint Template Puzzle Step Templates
PPT orange and blue powerpoint template puzzle step Templates-It is all there in bits and pieces. You can assemble and animate shapes. This way, you can use the idea of a jigsaw quickly and easily in your presentation. Use this Diagram to illustrate your method, piece by piece, and interlock the whole process in the minds of your audience.-PPT orange and blue powerpoint template puzzle step Templates-1, 2, 3, 4, 5, 6, abstract, alphabet, background, beginning, blue, calculations, childhood, colorful, count, cutout, design, easy, education, eight, elementary, figure, fun, green, indoor, isolated, knowledge, learn, letter, maths, nine, number, object, one, pieces, play, preschool, puzzle, scattered, step, still, studio, symbol, text, three, two, type, typeset, white, yellow Drop with our Ppt Orange And Blue PowerPoint Template Puzzle Step Templates. You will come out on top.
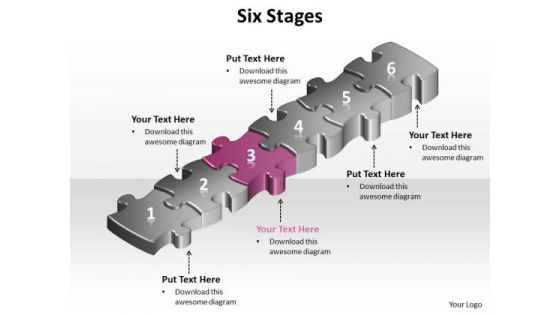
Ppt Pink Puzzle Step PowerPoint Presentation Tips Diagrams Templates
PPT pink puzzle step powerpoint presentation tips diagrams Templates-It is all there in bits and pieces. You can assemble and animate shapes. This way, you can use the idea of a jigsaw quickly and easily in your presentation. Use this Diagram to illustrate your method, piece by piece, and interlock the whole process in the minds of your audience. This is Represented by Pink Step.-PPT pink puzzle step powerpoint presentation tips diagrams Templates-1, 2, 3, 4, 5, 6, abstract, alphabet, background, beginning, blue, calculations, childhood, colorful, count, cutout, design, easy, education, eight, elementary, figure, fun, green, indoor, isolated, knowledge, learn, letter, maths, nine, number, object, one, pieces, play, preschool, puzzle, scattered, step, still, studio, symbol, text, three, two, type, typeset, white, yellow Our Ppt Pink Puzzle Step PowerPoint Presentation Tips Diagrams Templates ensure a fair exchange. They give you many a penny for your thoughts.

Ppt Continuous Illustration Of Business Planning Using 6 Stages PowerPoint Templates
PPT continuous illustration of business planning using 6 stages PowerPoint Templates-This diagram offers a great visualization tool it is a type of diagram that represents an algorithm or process, showing the steps as showing the steps as circles, and their order by connecting these with connectors. Process operations are represented in these circles, and connectors represent flow of control.-PPT continuous illustration of business planning using 6 stages PowerPoint Templates-Abstract, Art, Stic, Background, Beautiful, Circles, Concept, Create, Decorative, Design, Detail, Digital, Faded, Fun, Gradient, Graphic, Illustration, Ink, Multicolored, Nostalgia, Outline, Pattern, Scattered, Shape, Spot, Spring, Stylistic Reach the skies with our Ppt Continuous Illustration Of Business Planning Using 6 Stages PowerPoint Templates. You will come out on top.
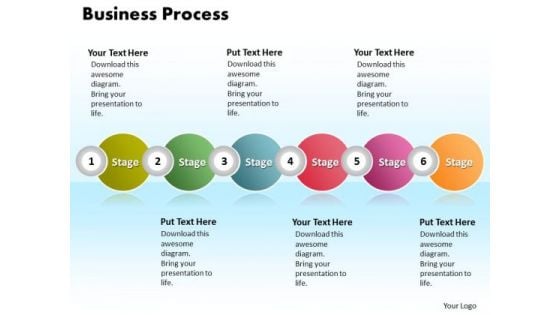
Ppt Continuous Illustration Of Business Process Using 6 Power Point Stage PowerPoint Templates
PPT continuous illustration of business process using 6 power point stage PowerPoint Templates-This diagram offers a great visualization tool, It is a type of diagram that represents an algorithm or process, showing the steps as showing the steps as circles, and their order by connecting these with connectors. Process operations are represented in these circles, and connectors represent flow of control.-PPT continuous illustration of business process using 6 power point stage PowerPoint Templates-Abstract, Art, Stic, Background, Beautiful, Circles, Concept, Create, Decorative, Design, Detail, Digital, Faded, Fun, Gradient, Graphic, Illustration, Ink, Multicolored, Nostalgia, Outline, Pattern, Scattered, Shape, Spot, Spring, Stylistic Our Ppt Continuous Illustration Of Business Process Using 6 Power Point Stage PowerPoint Templates need no exaggeration. They are an advertisement for themselves.
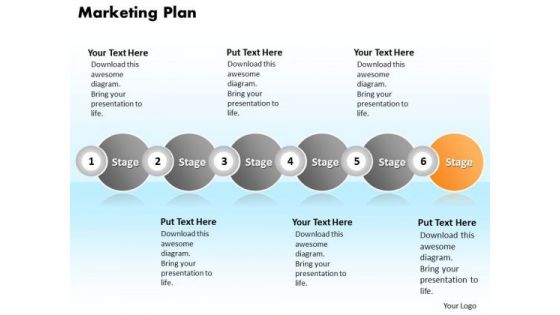
Ppt Continuous Illustration Of Marketing Plan Using 6 Stages PowerPoint Templates
PPT continuous illustration of marketing plan using 6 stages PowerPoint Templates-This diagram offers a great visualization tool, It is a type of diagram that represents an algorithm or process, showing the steps as showing the steps as circles, and their order by connecting these with connectors. Process operations are represented in these circles, and connectors represent flow of control.-PPT continuous illustration of marketing plan using 6 stages PowerPoint Templates-Abstract, Art, Stic, Background, Beautiful, Circles, Concept, Create, Decorative, Design, Detail, Digital, Faded, Fun, Gradient, Graphic, Illustration, Ink, Multicolored, Nostalgia, Outline, Pattern, Scattered, Shape, Spot, Spring, Stylistic Supervise your team with our Ppt Continuous Illustration Of Marketing Plan Using 6 Stages PowerPoint Templates. Download without worries with our money back guaranteee.
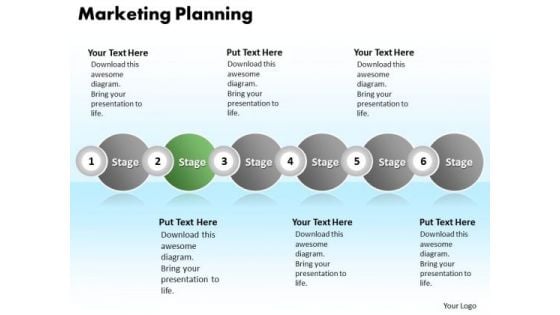
Ppt Continuous Illustration Of Marketing Planning Using 6 Power Point Stage PowerPoint Templates
PPT continuous illustration of marketing planning using 6 power point stage PowerPoint Templates-This diagram offers a great visualization tool, It is a type of diagram that represents an algorithm or process, showing the steps as showing the steps as circles, and their order by connecting these with connectors. Process operations are represented in these circles, and connectors represent flow of control.-PPT continuous illustration of marketing planning using 6 power point stage PowerPoint Templates-Abstract, Art, Stic, Background, Beautiful, Circles, Concept, Create, Decorative, Design, Detail, Digital, Faded, Fun, Gradient, Graphic, Illustration, Ink, Multicolored, Nostalgia, Outline, Pattern, Scattered, Shape, Spot, Spring, Stylistic Display executive ability with our Ppt Continuous Illustration Of Marketing Planning Using 6 Power Point Stage PowerPoint Templates. Demonstrate corporate acumen with your ideas.


 Continue with Email

 Home
Home


