Scope Icons
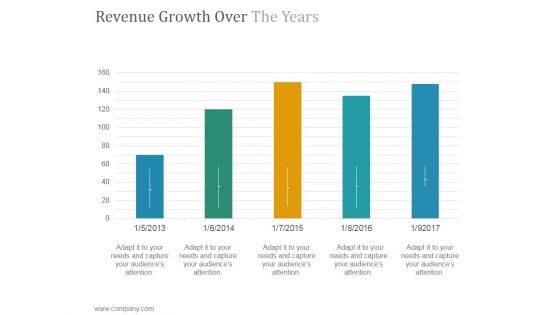
Revenue Growth Over The Years Ppt PowerPoint Presentation Example 2015
This is a revenue growth over the years ppt powerpoint presentation example 2015. This is a five stage process. The stages in this process are success, product, growth, graph, business.
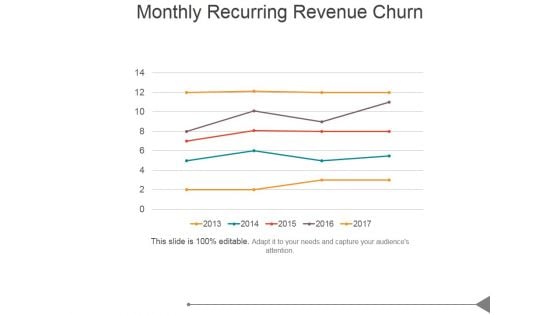
Monthly Recurring Revenue Churn Template 1 Ppt PowerPoint Presentation Clipart
This is a monthly recurring revenue churn template 1 ppt powerpoint presentation clipart. This is a one stage process. The stages in this process are business, marketing, success, in percentage, growth.
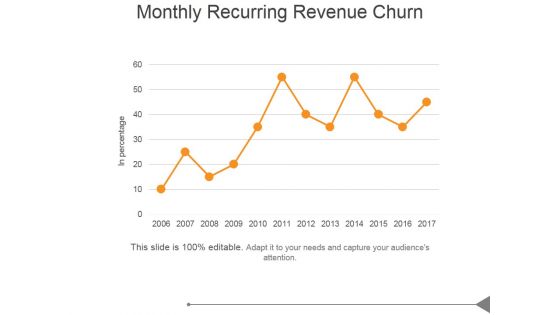
Monthly Recurring Revenue Churn Ppt PowerPoint Presentation Images
This is a monthly recurring revenue churn ppt powerpoint presentation images. This is a five stage process. The stages in this process are business, marketing, success, bar graph, growth.
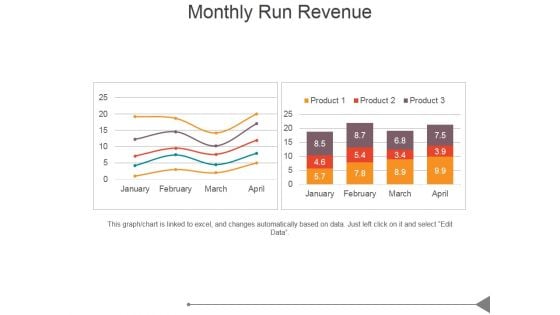
Monthly Run Revenue Ppt PowerPoint Presentation Design Ideas
This is a monthly run revenue ppt powerpoint presentation design ideas. This is a two stage process. The stages in this process are business, marketing, success, bar graph, growth.
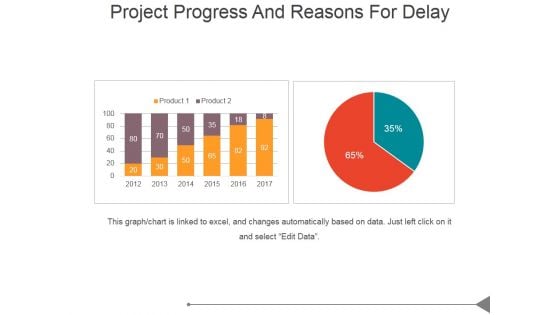
Project Progress And Reasons For Delay Ppt PowerPoint Presentation Designs Download
This is a project progress and reasons for delay ppt powerpoint presentation designs download. This is a two stage process. The stages in this process are business, marketing, success, bar graph, management.
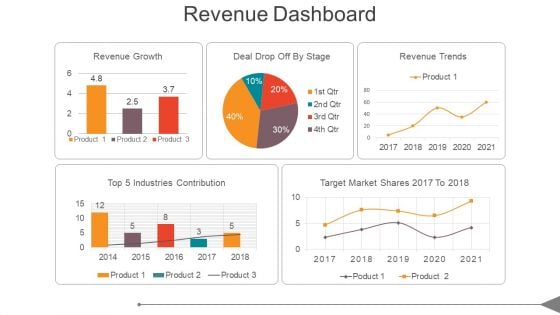
Revenue Dashboard Ppt PowerPoint Presentation Show
This is a revenue dashboard ppt powerpoint presentation show. This is a five stage process. The stages in this process are top 5 industries contribution, revenue growth, deal drop off by stage, revenue trends, target market shares 2017 to 2018.
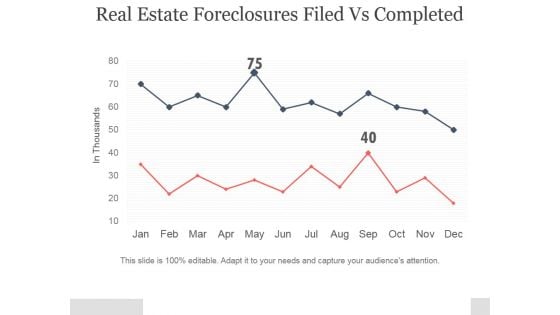
Real Estate Foreclosures Filed Vs Completed Ppt PowerPoint Presentation Gallery
This is a real estate foreclosures filed vs completed ppt powerpoint presentation gallery. This is a two stage process. The stages in this process are in thousands, business, marketing, success, management.
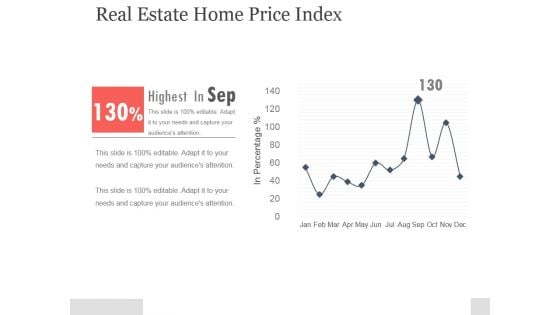
Real Estate Home Price Index Ppt PowerPoint Presentation Example
This is a real estate home price index ppt powerpoint presentation example. This is a one stage process. The stages in this process are bar graph, business, marketing, success, management.
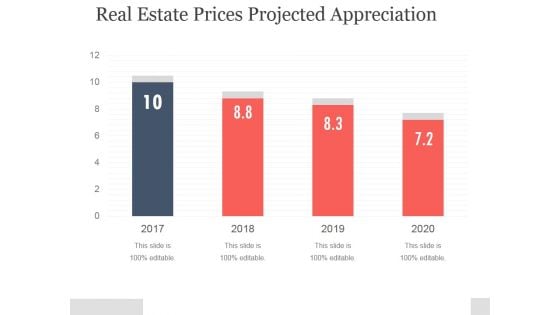
Real Estate Prices Projected Appreciation Ppt PowerPoint Presentation Layouts
This is a real estate prices projected appreciation ppt powerpoint presentation layouts. This is a four stage process. The stages in this process are business, marketing, success, management, presentation.
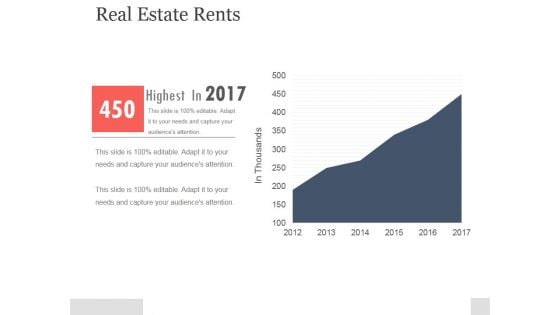
Real Estate Rents Ppt PowerPoint Presentation Ideas
This is a real estate rents ppt powerpoint presentation ideas. This is a one stage process. The stages in this process are business, marketing, success, management, growth.
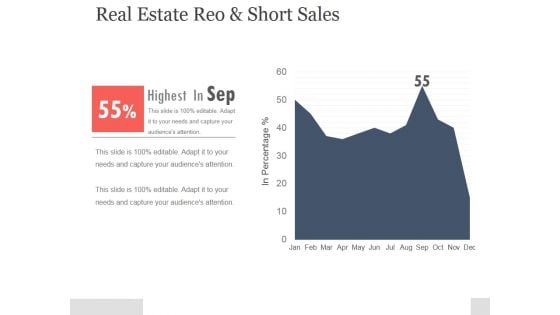
Real Estate Reo And Short Sales Ppt PowerPoint Presentation Rules
This is a real estate reo and short sales ppt powerpoint presentation rules. This is a one stage process. The stages in this process are business, marketing, success, management, growth.
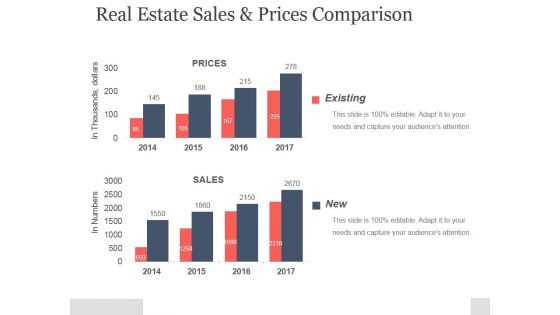
Real Estate Sales And Prices Comparison Ppt PowerPoint Presentation Example
This is a real estate sales and prices comparison ppt powerpoint presentation example. This is a two stage process. The stages in this process are existing, prices, sales, in thousands, dollars.
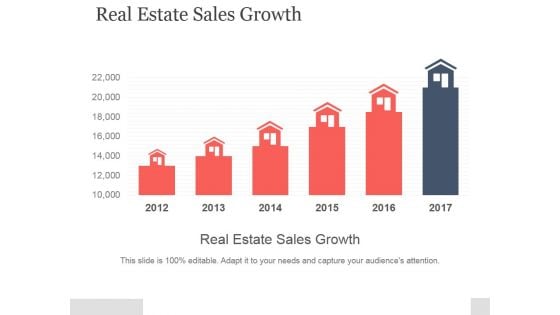
Real Estate Sales Growth Ppt PowerPoint Presentation Good
This is a real estate sales growth ppt powerpoint presentation good. This is a six stage process. The stages in this process are real estate sales growth.
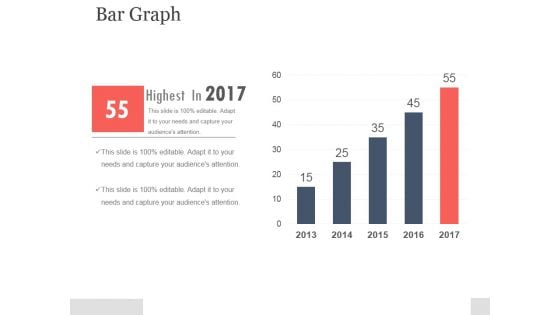
Bar Graph Template 1 Ppt PowerPoint Presentation Deck
This is a bar graph template 1 ppt powerpoint presentation deck. This is a five stage process. The stages in this process are bar graph, business, marketing, success, management.
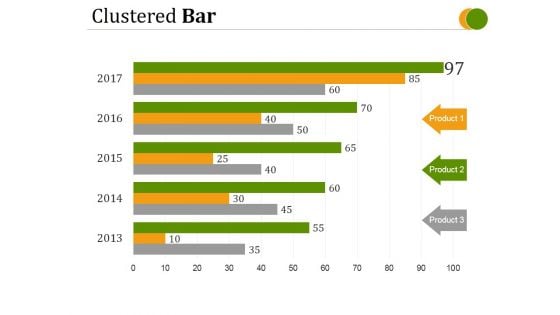
Clustered Bar Ppt PowerPoint Presentation Good
This is a clustered bar ppt powerpoint presentation good. This is a five stage process. The stages in this process are product, circular, business, marketing, bar graph.
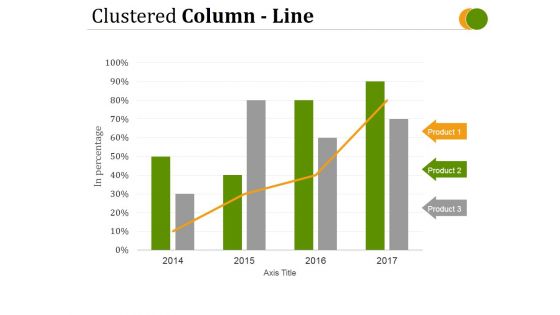
Clustered Column Line Ppt PowerPoint Presentation Backgrounds
This is a clustered column line ppt powerpoint presentation backgrounds. This is a four stage process. The stages in this process are fire, earthquake, axis title, in percentage.
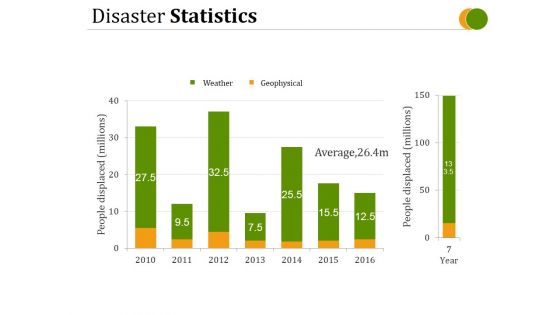
Disaster Statistics Ppt PowerPoint Presentation Graphics
This is a disaster statistics ppt powerpoint presentation graphics. This is a seven stage process. The stages in this process are people displaced, weather, geophysical.
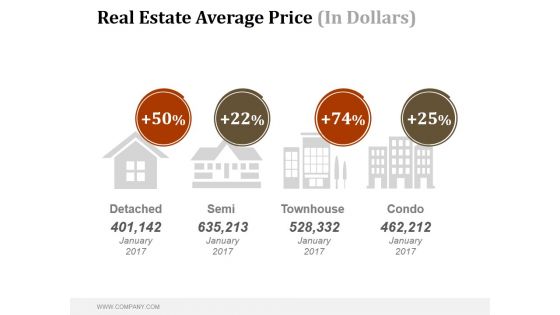
Real Estate Average Price In Dollars Ppt PowerPoint Presentation Inspiration
This is a real estate average price in dollars ppt powerpoint presentation inspiration. This is a four stage process. The stages in this process are detached, semi, townhouse, condo.
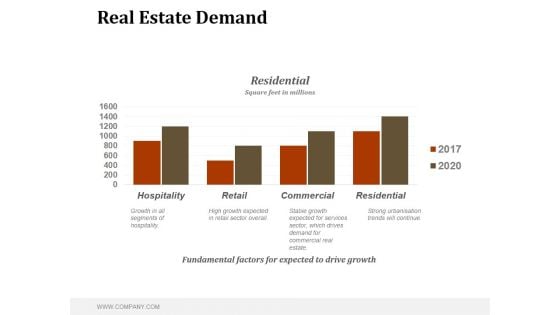
Real Estate Demand Ppt PowerPoint Presentation Graphics
This is a real estate demand ppt powerpoint presentation graphics. This is a four stage process. The stages in this process are fundamental factors for expected to drive growth, residential, square feet in millions.
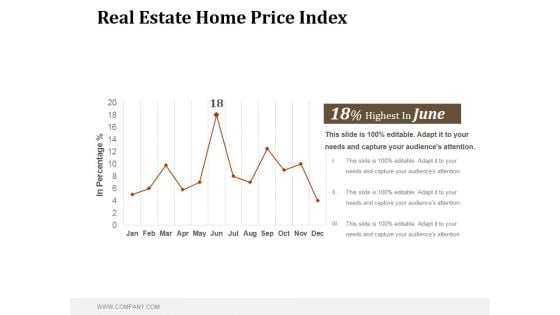
Real Estate Home Price Index Ppt PowerPoint Presentation Samples
This is a real estate home price index ppt powerpoint presentation samples. This is a one stage process. The stages in this process are in percentage, business, bar graph, marketing, success, management.
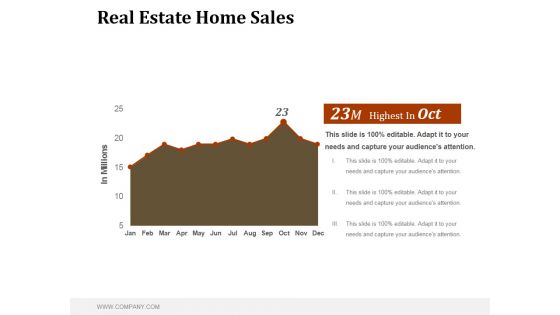
Real Estate Home Sales Ppt PowerPoint Presentation Model
This is a real estate home sales ppt powerpoint presentation model. This is a one stage process. The stages in this process are in millions, business, marketing, success, management.
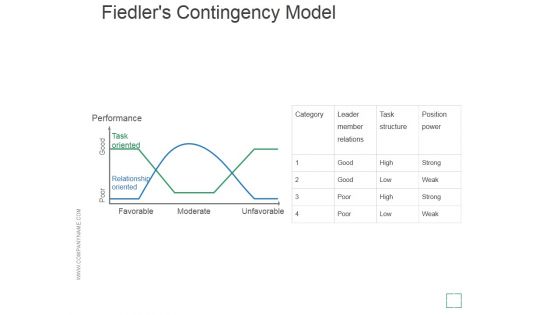
Fiedlers Contingency Model Ppt PowerPoint Presentation Templates
This is a fiedlers contingency model ppt powerpoint presentation templates. This is a one stage process. The stages in this process are performance, poor, good, favorable, moderate.
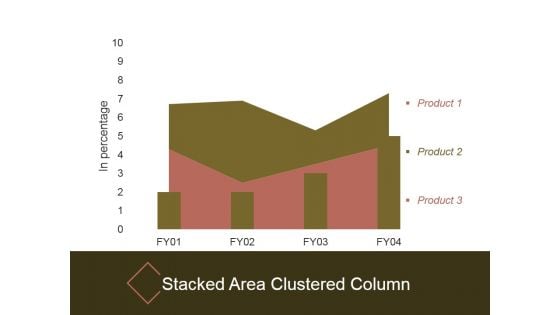
Stacked Area Clustered Column Ppt PowerPoint Presentation Clipart
This is a stacked area clustered column ppt powerpoint presentation clipart. This is a four stage process. The stages in this process are in percentage, stacked area clustered column, product.
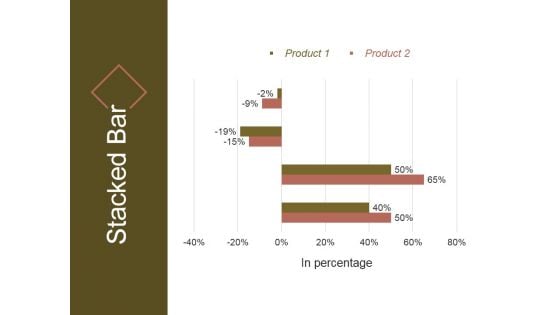
Stacked Bar Template 2 Ppt PowerPoint Presentation Pictures
This is a stacked bar template 2 ppt powerpoint presentation pictures. This is a four stage process. The stages in this process are in percentage, product, stacked bar.
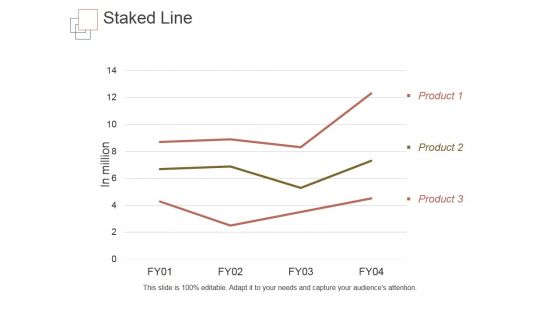
Staked Line Ppt PowerPoint Presentation Example
This is a staked line ppt powerpoint presentation example. This is a three stage process. The stages in this process are in million, product.
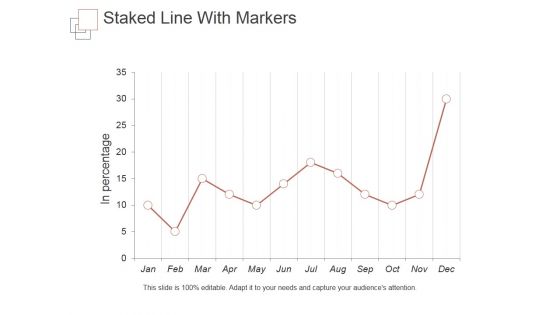
Staked Line With Markers Ppt PowerPoint Presentation Introduction
This is a staked line with markers ppt powerpoint presentation introduction. This is a one stage process. The stages in this process are in percentage, business, marketing, success, management.

Employee Who Leave Within First 6 Months Ppt PowerPoint Presentation Outline
This is a employee who leave within first 6 months ppt powerpoint presentation outline. This is a two stage process. The stages in this process are barely on board, top 3 reason they left, felt their boss was a jerk, work was different than they expected, changed their mind on work type.
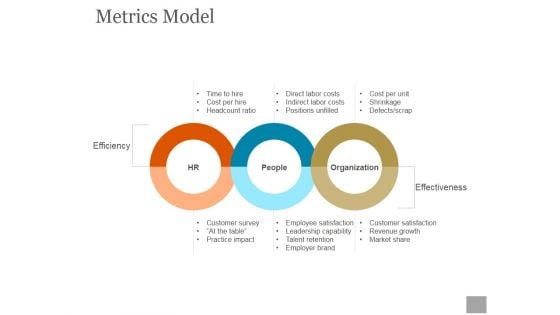
Metrics Model Ppt PowerPoint Presentation Guidelines
This is a metrics model ppt powerpoint presentation guidelines. This is a three stage process. The stages in this process are hr, people, organization, efficiency, effectiveness.
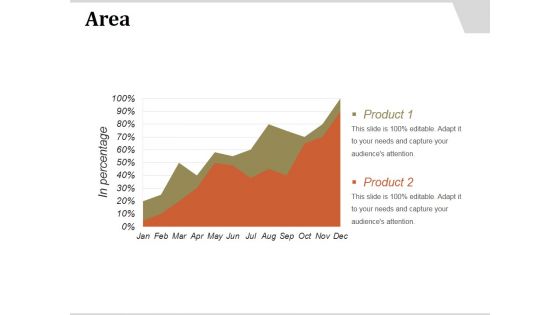
Area Ppt PowerPoint Presentation Show
This is a area ppt powerpoint presentation show. This is a two stage process. The stages in this process are area, bar graph, growth, years, business.
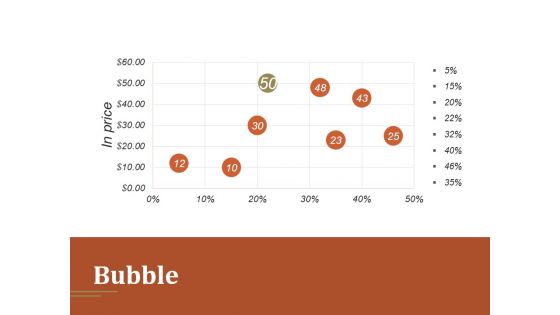
Bubble Ppt PowerPoint Presentation Guidelines
This is a bubble ppt powerpoint presentation guidelines. This is a five stage process. The stages in this process are bubble, business, bar graph, marketing, presentation.
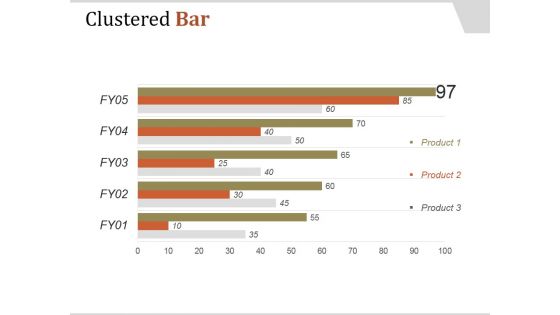
Clustered Bar Ppt PowerPoint Presentation Template
This is a clustered bar ppt powerpoint presentation template. This is a five stage process. The stages in this process are product, clustered bar, business, marketing, bar graph.
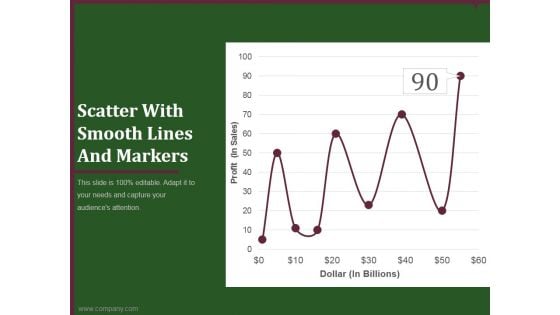
Scatter With Smooth Lines And Markers Ppt PowerPoint Presentation Example
This is a scatter with smooth lines and markers ppt powerpoint presentation example. This is a seven stage process. The stages in this process are business, marketing, success, growth, finance.
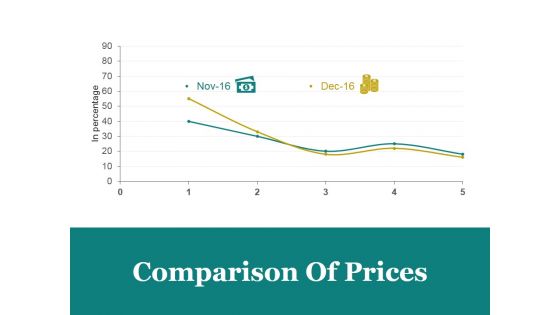
Comparison Of Prices Ppt PowerPoint Presentation Designs Download
This is a comparison of prices ppt powerpoint presentation designs download. This is a two stage process. The stages in this process are comparison of prices, marketing, in percentage, bar graph, business.
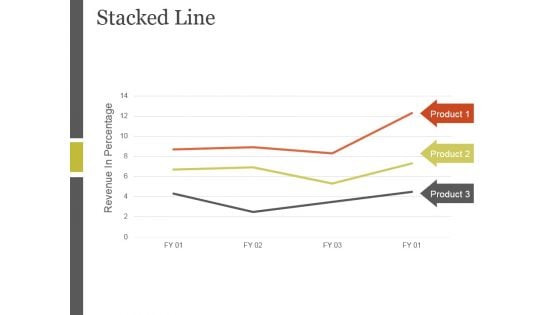
Stacked Line Ppt PowerPoint Presentation Inspiration
This is a stacked line ppt powerpoint presentation inspiration. This is a three stage process. The stages in this process are revenue in percentage, stacked line, product.
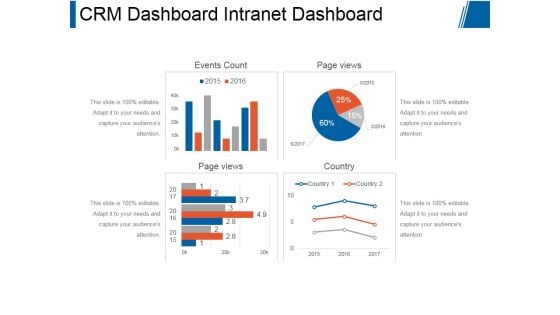
Crm Dashboard Intranet Dashboard Ppt PowerPoint Presentation Model
This is a crm dashboard intranet dashboard ppt powerpoint presentation model. This is a four stage process. The stages in this process are events count, page views, page views, country.
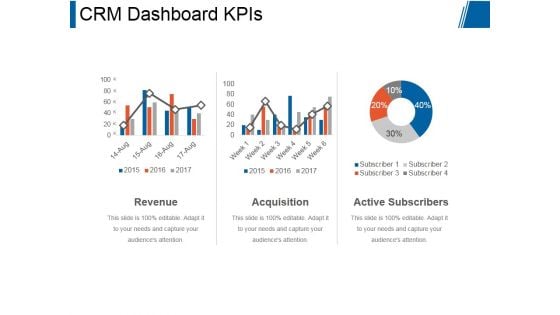
Crm Dashboard Kpis Ppt PowerPoint Presentation Rules
This is a crm dashboard kpis ppt powerpoint presentation rules. This is a three stage process. The stages in this process are revenue, acquisition, active subscribers.
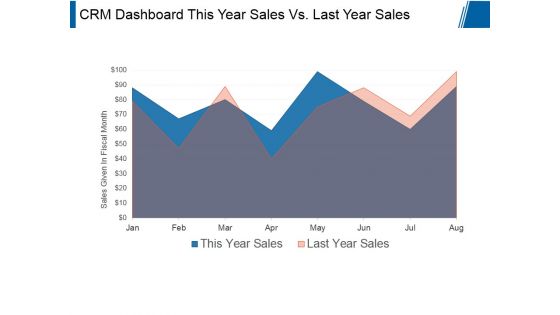
Crm Dashboard This Year Sales Vs Last Year Sales Ppt PowerPoint Presentation Styles
This is a crm dashboard this year sales vs last year sales ppt powerpoint presentation styles. This is a two stage process. The stages in this process are sales given in fiscal month, business, marketing, presentation, growth.
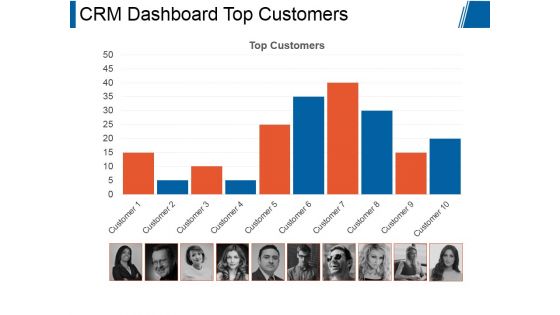
Crm Dashboard Top Customers Ppt PowerPoint Presentation Graphics
This is a crm dashboard top customers ppt powerpoint presentation graphics. This is a ten stage process. The stages in this process are top customers, business, marketing, process, management.
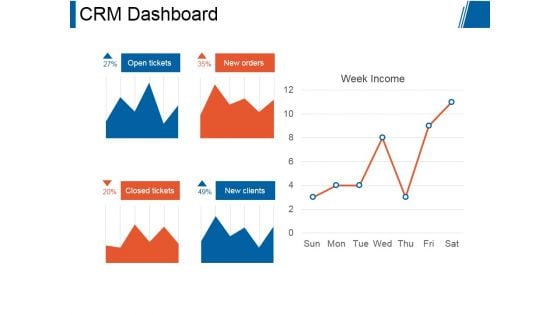
Crm Dashboard Ppt PowerPoint Presentation Good
This is a crm dashboard ppt powerpoint presentation good. This is a five stage process. The stages in this process are open tickets, new orders, closed tickets, new clients, week income.
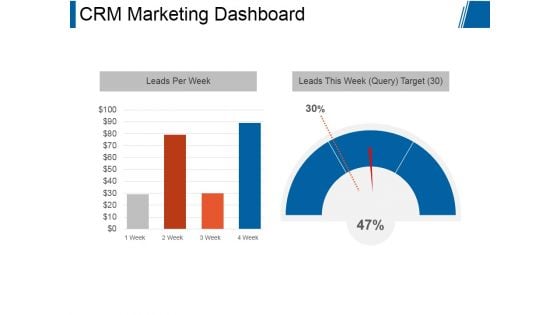
Crm Marketing Dashboard Ppt PowerPoint Presentation Designs
This is a crm marketing dashboard ppt powerpoint presentation designs. This is a two stage process. The stages in this process are leads per week, leads this week target.
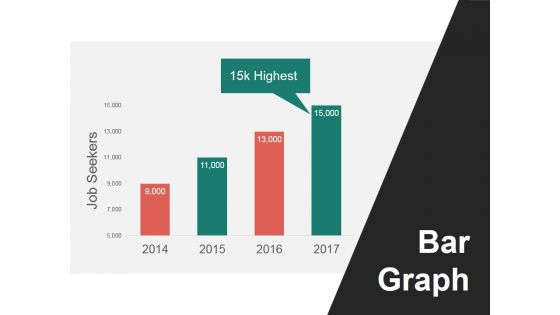
Bar Graph Ppt PowerPoint Presentation Model Slide Download
This is a bar graph ppt powerpoint presentation model slide download. This is a four stage process. The stages in this process are job seekers, bar graph, highest.
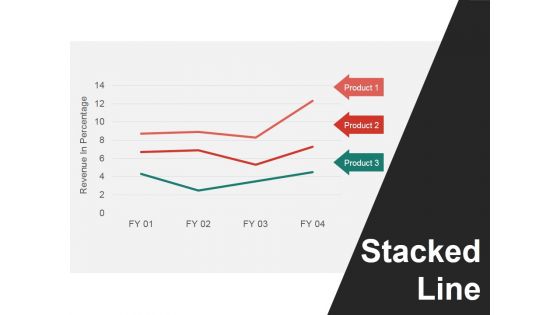
Stacked Line Ppt PowerPoint Presentation Summary Master Slide
This is a stacked line ppt powerpoint presentation summary master slide. This is a three stage process. The stages in this process are revenue in percentage, stacked line, product.
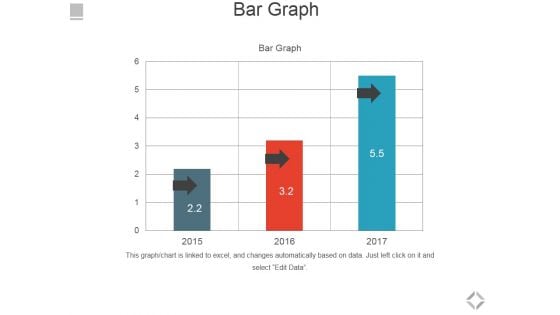
Bar Graph Ppt PowerPoint Presentation Summary Skills
This is a bar graph ppt powerpoint presentation summary skills. This is a three stage process. The stages in this process are bar graph, business, marketing, success, growth.
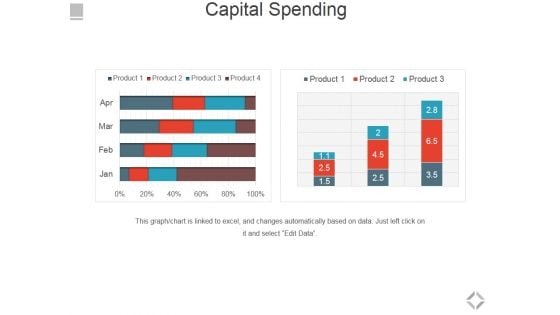
Capital Spending Ppt PowerPoint Presentation Infographics Show
This is a capital spending ppt powerpoint presentation infographics show. This is a two stage process. The stages in this process are capital spending, financials, business, marketing, growth.
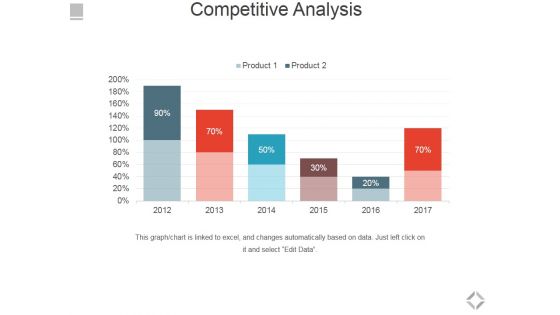
Competitive Analysis Ppt PowerPoint Presentation Slides Design Templates
This is a competitive analysis ppt powerpoint presentation slides design templates. This is a six stage process. The stages in this process are business, marketing, management, success, presentation.
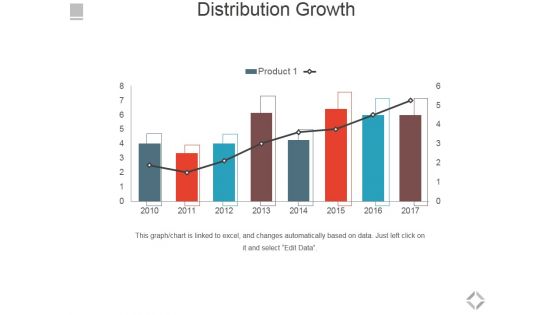
Distribution Growth Ppt PowerPoint Presentation Slides Clipart
This is a distribution growth ppt powerpoint presentation slides clipart. This is a eight stage process. The stages in this process are distribution growth, bar graph, business, marketing, success.
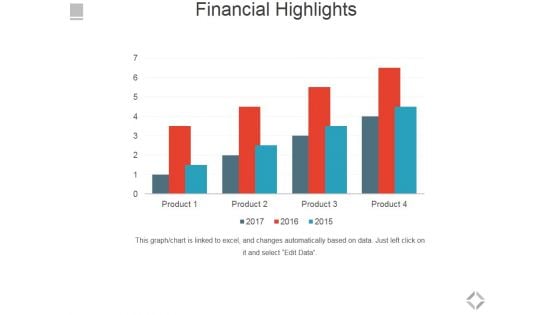
Financial Highlights Template 2 Ppt PowerPoint Presentation Outline Background Image
This is a financial highlights template 2 ppt powerpoint presentation outline background image. This is a four stage process. The stages in this process are financial highlights, business, marketing, success, management.
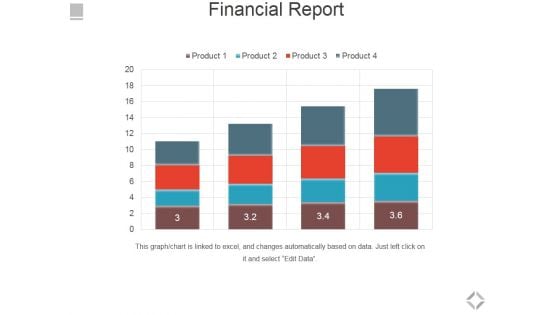
Financial Report Ppt PowerPoint Presentation Styles Skills
This is a financial report ppt powerpoint presentation styles skills. This is a four stage process. The stages in this process are bar graph, business, marketing, success, growth.
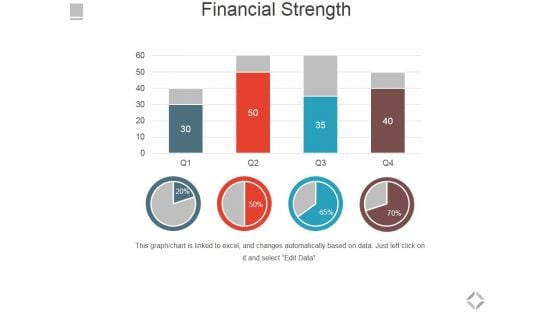
Financial Strength Ppt PowerPoint Presentation Summary Ideas
This is a financial strength ppt powerpoint presentation summary ideas. This is a four stage process. The stages in this process are bar graph, business, marketing, success, growth.
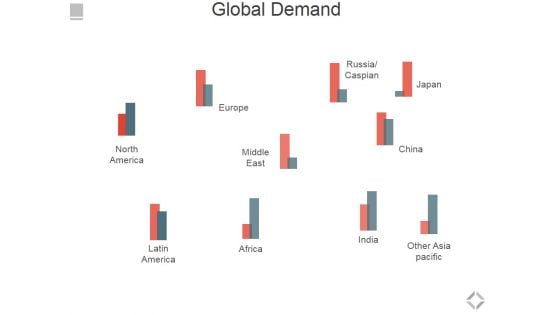
Global Demand Ppt PowerPoint Presentation Model Example Topics
This is a global demand ppt powerpoint presentation model example topics. This is a ten stage process. The stages in this process are europe, africa, latin america, north america, india.
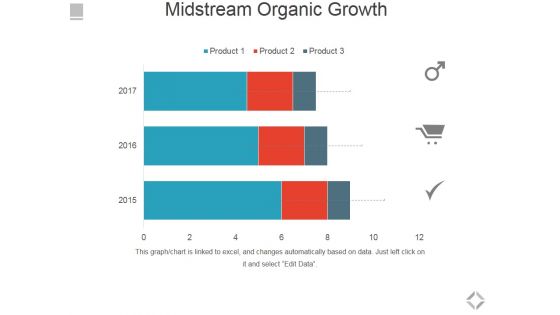
Midstream Organic Growth Ppt PowerPoint Presentation Ideas Graphics Tutorials
This is a midstream organic growth ppt powerpoint presentation ideas graphics tutorials. This is a three stage process. The stages in this process are business, marketing, bar graph, management, financials.
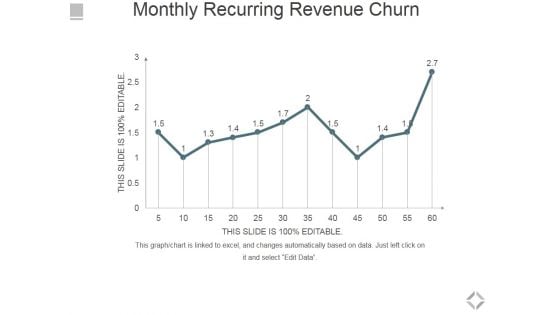
Monthly Recurring Revenue Churn Ppt PowerPoint Presentation Infographics Microsoft
This is a monthly recurring revenue churn ppt powerpoint presentation infographics microsoft. This is a one stage process. The stages in this process are bar graph, business, marketing, success, growth.
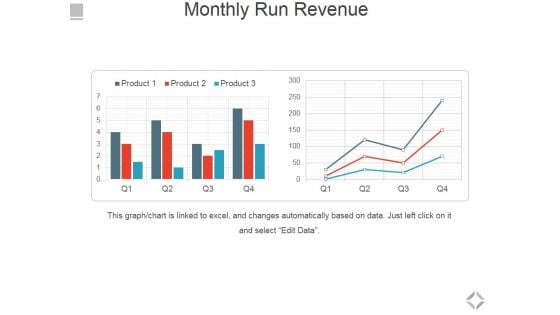
Monthly Run Revenue Ppt PowerPoint Presentation Show Styles
This is a monthly run revenue ppt powerpoint presentation show styles. This is a two stage process. The stages in this process are bar graph, business, marketing, success, growth.
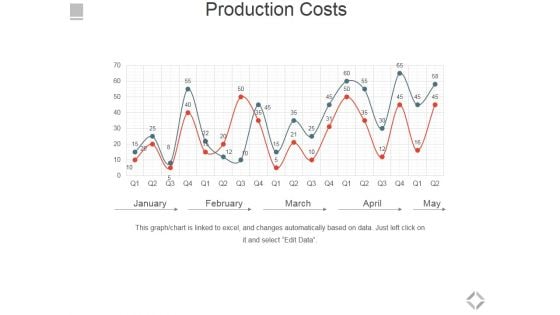
Production Costs Template 2 Ppt PowerPoint Presentation Gallery Picture
This is a production costs template 2 ppt powerpoint presentation gallery picture. This is a two stage process. The stages in this process are january, february, march, april, may.
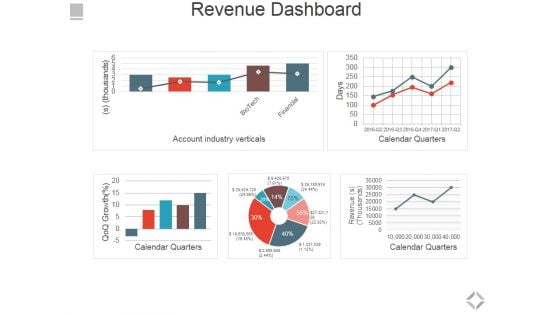
Revenue Dashboard Ppt PowerPoint Presentation Summary Brochure
This is a revenue dashboard ppt powerpoint presentation summary brochure. This is a five stage process. The stages in this process are account industry verticals, calendar quarters.
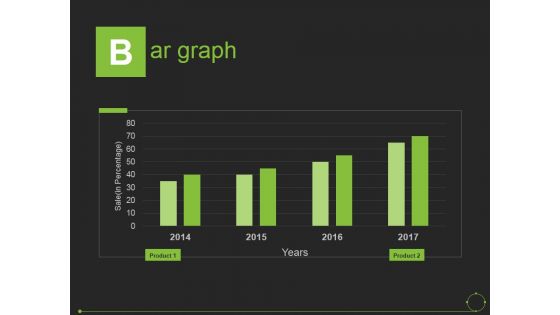
Bar Graph Ppt PowerPoint Presentation Portfolio Background
This is a bar graph ppt powerpoint presentation portfolio background. This is a four stage process. The stages in this process are sale, years, product.
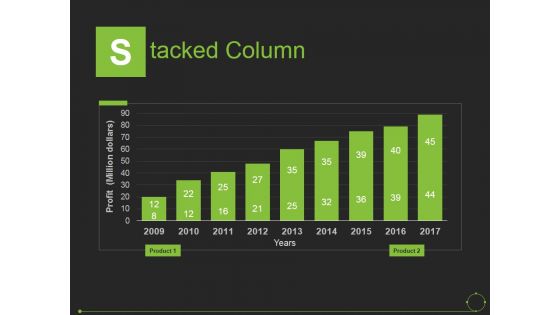
Stacked Column Ppt PowerPoint Presentation Slides Introduction
This is a stacked column ppt powerpoint presentation slides introduction. This is a nine stage process. The stages in this process are years, profit, product, business, marketing.
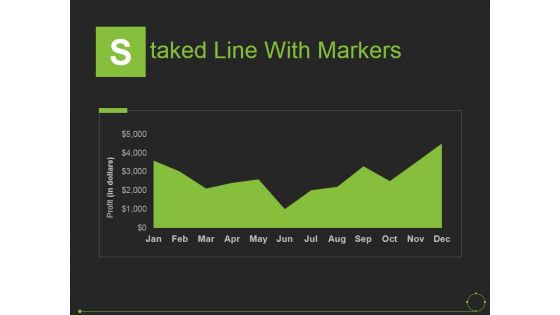
Staked Line With Markers Ppt PowerPoint Presentation Pictures Examples
This is a staked line with markers ppt powerpoint presentation pictures examples. This is a one stage process. The stages in this process are years, profit, product, business, marketing.
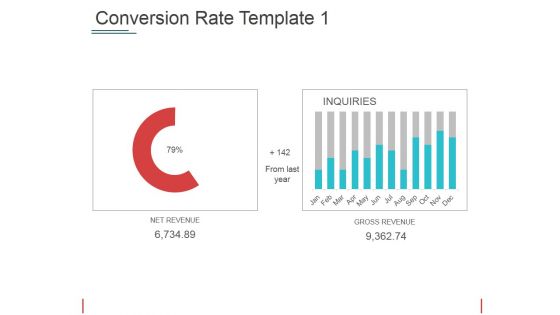
Conversion Rate Template 1 Ppt PowerPoint Presentation Visual Aids Files
This is a conversion rate template 1 ppt powerpoint presentation visual aids files. This is a two stage process. The stages in this process are net revenue gross revenue from last year.
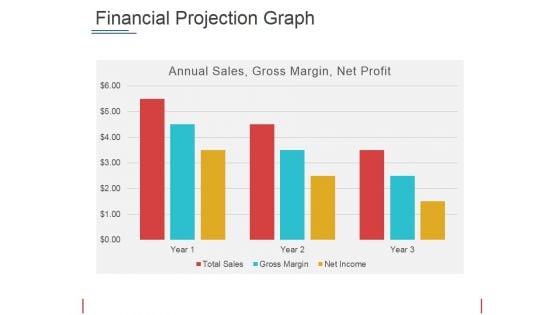
Financial Projection Graph Template 2 Ppt PowerPoint Presentation Show Picture
This is a financial projection graph template 2 ppt powerpoint presentation show picture. This is a three stage process. The stages in this process are annual sales, gross margin, net profit, years.

 Home
Home