Scoring Chart
Column Chart Ppt PowerPoint Presentation Infographic Template Icon
This is a column chart ppt powerpoint presentation infographic template icon. This is a two stage process. The stages in this process are business, marketing, sales in percentage, financial year, graph.
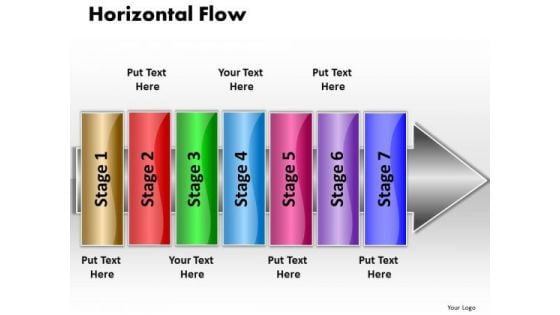
Ppt Linear Work Flow Chart PowerPoint 7 Stages5 Templates
PPT linear work flow chart powerpoint 7 stages5 Templates-You can easily collaborate this PowerPoint diagram with colleagues to create detailed process diagrams and use them as a key element in streamlining your processes. -PPT linear work flow chart powerpoint 7 stages5 Templates-Abstract, Arrow, Blank, Business, Chart, Concept, Conceptual, Design, Diagram, Executive, Icon, Idea, Illustration, Management, Model, Numbers, Organization, Procedure, Process, Progression, Resource, Sequence, Sequential, Stages, Steps, Strategy Delve on the cold facts in detail. Explain the factual analysis on our Ppt Linear Work Flow Chart PowerPoint 7 Stages5 Templates.
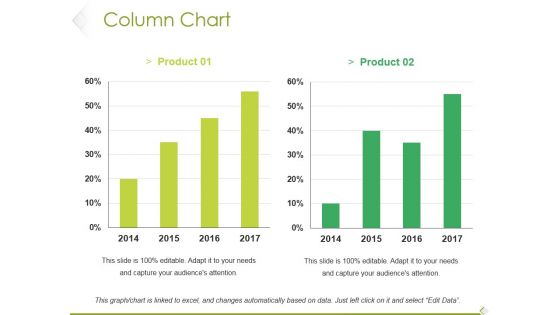
Column Chart Ppt PowerPoint Presentation Model Clipart Images
This is a column chart ppt powerpoint presentation model clipart images. This is a two stage process. The stages in this process are product, bar graph, growth, success, business.
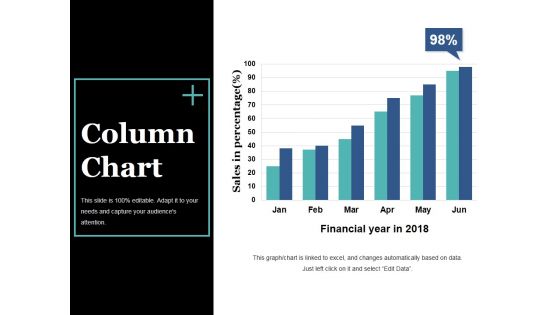
Column Chart Ppt PowerPoint Presentation Slides Visual Aids
This is a column chart ppt powerpoint presentation slides visual aids. This is a six stage process. The stages in this process are bar graph, growth, success, sales in percentage, financial year.
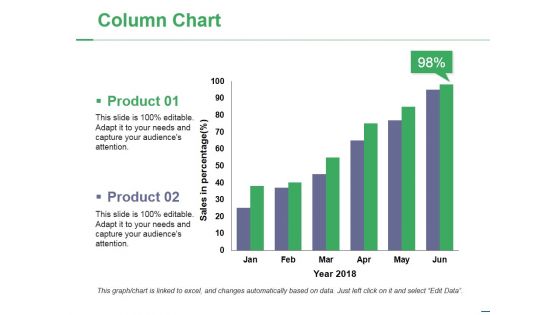
Column Chart Ppt PowerPoint Presentation Portfolio Slide Download
This is a column chart ppt powerpoint presentation portfolio slide download. This is a two stage process. The stages in this process are product, year, bar graph, success, business.
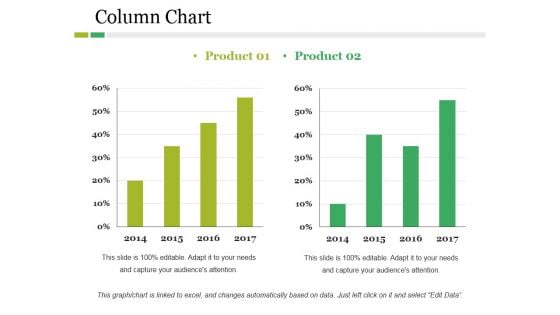
Column Chart Ppt PowerPoint Presentation Layouts Graphics Example
This is a column chart ppt powerpoint presentation layouts graphics example. This is a two stage process. The stages in this process are product, year, bar graph, business, finance.
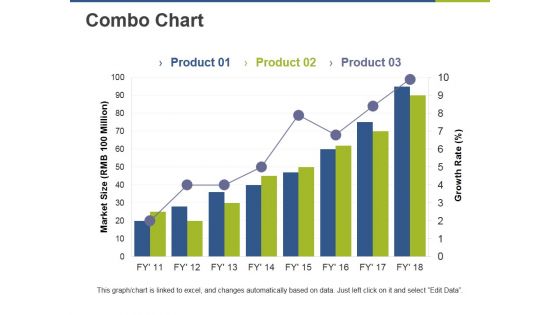
Combo Chart Ppt PowerPoint Presentation Pictures Graphic Images
This is a combo chart ppt powerpoint presentation pictures graphic images. This is a three stage process. The stages in this process are bar graph, growth, market size, growth rate, success.
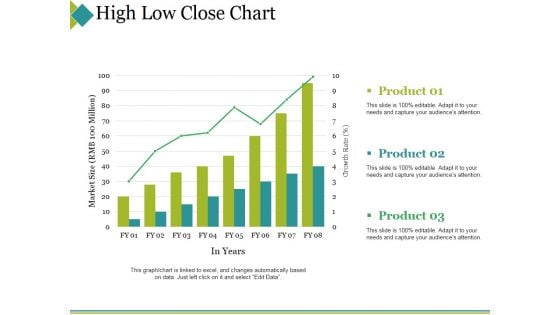
High Low Close Chart Ppt PowerPoint Presentation Portfolio Topics
This is a high low close chart ppt powerpoint presentation portfolio topics. This is a three stage process. The stages in this process are product, market size, in years, success, bar graph.

Column Chart Ppt PowerPoint Presentation Pictures Graphic Images
This is a column chart ppt powerpoint presentation pictures graphic images. This is a two stage process. The stages in this process are product, years, growth, success, bar graph.
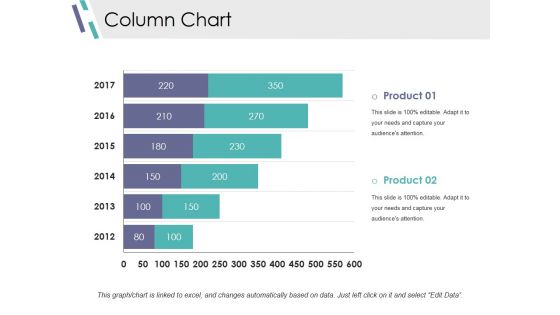
Column Chart Ppt PowerPoint Presentation Infographics Design Inspiration
This is a column chart ppt powerpoint presentation infographics design inspiration. This is a two stage process. The stages in this process are slide bar, marketing, strategy, finance, planning.
Donut Pie Chart Marketing Ppt PowerPoint Presentation Infographic Template Icon
This is a donut pie chart marketing ppt powerpoint presentation infographic template icon. This is a five stage process. The stages in this process are finance, marketing, analysis, business, investment.
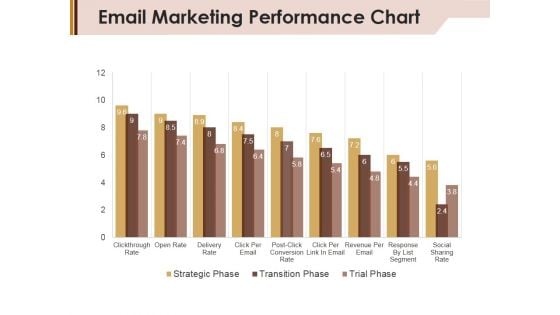
Email Marketing Performance Chart Ppt Powerpoint Presentation Layouts Graphics Pictures
This is a email marketing performance chart ppt powerpoint presentation layouts graphics pictures. This is a nine stage process. The stages in this process are strategic phase, transition phase, trial phase.
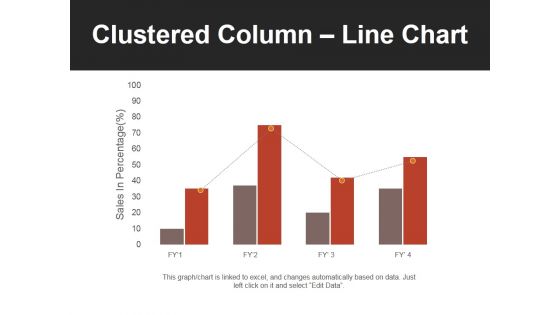
Clustered Column Line Chart Ppt PowerPoint Presentation Professional Slides
This is a clustered column line chart ppt powerpoint presentation professional slides. This is a four stage process. The stages in this process are bar, finance, business, marketing, growth.
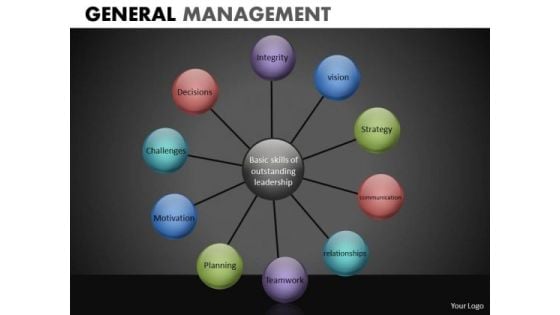
Wheel Chart With 10 Stages PowerPoint Slides Ppt Designs
Wheel Chart with 10 Stages PowerPoint Slides PPT Designs-These high quality powerpoint pre-designed slides and powerpoint templates have been carefully created by our professional team to help you impress your audience. All slides have been created and are 100% editable in powerpoint. Each and every property of any graphic - color, size, orientation, shading, outline etc. can be modified to help you build an effective powerpoint presentation. Any text can be entered at any point in the powerpoint template or slide. Simply DOWNLOAD, TYPE and PRESENT!-These PowerPoint presentation slides can be used to represent concepts relating to--Abstract, action, analysis, blank, business, chart, clipart, commerce, concept, conceptual, design, diagram, direction, flow, generic, goals, guide, guidelines, heirarchy, icon, idea, illustration, lingakes, links, manage, management, mba, model, organization, performance, plan, process, project, relationship, representation, resource, steps, strategy, success, tactics, theoretical, theory, tool, workflow-Wheel Chart with 10 Stages PowerPoint Slides PPT Designs Get a close look at our excellent Wheel Chart With 10 Stages PowerPoint Slides Ppt Designs. Just ask your mouse to 'go fetch 'em'.
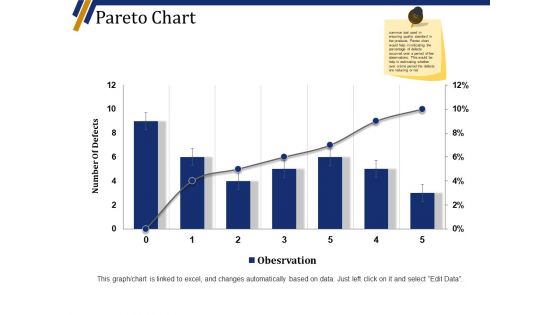
Pareto Chart Ppt PowerPoint Presentation File Infographic Template
This is a pareto chart ppt powerpoint presentation file infographic template. This is a six stage process. The stages in this process are number of defects, business, marketing, graph.
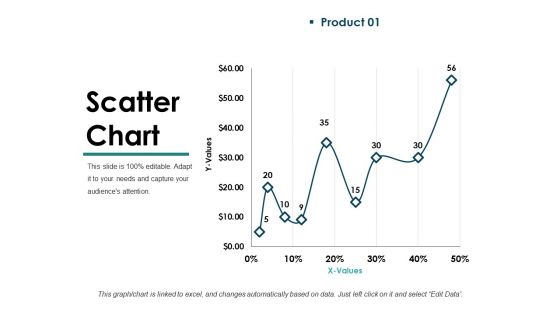
Scatter Chart Template 1 Ppt PowerPoint Presentation Inspiration Guidelines
This is a scatter chart template 1 ppt powerpoint presentation inspiration guidelines. This is a one stage process. The stages in this process are business, marketing, graph, values, growth.
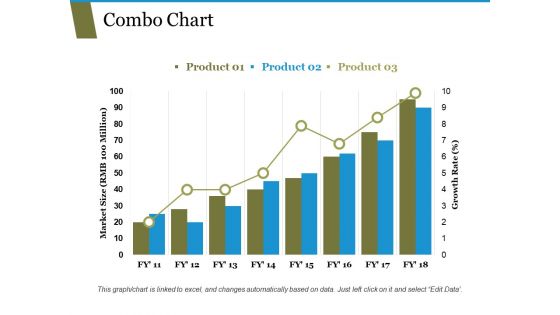
Combo Chart Ppt PowerPoint Presentation Ideas Infographic Template
This is a combo chart ppt powerpoint presentation ideas infographic template. This is a three stage process. The stages in this process are market size growth rate, graph, business, strategy.
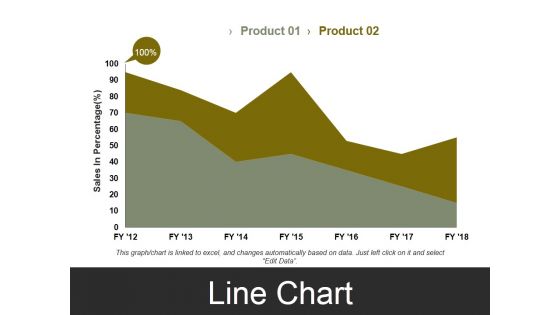
Line Chart Template 3 Ppt PowerPoint Presentation Styles Visual Aids
This is a line chart template 3 ppt powerpoint presentation styles visual aids. This is a two stage process. The stages in this process are sales in percentage, business, marketing, finance, graph.
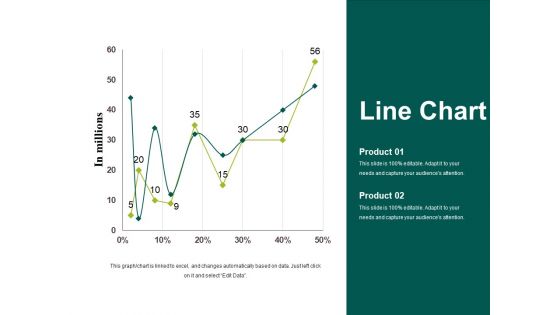
Line Chart Template 1 Ppt PowerPoint Presentation Styles Graphics Tutorials
This is a line chart template 1 ppt powerpoint presentation styles graphics tutorials. This is a two stage process. The stages in this process are in millions, business, marketing, strategy, graph.
Line Chart Template 2 Ppt PowerPoint Presentation Model Background Image
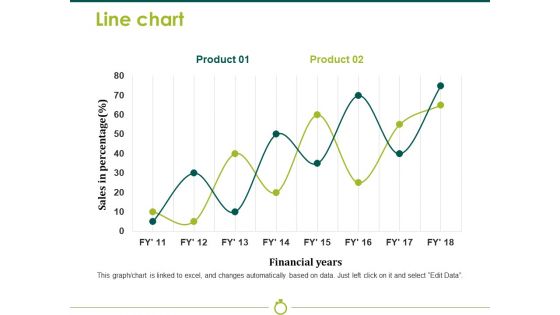
This is a line chart template 2 ppt powerpoint presentation model background image. This is a two stage process. The stages in this process are sales in percentage, financial years, business, marketing, strategy, graph.
Line Chart Ppt PowerPoint Presentation Slides Graphics Template
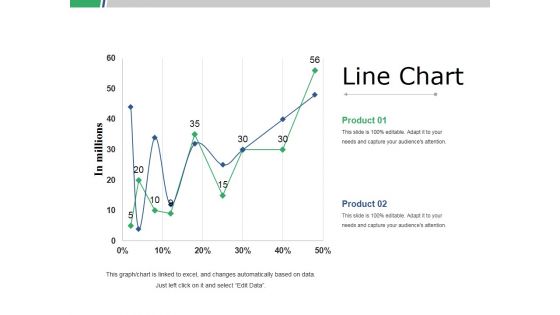
This is a line chart ppt powerpoint presentation slides graphics template. This is a two stage process. The stages in this process are business, marketing, strategy, line graph, finance.
Line Chart Ppt PowerPoint Presentation Infographic Template Slides
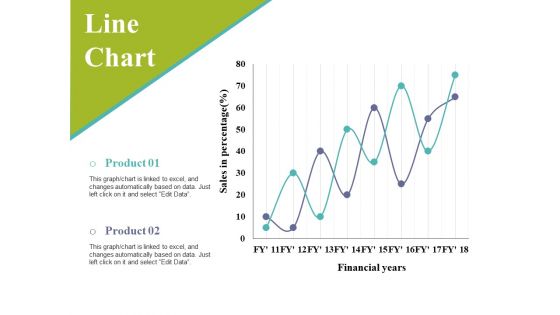
This is a line chart ppt powerpoint presentation infographic template slides. This is a two stage process. The stages in this process are sales in percentage, financial years, business, marketing, graph.
PowerPoint Slide Designs Process Process Chart Ppt Designs
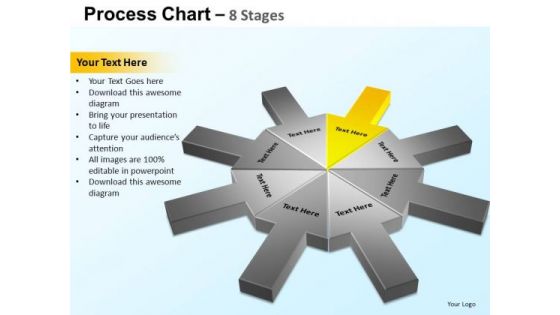
PowerPoint_Slide_Designs_Process_Process_Chart_PPT_DesignsBusiness Power Points-Explore the various directions and layers existing in your in your plans and processes. Unravel the desired and essential elements of your overall strategy. Explain the relevance of the different layers and stages and directions in getting down to your core competence, ability and desired result.- Upgrade your presentation with our PowerPoint Slide Designs Process Process Chart Ppt Designs. Download without worries with our money back guaranteee.
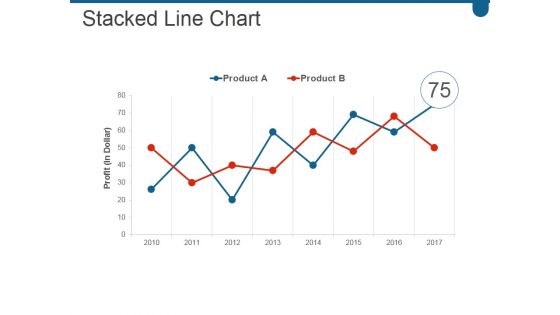
Stacked Line Chart Ppt PowerPoint Presentation Infographic Template Show
This is a stacked line chart ppt powerpoint presentation infographic template show. This is a two stage process. The stages in this process are business, marketing, growth, success, line.
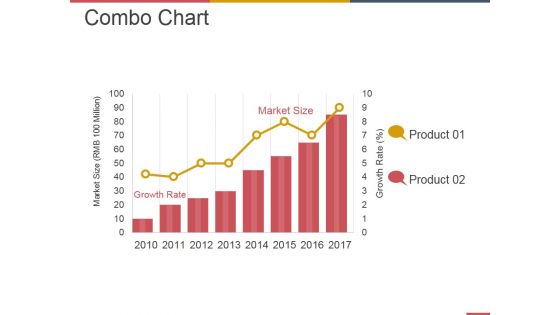
Combo Chart Ppt PowerPoint Presentation Infographic Template Deck
This is a combo chart ppt powerpoint presentation infographic template deck. This is a eight stage process. The stages in this process are business, strategy, marketing, analysis, growth strategy, market size.

Combo Chart Ppt PowerPoint Presentation Infographic Template Influencers
This is a combo chart ppt powerpoint presentation infographic template influencers. This is a three stage process. The stages in this process are market size rmb million, growth rate.
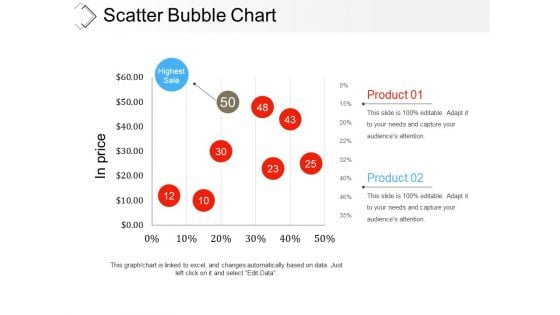
Scatter Bubble Chart Ppt PowerPoint Presentation Infographic Template Examples
This is a scatter bubble chart ppt powerpoint presentation infographic template examples. This is a two stage process. The stages in this process are highest sale, product, in price, finance, business.
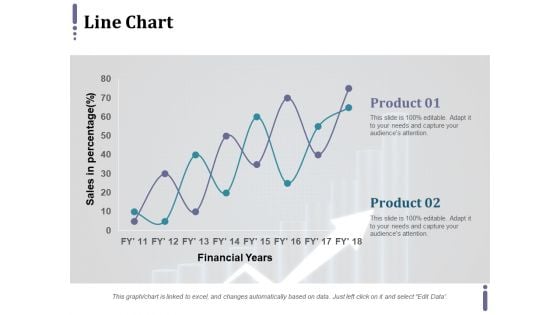
Line Chart Ppt PowerPoint Presentation Infographic Template Master Slide
This is a line chart ppt powerpoint presentation infographic template master slide. This is a two stage process. The stages in this process are product, financial years, sales in percentage.
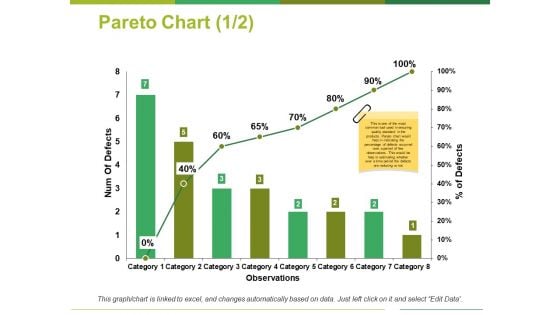
Pareto Chart Template 1 Ppt PowerPoint Presentation Outline Show
This is a pareto chart template 1 ppt powerpoint presentation outline show. This is a eight stage process. The stages in this process are num of defects, percentage of defects, observations, category.
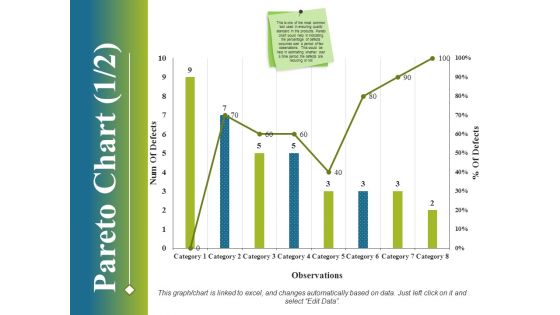
Pareto Chart Template 1 Ppt PowerPoint Presentation File Ideas
This is a pareto chart template 1 ppt powerpoint presentation file ideas. This is a eight stage process. The stages in this process are business, finance, marketing, strategy, analysis.
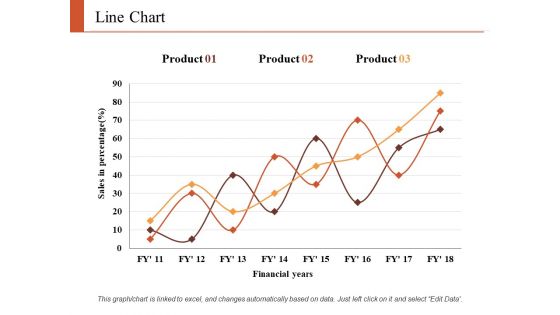
Line Chart Finance Ppt PowerPoint Presentation Infographic Template Graphics Tutorials
This is a line chart finance ppt powerpoint presentation infographic template graphics tutorials. This is a three stage process. The stages in this process are finance, marketing, analysis, business, investment.
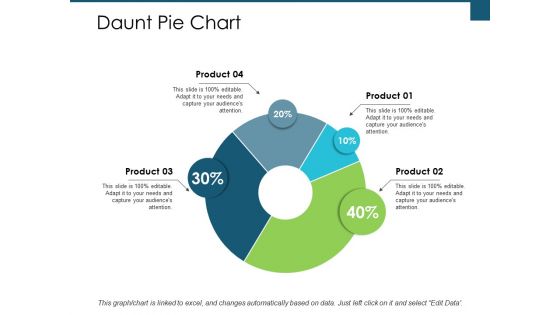
Daunt Pie Chart Investment Ppt PowerPoint Presentation Infographic Template Aids
This is a daunt pie chart investment ppt powerpoint presentation infographic template aids. This is a four stage process. The stages in this process are finance, analysis, business, investment, marketing.
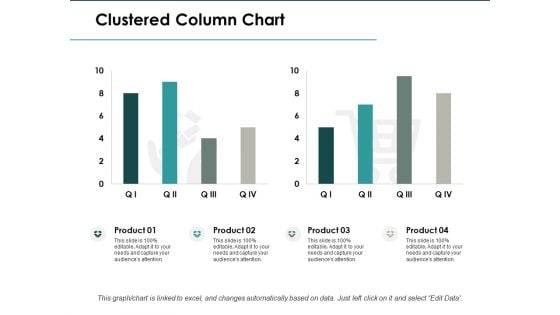
Clustered Column Chart Investment Ppt PowerPoint Presentation Infographic Template Clipart
This is a clustered column chart investment ppt powerpoint presentation infographic template clipart. This is a four stage process. The stages in this process are finance, analysis, business, investment, marketing.
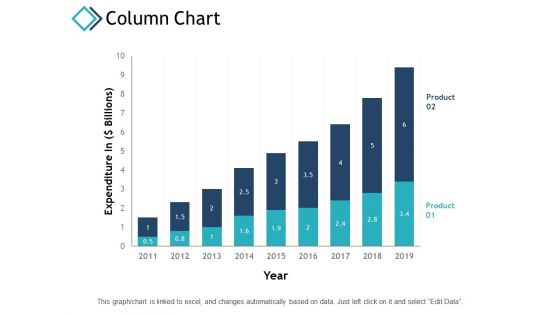
Column Chart Finance Investment Ppt PowerPoint Presentation Inspiration Template
This is a column chart finance investment ppt powerpoint presentation inspiration template. This is a two stage process. The stages in this process are finance, analysis, business, investment, marketing.
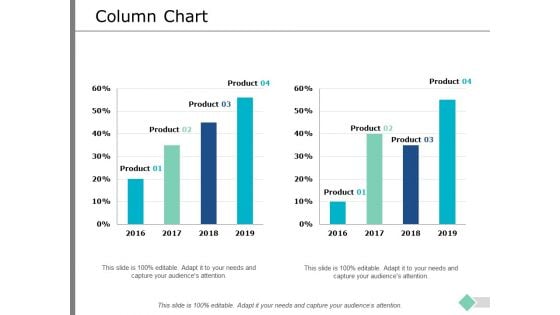
Column Chart Marketing Finance Ppt PowerPoint Presentation Infographic Template Rules
This is a column chart marketing finance ppt powerpoint presentation infographic template rules. This is a two stage process. The stages in this process are finance, analysis, business, investment, marketing.
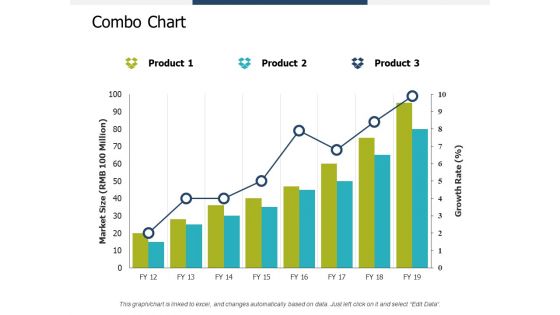
Combo Chart Investment Ppt PowerPoint Presentation Summary Infographic Template
This is a combo chart investment ppt powerpoint presentation summary infographic template. This is a three stage process. The stages in this process are finance, analysis, business, investment, marketing.
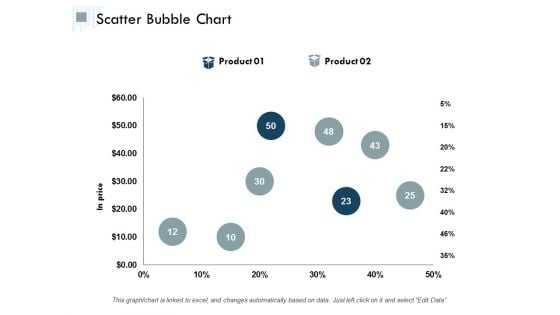
Scatter Bubble Chart Ppt PowerPoint Presentation Infographic Template Graphics Design
This is a scatter bubble chart ppt powerpoint presentation infographic template graphics design. This is a two stage process. The stages in this process are finance, analysis, business, investment, marketing.
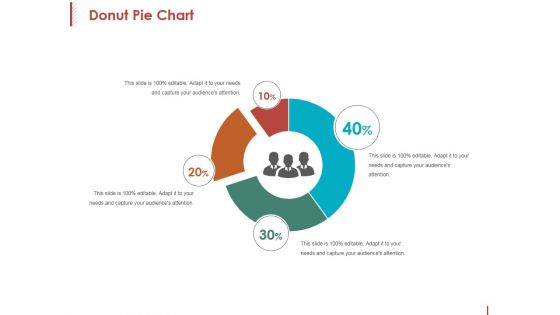
Donut Pie Chart Ppt PowerPoint Presentation Professional Example File
This is a donut pie chart ppt powerpoint presentation professional example file. This is a four stage process. The stages in this process are percentage, finance, donut, business, process.
Open High Low Close Chart Ppt PowerPoint Presentation Gallery Icons
This is a open high low close chart ppt powerpoint presentation gallery icons. This is a five stage process. The stages in this process are business, marketing, finance, planning, strategy.

Rational Perspectives On Decision Making Chart Ppt Slides
This is a rational perspectives on decision making chart ppt slides. This is a six stage process. The stages in this process are recognition of decision requirement, diagnosis and analysis of causes, development of alternatives, selection of desired alternative, implementation of chosen alternative, evaluation and feedback, decision making process.
Donut Pie Chart Ppt PowerPoint Presentation Icon Background Designs
This is a donut pie chart ppt powerpoint presentation icon background designs. This is a four stage process. The stages in this process are product, percentage, finance, donut, business.
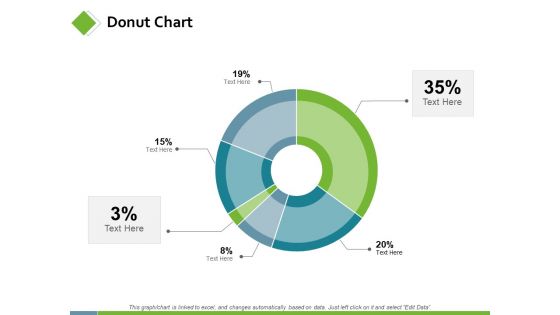
Donut Chart Marketing Planning Ppt PowerPoint Presentation Model Slideshow
This is a donut chart marketing planning ppt powerpoint presentation model slideshow. This is a six stage process. The stages in this process are finance, analysis, business, investment, marketing.
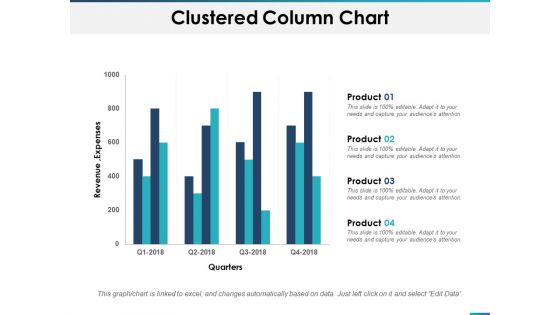
Clustered Column Chart Planning Ppt PowerPoint Presentation Portfolio Information
This is a clustered column chart planning ppt powerpoint presentation portfolio information. This is a four stage process. The stages in this process are finance, marketing, analysis, business, investment.
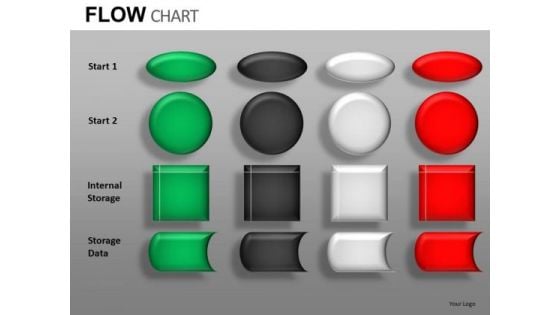
Stages Of Flow Chart Process Diagram Powerpont Slides Download
Stages of Flow Chart Process Diagram PowerPont slides Download-These high quality powerpoint pre-designed slides and powerpoint templates have been carefully created by our professional team to help you impress your audience. All slides have been created and are 100% editable in powerpoint. Each and every property of any graphic - color, size, orientation, shading, outline etc. can be modified to help you build an effective powerpoint presentation. Any text can be entered at any point in the powerpoint template or slide. Simply DOWNLOAD, TYPE and PRESENT!These PowerPoint Presentation slides can be used for themes relating to--Business, businessman, chain, chart, communication, community, company, concept, connection, contact, corporate, creativity, data, database, diagram, draw, drawing, education, executive, flow, flowchart, global, graphic, group, illustration, internet, isolated, job, manager, meeting, net, network, networking, office, organization, people, person, plan, presentation, relationship, screen, social, structure, success, team, teamwork, web, white, work, writing Finally find answers with our Stages Of Flow Chart Process Diagram Powerpont Slides Download. Your efforts will culminate in success.
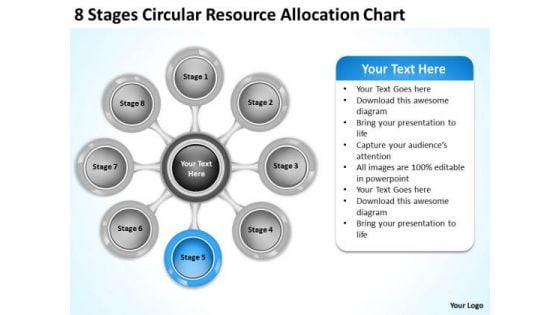
Total Marketing Concepts Circular Resource Allocation Chart Business Intelligence Strategy
We present our total marketing concepts circular resource allocation chart business intelligence strategy.Present our Circle Charts PowerPoint Templates because Our PowerPoint Templates and Slides will let you Leave a lasting impression to your audiences. They possess an inherent longstanding recall factor. Use our Business PowerPoint Templates because Our PowerPoint Templates and Slides team portray an attitude of elegance. Personify this quality by using them regularly. Download our Marketing PowerPoint Templates because Our PowerPoint Templates and Slides will provide you a launch platform. Give a lift off to your ideas and send them into orbit. Present our Finance PowerPoint Templates because Our PowerPoint Templates and Slides are specially created by a professional team with vast experience. They diligently strive to come up with the right vehicle for your brilliant Ideas. Download our Success PowerPoint Templates because Our PowerPoint Templates and Slides will give you great value for your money. Be assured of finding the best projection to highlight your words. Use these PowerPoint slides for presentations relating to flow, circular, chart, market, target, formula, future, business, plan, concept, render, curving, classroom, success, presentation, symbol, mind map, diagram, circle, graphic, questions, process, element, analysis, visualize, goal, flowchart, marketing, word, idea, mind, management, cycle, solve, strategy, solutions, training, direction, design, trends, text, motion, conference, organization, organize, movement, brainstorming, financial, product, . The prominent colors used in the PowerPoint template are Blue, Gray, Black. Put out some feelers on our Total Marketing Concepts Circular Resource Allocation Chart Business Intelligence Strategy. They will extract encouraging responses.
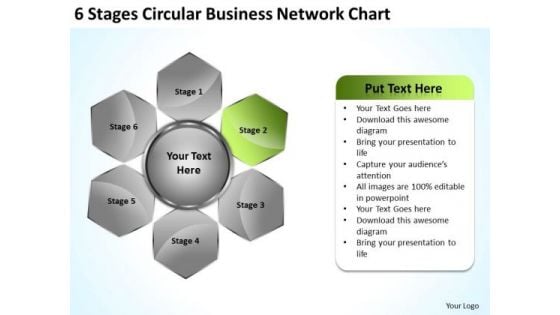
Marketing Concepts 6 Stages Circular Business Network Chart Strategy
We present our marketing concepts 6 stages circular business network chart strategy.Present our Advertising PowerPoint Templates because Our PowerPoint Templates and Slides come in all colours, shades and hues. They help highlight every nuance of your views. Use our Business PowerPoint Templates because Your audience will believe you are the cats whiskers. Present our Circle Charts PowerPoint Templates because You can Inspire your team with our PowerPoint Templates and Slides. Let the force of your ideas flow into their minds. Download and present our Hexagon PowerPoint Templates because Our PowerPoint Templates and Slides are conceived by a dedicated team. Use them and give form to your wondrous ideas. Use our Marketing PowerPoint Templates because Our PowerPoint Templates and Slides are designed to help you succeed. They have all the ingredients you need.Use these PowerPoint slides for presentations relating to Process, Business, Link, Central, Diagram, Hexagon, Man, Hexagonal, Flow, Write, Blank, Concept, Centric, Center, Sketch, Background, Human, Seminar, Whiteboard, Teacher, Plan, Sign, Presentation, Graphic, Pen, Reverse, Analysis, Teaching, Idea, Creativity, Connection, Chart, Strategy, Person, Empty, Showing, Advice, Connect, Pointing, Meeting, Education, Draw, Manager, Analyze, Office, Reversible, Screen, Hand, Counter, Businessman. The prominent colors used in the PowerPoint template are Green, Gray, Black. With our Marketing Concepts 6 Stages Circular Business Network Chart Strategy fear is never a factor. Do not allow adversity to effect you.
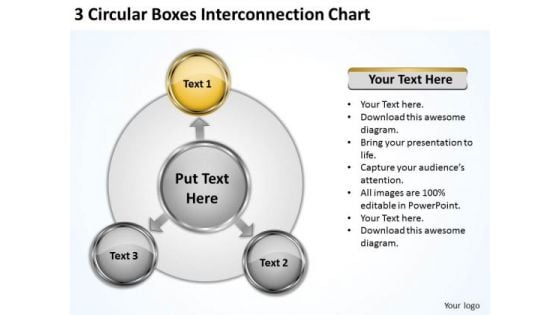
3 Circular Boxes Interconnection Chart Small Business Plan PowerPoint Slides
We present our 3 circular boxes interconnection chart small business plan PowerPoint Slides.Download and present our Circle Charts PowerPoint Templates because Our PowerPoint Templates and Slides are topically designed to provide an attractive backdrop to any subject. Download our Arrows PowerPoint Templates because You can Be the star of the show with our PowerPoint Templates and Slides. Rock the stage with your ideas. Download our Business PowerPoint Templates because Our PowerPoint Templates and Slides will let you meet your Deadlines. Present our Marketing PowerPoint Templates because Our PowerPoint Templates and Slides provide you with a vast range of viable options. Select the appropriate ones and just fill in your text. Download our Shapes PowerPoint Templates because Our PowerPoint Templates and Slides are endowed to endure. Ideas conveyed through them will pass the test of time.Use these PowerPoint slides for presentations relating to Diagram, sharing, network, content, business, plan, concept, arrow, relate, circle, describe, manage, chart, system, strategy, solution, problem, method, organization, connect, link, arrange, information, plan, branch, analyze, structure, present, approach, effective . The prominent colors used in the PowerPoint template are Orange, Gray, White. With our 3 Circular Boxes Interconnection Chart Small Business Plan PowerPoint Slides you will never falter. Your thoughts will move ahead sure-footedly.
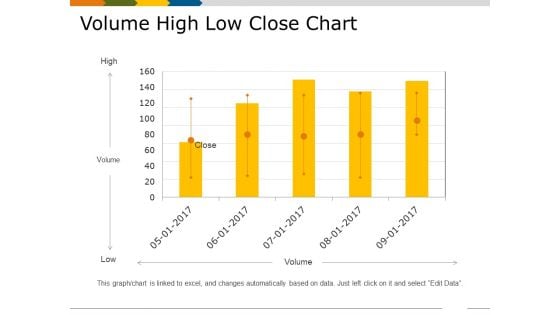
Volume High Low Close Chart Ppt PowerPoint Presentation Gallery Ideas
This is a volume high low close chart ppt powerpoint presentation gallery ideas. This is a five stage process. The stages in this process are high, volume, low, graph, business.
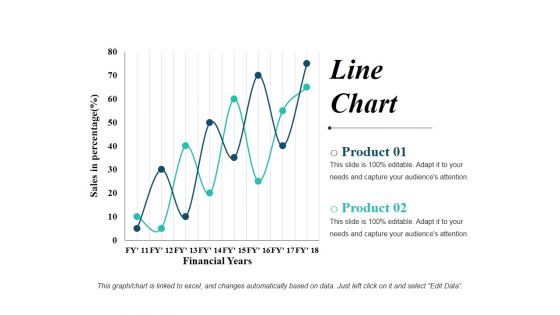
Line Chart Ppt PowerPoint Presentation Show Graphics Design
This is a line chart ppt powerpoint presentation show graphics design. This is a two stage process. The stages in this process are line graph, business, marketing, finance, planning.
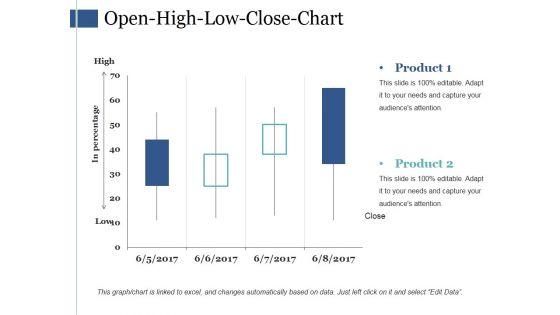
Open High Low Close Chart Ppt PowerPoint Presentation Styles Example
This is a open high low close chart ppt powerpoint presentation styles example. This is a four stage process. The stages in this process are business, marketing, finance, strategy, planning.
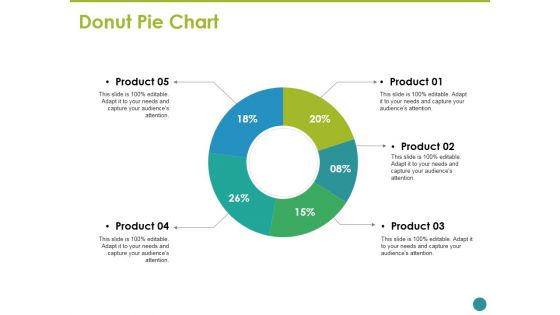
Donut Pie Chart Ppt PowerPoint Presentation Inspiration Graphic Images
This is a donut pie chart ppt powerpoint presentation inspiration graphic images. This is a five stage process. The stages in this process are business, marketing, strategy, planning, donut.
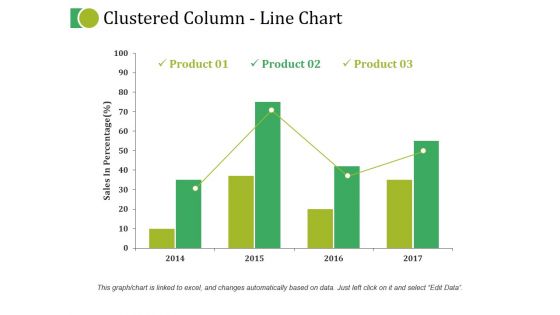
Clustered Column Line Chart Ppt PowerPoint Presentation Inspiration Graphics Pictures
This is a clustered column line chart ppt powerpoint presentation inspiration graphics pictures. This is a four stage process. The stages in this process are business, marketing, strategy, planning, finance.
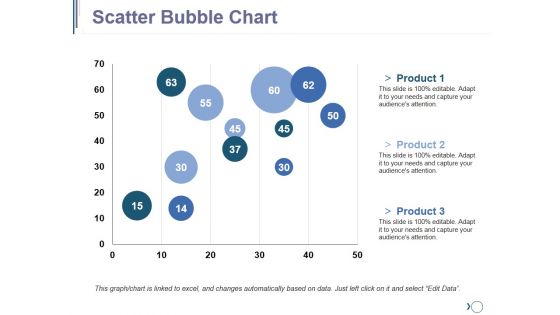
Scatter Bubble Chart Ppt PowerPoint Presentation Outline Graphics Pictures
This is a scatter bubble chart ppt powerpoint presentation outline graphics pictures. This is a three stage process. The stages in this process are finance, planning, business, marketing, strategy.
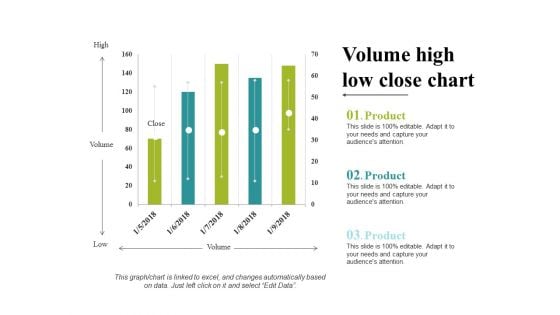
Volume High Low Close Chart Ppt PowerPoint Presentation Portfolio Clipart
This is a volume high low close chart ppt powerpoint presentation portfolio clipart. This is a five stage process. The stages in this process are business, marketing, strategy, planning, finance.
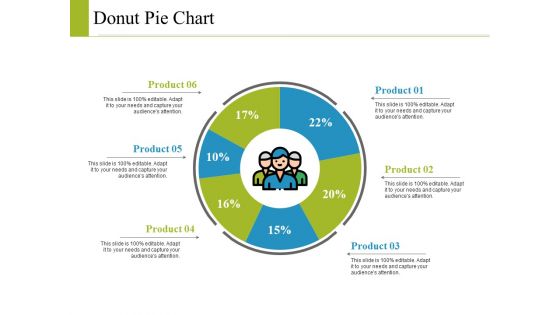
Donut Pie Chart Ppt PowerPoint Presentation Model Graphics Example
This is a donut pie chart ppt powerpoint presentation model graphics example. This is a six stage process. The stages in this process are business, marketing, strategy, planning, finance.
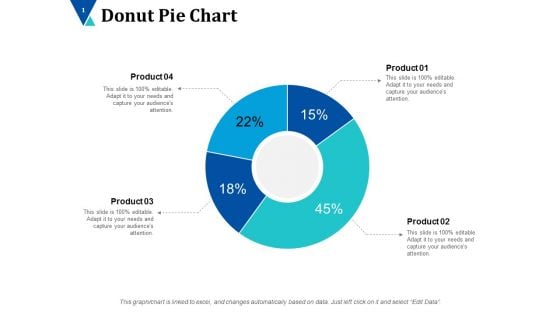
Donut Pie Chart Ppt PowerPoint Presentation Inspiration Designs Download
This is a donut pie chart ppt powerpoint presentation inspiration designs download. This is a four stage process. The stages in this process are donut, business, planning, marketing, finance.
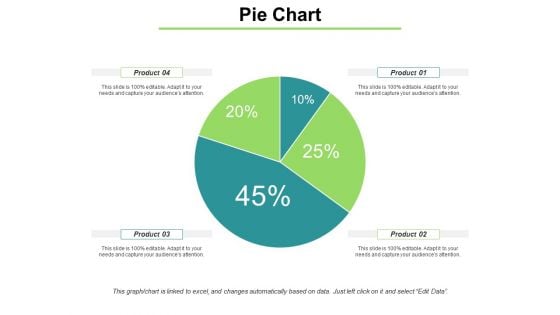
Pie Chart With Distrubation Ppt PowerPoint Presentation Model Ideas
This is a pie chart with distrubation ppt powerpoint presentation model ideas. This is a four stage process. The stages in this process are pie, finance, marketing, strategy, planning.
Bar Chart Ppt PowerPoint Presentation Icon Design Templates
This is a bar chart ppt powerpoint presentation icon design templates. This is a nine stage process. The stages in this process are sales in percentage, bar graph, business, marketing, growth.
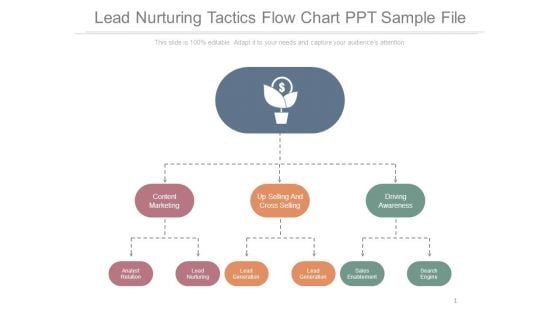
Lead Nurturing Tactics Flow Chart Ppt Sample File
This is a lead nurturing tactics flow chart ppt sample file. This is a three stage process. The stages in this process are content marketing, up selling and cross selling, driving awareness, search engine, sales enablement, lead generation, lead nurturing, analyst relation.

Risk Impact And Probability Chart Ppt PowerPoint Presentation Inspiration Background
Presenting this set of slides with name risk impact and probability chart ppt powerpoint presentation inspiration background. This is a four stage process. The stages in this process are contingency risks, major risks, minor risks, high incidence risks. This is a completely editable PowerPoint presentation and is available for immediate download. Download now and impress your audience.


 Continue with Email

 Home
Home


