Scoring Chart
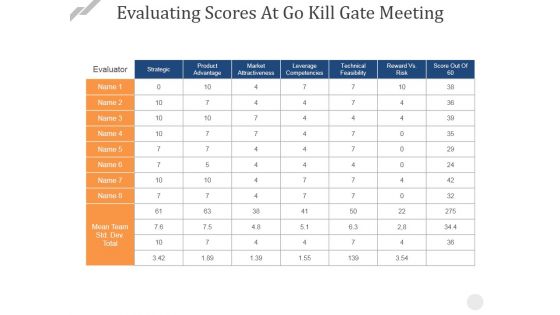
Evaluating Scores At Go Kill Gate Meeting Ppt PowerPoint Presentation Professional Outline
This is a evaluating scores at go kill gate meeting ppt powerpoint presentation professional outline. This is a seven stage process. The stages in this process are strategic, evaluation, product advantage, leverage competencies, technical feasibility.

leadership skills assessment template with scores ppt powerpoint presentation outline show
Presenting this set of slides with name leadership skills assessment template with scores ppt powerpoint presentation outline show. The topics discussed in these slides are business, marketing, personality traits. This is a completely editable PowerPoint presentation and is available for immediate download. Download now and impress your audience.
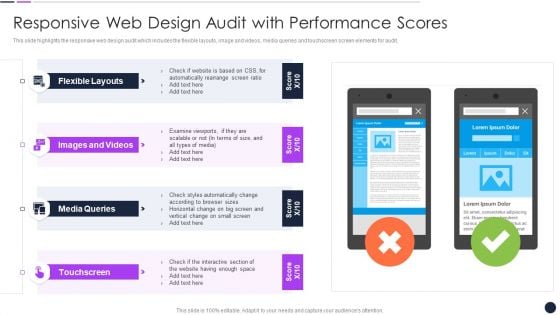
Effective Digital Marketing Audit Process Responsive Web Design Audit With Performance Scores Topics PDF
This slide highlights the responsive web design audit which includes the flexible layouts, image and videos, media queries and touchscreen screen elements for audit.Deliver and pitch your topic in the best possible manner with this Effective Digital Marketing Audit Process Responsive Web Design Audit With Performance Scores Topics PDF. Use them to share invaluable insights on Flexible Layouts, Touchscreen, Media Queries and impress your audience. This template can be altered and modified as per your expectations. So, grab it now.

SCR For Market Calculating Brand Wallet Share Satisfaction Scores Introduction PDF
The purpose of this slide is to provide information regarding the measurement of wallet share of a particular brand for various customers. This is a SCR for market calculating brand wallet share satisfaction scores introduction pdf template with various stages. Focus and dispense information on one stage using this creative set, that comes with editable features. It contains large content boxes to add your information on topics like calculating brand wallet share. You can also showcase facts, figures, and other relevant content using this PPT layout. Grab it now.
Store Positioning In Retail Management Retail Location Factor Rating Scores Icons PDF
This slide signifies that a company can rate each site with a value from the range based on the costs and benefits offered by the alternative locations and multiply this value by the appropriate weight. These numbers are then summed to get an overall factor rating. Then a company can compare the overall ratings of alternative sites. This technique enables a company to choose a location systematically based on the best rating Deliver an awe inspiring pitch with this creative store positioning in retail management retail location factor rating scores icons pdf bundle. Topics like energy availability, traffic volume, operating cost can be discussed with this completely editable template. It is available for immediate download depending on the needs and requirements of the user.

Teamwork To Make A Pie Chart PowerPoint Templates Ppt Backgrounds For Slides 0713
Dress up your views with our Teamwork_To_Make_A_Pie_Chart_PowerPoint_Templates_PPT_Backgrounds_For_Slides. Deliver your ideas with aplomb. Dribble away with our People PowerPoint Templates. Score a goal with your ideas. Drill it in with our Pie Charts PowerPoint Templates. Embed your message into the minds of your audience. The audience will be happy to pay any fee. They will be all agog to see our Teamwork To Make A Pie Chart PowerPoint Templates Ppt Backgrounds For Slides 0713.
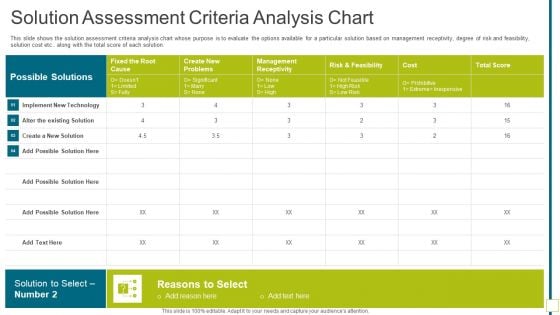
Solution Assessment Criteria Analysis Chart Solution Evaluation Validation Meet Organizational Needs Diagrams PDF
This slide shows the solution assessment criteria analysis chart whose purpose is to evaluate the options available for a particular solution based on management receptivity, degree of risk and feasibility, solution cost etc.. along with the total score of each solution. Deliver and pitch your topic in the best possible manner with this solution assessment criteria analysis chart solution evaluation validation meet organizational needs diagrams pdf. Use them to share invaluable insights on solution assessment criteria analysis chart and impress your audience. This template can be altered and modified as per your expectations. So, grab it now.
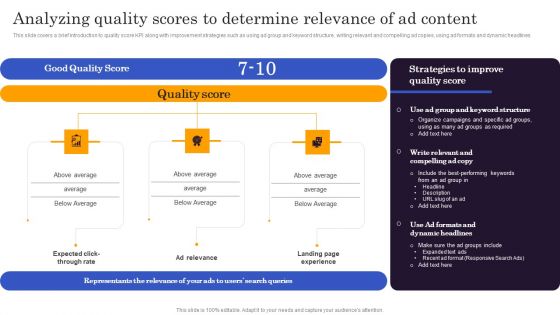
Marketers Guide To Data Analysis Optimization Analyzing Quality Scores To Determine Relevance Of Ad Content Diagrams PDF
This slide covers a brief introduction to quality score KPI along with improvement strategies such as using ad group and keyword structure, writing relevant and compelling ad copies, using ad formats and dynamic headlines. If you are looking for a format to display your unique thoughts, then the professionally designed Marketers Guide To Data Analysis Optimization Analyzing Quality Scores To Determine Relevance Of Ad Content Diagrams PDF is the one for you. You can use it as a Google Slides template or a PowerPoint template. Incorporate impressive visuals, symbols, images, and other charts. Modify or reorganize the text boxes as you desire. Experiment with shade schemes and font pairings. Alter, share or cooperate with other people on your work. Download Marketers Guide To Data Analysis Optimization Analyzing Quality Scores To Determine Relevance Of Ad Content Diagrams PDF and find out how to give a successful presentation. Present a perfect display to your team and make your presentation unforgettable.
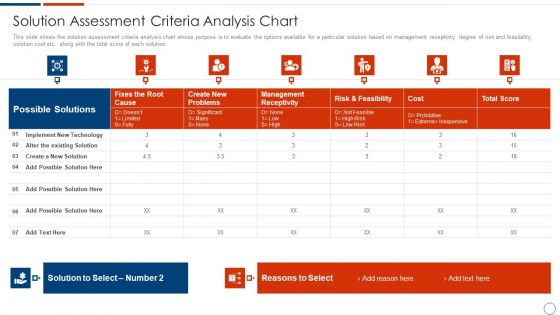
Solution Assessment And Validation To Determine Business Readiness Solution Assessment Criteria Analysis Chart Brochure PDF
This slide shows the solution assessment criteria analysis chart whose purpose is to evaluate the options available for a particular solution based on management receptivity, degree of risk and feasibility, solution cost etc. along with the total score of each solution. Deliver an awe inspiring pitch with this creative solution assessment and validation to determine business readiness solution assessment criteria analysis chart brochure pdf bundle. Topics like implement new technology, existing solution, possible solution can be discussed with this completely editable template. It is available for immediate download depending on the needs and requirements of the user.
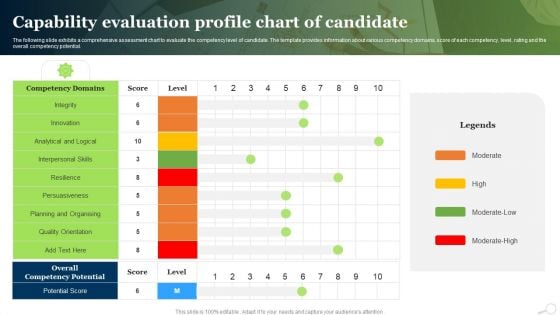
Capability Evaluation Profile Chart Of Candidate Ppt PowerPoint Presentation Slides Graphics Example PDF
The following slide exhibits a comprehensive assessment chart to evaluate the competency level of candidate. The template provides information about various competency domains, score of each competency, level, rating and the overall competency potential.Showcasing this set of slides titled Capability Evaluation Profile Chart Of Candidate Ppt PowerPoint Presentation Slides Graphics Example PDF. The topics addressed in these templates are Persuasiveness, Interpersonal Skills, Analytical Logical. All the content presented in this PPT design is completely editable. Download it and make adjustments in color, background, font etc. as per your unique business setting.
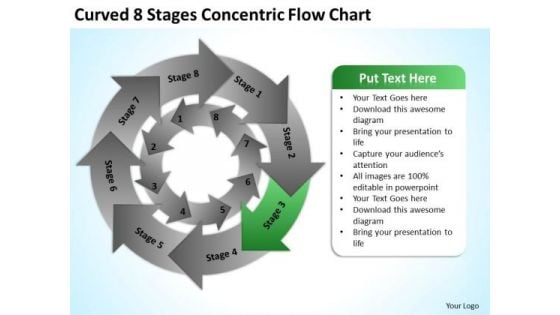
Curved 8 Stages Concentric Flow Chart Ppt Business Plan PowerPoint Slides
We present our curved 8 stages concentric flow chart ppt business plan PowerPoint Slides.Download and present our Arrows PowerPoint Templates because Our PowerPoint Templates and Slides provide you with a vast range of viable options. Select the appropriate ones and just fill in your text. Download our Flow Charts PowerPoint Templates because You are well armed with penetrative ideas. Our PowerPoint Templates and Slides will provide the gunpowder you need. Download our Business PowerPoint Templates because You can Score a slam dunk with our PowerPoint Templates and Slides. Watch your audience hang onto your every word. Download our Shapes PowerPoint Templates because Our PowerPoint Templates and Slides are the chords of your song. String them along and provide the lilt to your views. Download our Process and Flows PowerPoint Templates because Our PowerPoint Templates and Slides offer you the widest possible range of options.Use these PowerPoint slides for presentations relating to Arrow, process, vector, icon, circular, chart, concept, wheel, set, loop, turn, flow, chromatic, sign, spectrum, rotation, recycling, pantone, symbol, diagram, circle,ring, recycle, dynamic, graphic, element, flowchart, spin, paint, graph, multicolored, cycle, circulation, palette, connection, cursor, round, collection, direction, group, motion, progress, movement, cyclic, continuity, repetition. The prominent colors used in the PowerPoint template are Black, Gray, Green. Soak in the energy our Curved 8 Stages Concentric Flow Chart Ppt Business Plan PowerPoint Slides emit. Your thoughts will find them exhilirating.
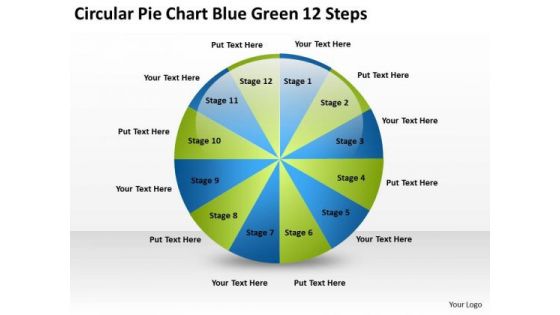
Circular Pie Chart Blue Green 12 Steps Examples Of Business Plan PowerPoint Slides
We present our circular pie chart blue green 12 steps examples of business plan PowerPoint Slides.Use our Circle Charts PowerPoint Templates because You aspire to touch the sky with glory. Let our PowerPoint Templates and Slides provide the fuel for your ascent. Download and present our Signs PowerPoint Templates because They will Put the wind in your sails. Skim smoothly over the choppy waters of the market. Download and present our Shapes PowerPoint Templates because You can Score a slam dunk with our PowerPoint Templates and Slides. Watch your audience hang onto your every word. Download our Process and Flows PowerPoint Templates because It can Conjure up grand ideas with our magical PowerPoint Templates and Slides. Leave everyone awestruck by the end of your presentation. Download and present our Business PowerPoint Templates because These PowerPoint Templates and Slides will give the updraft to your ideas. See them soar to great heights with ease.Use these PowerPoint slides for presentations relating to pie, chart, green, diagram, blue, 3d, yellow, vector, graph, information, market, percent, opinion, red, business, sign, symbol, orange, percentage, graphic, finance, element, drawing, report, marketing, shape, illustration, icon, earnings, scientific, piece, circular, strategy, round, shiny, money, design, science, survey, growth, global, account, part, beautiful, investment, statistic, financial, ecological, results, portion. The prominent colors used in the PowerPoint template are Green, Blue, Black. Feast your eyes on our Circular Pie Chart Blue Green 12 Steps Examples Of Business Plan PowerPoint Slides. Get drawn in by their colorful display.
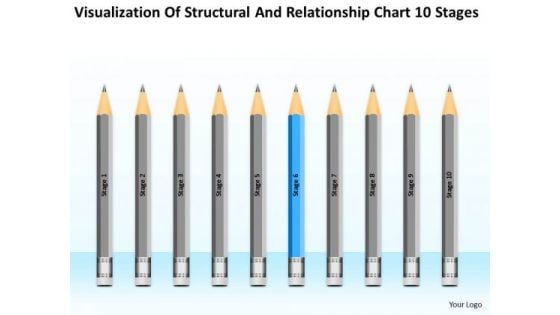
Structural And Relationship Chart 10 Stages Ppt Samples Business Plan PowerPoint Slides
We present our structural and relationship chart 10 stages ppt samples business plan PowerPoint Slides.Download and present our Education PowerPoint Templates because You can Score a slam dunk with our PowerPoint Templates and Slides. Watch your audience hang onto your every word. Download and present our Process and Flows PowerPoint Templates because Our PowerPoint Templates and Slides help you pinpoint your timelines. Highlight the reasons for your deadlines with their use. Use our Flow Charts PowerPoint Templates because our PowerPoint Templates and Slides are the string of your bow. Fire of your ideas and conquer the podium. Download and present our Marketing PowerPoint Templates because You can Bait your audience with our PowerPoint Templates and Slides. They will bite the hook of your ideas in large numbers. Download our Business PowerPoint Templates because You can Zap them with our PowerPoint Templates and Slides. See them reel under the impact.Use these PowerPoint slides for presentations relating to Mark, corporate, business, plan, concept, bright, symbol, diagram, crayon, stack, graphic, finance, stock,analysis, drawing, paint, calculation, accounting, creative, economic, creativity, chart, forecast, design, color, objects, stationary, pencil, education,profit, information, background, investment, figures, ten, business, business process. The prominent colors used in the PowerPoint template are Blue, Gray, Black. Flood your audience with great slides with our Structural And Relationship Chart 10 Stages Ppt Samples Business Plan PowerPoint Slides. Try us out and see what a difference our templates make.
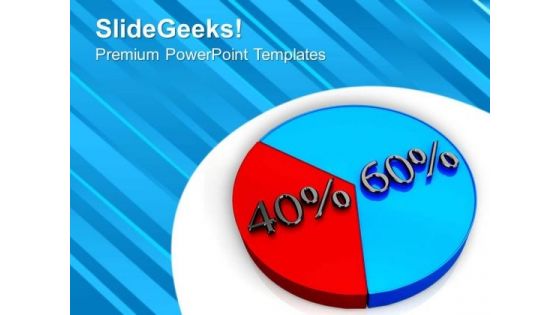
Pie Chart 60 40 Percent Business Theme PowerPoint Templates Ppt Backgrounds For Slides 0413
We present our Pie Chart 60 40 Percent Business Theme PowerPoint Templates PPT Backgrounds For Slides 0413.Present our Pie charts PowerPoint Templates because You can Bask in the warmth of our PowerPoint Templates and Slides. Enjoy the heartfelt glowing response of your listeners. Download and present our Business PowerPoint Templates because You can Score a slam dunk with our PowerPoint Templates and Slides. Watch your audience hang onto your every word. Use our Success PowerPoint Templates because You can Raise a toast with our PowerPoint Templates and Slides. Spread good cheer amongst your audience. Download our Marketing PowerPoint Templates because Our PowerPoint Templates and Slides are innately eco-friendly. Their high recall value negate the need for paper handouts. Present our Finance PowerPoint Templates because Our PowerPoint Templates and Slides will let your words and thoughts hit bullseye everytime.Use these PowerPoint slides for presentations relating to Pie chart with sixty and forty percent, business, marketing, finance, success, shapes . The prominent colors used in the PowerPoint template are Red, Blue, Black. With our Pie Chart 60 40 Percent Business Theme PowerPoint Templates Ppt Backgrounds For Slides 0413 you won't bat an eyelid. Display your ability with equanimity.
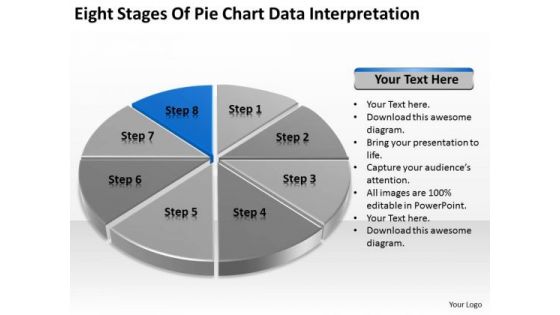
Eight Stages Of Pie Chart Data Interpretation Detailed Business Plan PowerPoint Templates
We present our eight stages of pie chart data interpretation detailed business plan PowerPoint templates.Download and present our Competition PowerPoint Templates because You can Stir your ideas in the cauldron of our PowerPoint Templates and Slides. Cast a magic spell on your audience. Download and present our Marketing PowerPoint Templates because You should Kick up a storm with our PowerPoint Templates and Slides. The heads of your listeners will swirl with your ideas. Download and present our Arrows PowerPoint Templates because Your ideas provide food for thought. Our PowerPoint Templates and Slides will help you create a dish to tickle the most discerning palate. Present our Circle Charts PowerPoint Templates because You can Stir your ideas in the cauldron of our PowerPoint Templates and Slides. Cast a magic spell on your audience. Download our Business PowerPoint Templates because You can Score a slam dunk with our PowerPoint Templates and Slides. Watch your audience hang onto your every word.Use these PowerPoint slides for presentations relating to chart, graph, pie, 3d, diagram, graphic, icon, control, business, data, profit, market, sales, display, corporate, concept, render, success, presentation, finance, report, marketing, accounting, management, piece, strategy, money, growth, company, competition, progress, account, sheet, part, information, investment, improvement, banking, index, financial, reflect, results, performance, exchange. The prominent colors used in the PowerPoint template are Blue, Black, Gray. Exult in the comfort of our Eight Stages Of Pie Chart Data Interpretation Detailed Business Plan PowerPoint Templates. Experience the convenience they deliver.
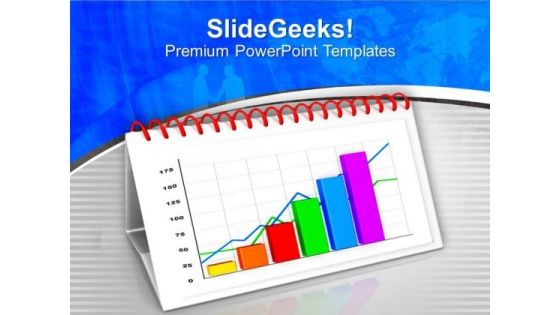
Calendar With Growth Chart Business PowerPoint Templates Ppt Backgrounds For Slides 0213
We present our Calendar With Growth Chart Business PowerPoint Templates PPT Backgrounds For Slides 0213.Download and present our Signs PowerPoint Templates because You can Score a slam dunk with our PowerPoint Templates and Slides. Watch your audience hang onto your every word. Download and present our Shapes PowerPoint Templates because Our PowerPoint Templates and Slides will let you Hit the target. Go the full distance with ease and elan. Present our Finance PowerPoint Templates because They will Put your wonderful verbal artistry on display. Our PowerPoint Templates and Slides will provide you the necessary glam and glitter. Download and present our Business PowerPoint Templates because Our PowerPoint Templates and Slides are like the strings of a tennis racquet. Well strung to help you serve aces. Download and present our Success PowerPoint Templates because They will Put your wonderful verbal artistry on display. Our PowerPoint Templates and Slides will provide you the necessary glam and glitter.Use these PowerPoint slides for presentations relating to Calendar with growing chart, signs, shapes, business, success, finance . The prominent colors used in the PowerPoint template are Pink, Blue, Green. Don't drain your energy. Save it with our Calendar With Growth Chart Business PowerPoint Templates Ppt Backgrounds For Slides 0213. You will come out on top.
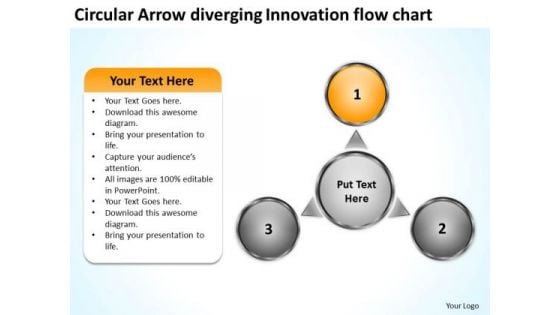
Circular Arrow Diverging Innovation Flow Chart Ppt Cycle Spoke Network PowerPoint Slides
We present our circular arrow diverging innovation flow chart ppt Cycle Spoke Network PowerPoint Slides.Download and present our Flow Charts PowerPoint Templates because this is an appropriate layout to convince your team that they have the ability to score a tEN every time. Download our Arrows PowerPoint Templates because watching them will strengthen your companys sinews. Present our Business PowerPoint Templates because it helps you to explain your plans in all earnest to your colleagues and raise the bar for all. Download our Shapes PowerPoint Templates because you should Emphasise the process of your business or corporate growth. Download our Process and Flows PowerPoint Templates because they are the tools that helped most of us evolve.Use these PowerPoint slides for presentations relating to 3d, Arrow, Chart, Circle, Circular, Circulation, Collection, Concept, Connection, Diagram, Direction, Flow, Flowchart, Graph, Graphic, Process, Progress, Ring, Round, Sign, Symbol, Vector, White . The prominent colors used in the PowerPoint template are Gray, Orange, White. People tell us our circular arrow diverging innovation flow chart ppt Cycle Spoke Network PowerPoint Slides are Great. Use our Connection PowerPoint templates and PPT Slides are Pleasant. Professionals tell us our circular arrow diverging innovation flow chart ppt Cycle Spoke Network PowerPoint Slides are Quaint. Presenters tell us our Chart PowerPoint templates and PPT Slides are Clever. Professionals tell us our circular arrow diverging innovation flow chart ppt Cycle Spoke Network PowerPoint Slides are Fashionable. PowerPoint presentation experts tell us our Chart PowerPoint templates and PPT Slides are Handsome. Be the architect of your own destiny. Design it with our Circular Arrow Diverging Innovation Flow Chart Ppt Cycle Spoke Network PowerPoint Slides.

Growth Bar Chart With Fluctuation Arrow PowerPoint Templates Ppt Backgrounds For Slides 0413
We present our Growth Bar Chart With Fluctuation Arrow PowerPoint Templates PPT Backgrounds For Slides 0413.Download and present our Business PowerPoint Templates because These PowerPoint Templates and Slides will give the updraft to your ideas. See them soar to great heights with ease. Download our Arrows PowerPoint Templates because You can Score a slam dunk with our PowerPoint Templates and Slides. Watch your audience hang onto your every word. Download and present our Marketing PowerPoint Templates because Our PowerPoint Templates and Slides will bullet point your ideas. See them fall into place one by one. Download our Success PowerPoint Templates because You can Bask in the warmth of our PowerPoint Templates and Slides. Enjoy the heartfelt glowing response of your listeners. Present our Shapes PowerPoint Templates because Our PowerPoint Templates and Slides will embellish your thoughts. See them provide the desired motivation to your team.Use these PowerPoint slides for presentations relating to Business fluctuations in the graph of color bars with an arrow, business, arrows, marketing, success, shapes. The prominent colors used in the PowerPoint template are Green, Yellow, Red. Our Growth Bar Chart With Fluctuation Arrow PowerPoint Templates Ppt Backgrounds For Slides 0413 adhere to the ethics. They comply with all the conditions.
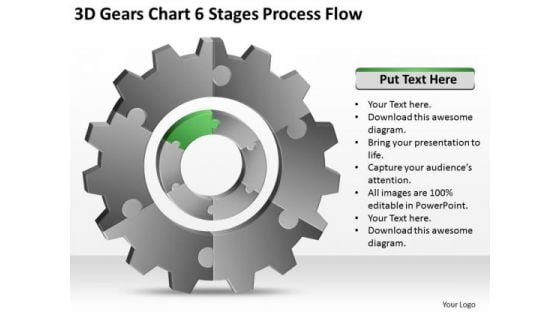
3d Gears Chart 6 Stages Process Flow Ppt Business Plan Example Free PowerPoint Templates
We present our 3d gears chart 6 stages process flow ppt business plan example free PowerPoint templates.Download our Industrial PowerPoint Templates because you should once Tap the ingenuity of our PowerPoint Templates and Slides. They are programmed to succeed. Download and present our Gear Wheels PowerPoint Templates because You can Score a slam dunk with our PowerPoint Templates and Slides. Watch your audience hang onto your every word. Present our Technology PowerPoint Templates because Our PowerPoint Templates and Slides are created with admirable insight. Use them and give your group a sense of your logical mind. Download our Shapes PowerPoint Templates because You can Hit the nail on the head with our PowerPoint Templates and Slides. Embed your ideas in the minds of your audience. Download our Business PowerPoint Templates because You can safely bank on our PowerPoint Templates and Slides. They will provide a growth factor to your valuable thoughts.Use these PowerPoint slides for presentations relating to gear, engineering, concept, green, vector, technical, steel, machinery, bio, sign, glossy, teamwork, symbol, circle, mechanical, ecology, cooperation, element, spin, engine, technology, wheel, modern, mechanism, illustration, icon, round, collection, industrial, reflection, design, mechanics, transparent, motion, machine, set, factory, progress, transmission, background, work, industry, clock, editable, communication, cogwheel. The prominent colors used in the PowerPoint template are Green, White, Gray. Whet their appetite with our 3d Gears Chart 6 Stages Process Flow Ppt Business Plan Example Free PowerPoint Templates. Build up desire with your thoughts.
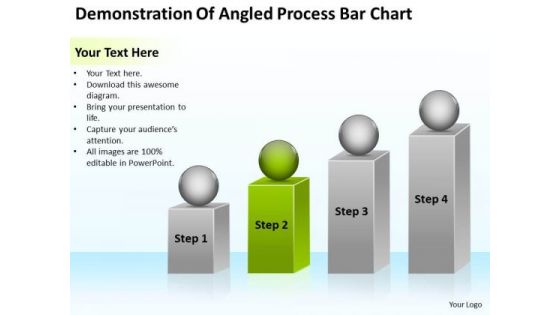
Demonstration Of Angled Process Bar Chart Ppt Make Business Plan PowerPoint Templates
We present our demonstration of angled process bar chart ppt make business plan PowerPoint templates.Present our Marketing PowerPoint Templates because Our PowerPoint Templates and Slides provide you with a vast range of viable options. Select the appropriate ones and just fill in your text. Present our Construction PowerPoint Templates because Our PowerPoint Templates and Slides are like the strings of a tennis racquet. Well strung to help you serve aces. Use our Spheres PowerPoint Templates because You can Score a slam dunk with our PowerPoint Templates and Slides. Watch your audience hang onto your every word. Present our Boxes PowerPoint Templates because It will let you Set new benchmarks with our PowerPoint Templates and Slides. They will keep your prospects well above par. Present our Business PowerPoint Templates because Our PowerPoint Templates and Slides will let you Leave a lasting impression to your audiences. They possess an inherent longstanding recall factor.Use these PowerPoint slides for presentations relating to 3d, human, cube, isolated, activity, achievement, business, success, decisions, teamwork, partnership, stack, occupation, people, building, shape, team, box, illustration, figure, creativity, togetherness, games, aspirations, group, growth, text, picking, progress, working, silhouette, puzzle, construction, concepts, structure, cartoon, ideas. The prominent colors used in the PowerPoint template are Green, White, Gray. Claim your prize with our Demonstration Of Angled Process Bar Chart Ppt Make Business Plan PowerPoint Templates. You will come out on top.
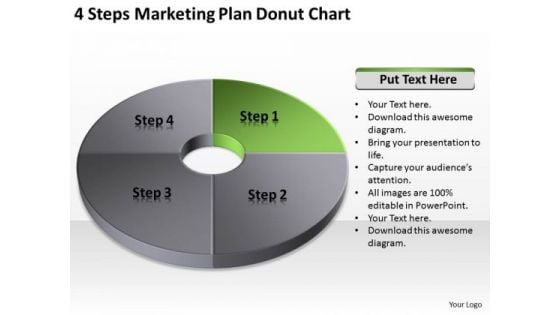
4 Steps Marketing Plan Donut Chart Ppt Business Format PowerPoint Slides
We present our 4 steps marketing plan donut chart ppt business format PowerPoint Slides.Download and present our Circle Charts PowerPoint Templates because You can Stir your ideas in the cauldron of our PowerPoint Templates and Slides. Cast a magic spell on your audience. Download our Shapes PowerPoint Templates because You can Score a slam dunk with our PowerPoint Templates and Slides. Watch your audience hang onto your every word. Use our Business PowerPoint Templates because Our PowerPoint Templates and Slides provide you with a vast range of viable options. Select the appropriate ones and just fill in your text. Present our Signs PowerPoint Templates because Our PowerPoint Templates and Slides are innately eco-friendly. Their high recall value negate the need for paper handouts. Download and present our Success PowerPoint Templates because You are working at that stage with an air of royalty. Let our PowerPoint Templates and Slides be the jewels in your crown.Use these PowerPoint slides for presentations relating to flow, icon, chart, life, flowchart, career, pdca, job, network, isolated, business plane, loop, business loop, system management, green, refresh, future, red, arrow, yellow, sign, rotation, recycling, symbol, diagram, circle system, circle, wealth, ring, recycle, graph, cycle, illustration, business education, connection, cmyk, money, success concept, direction, blue, motion, successful business, illness, education, business structure, contrast, work, business plan, for success, business wheel. The prominent colors used in the PowerPoint template are Green, Gray, Black. List your core competencies with our 4 Steps Marketing Plan Donut Chart Ppt Business Format PowerPoint Slides. They will make you look good.
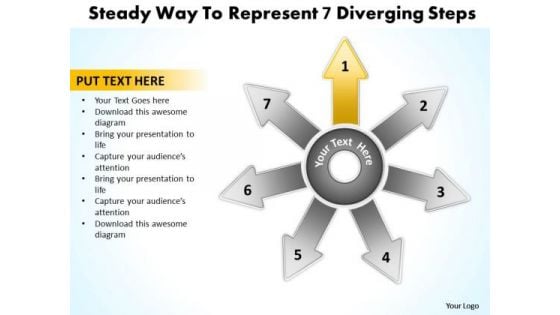
Steady Way To Represent 7 Diverging Step Relative Circular Arrow Chart PowerPoint Templates
We present our steady way to represent 7 diverging step Relative Circular Arrow Chart PowerPoint templates.Present our Business PowerPoint Templates because this slide will fire away with all the accuracy at your command. Download and present our Shapes PowerPoint Templates because You have gained great respect for your brilliant ideas. Use our PowerPoint Templates and Slides to strengthen and enhance your reputation. Download and present our Success PowerPoint Templates because this is an appropriate layout to convince your team that they have the ability to score a tEN every time. Present our Process and Flows PowerPoint Templates because It is Aesthetically crafted by artistic young minds. Our PowerPoint Templates and Slides are designed to display your dexterity. Download and present our Arrows PowerPoint Templates because You will get more than you ever bargained for. Use these PowerPoint slides for presentations relating to Arrow, Background, Center, Chart, Clip, Communication, Competition, Computer, Concept, Connect, Connection, Diagram, Direction, Group, Illustration, Information, Network, Process, Progress, Purpose, Strategy, Symbol, Target. The prominent colors used in the PowerPoint template are Yellow, Gray, White. People tell us our steady way to represent 7 diverging step Relative Circular Arrow Chart PowerPoint templates are Fantastic. People tell us our Concept PowerPoint templates and PPT Slides are aesthetically designed to attract attention. We guarantee that they will grab all the eyeballs you need. The feedback we get is that our steady way to represent 7 diverging step Relative Circular Arrow Chart PowerPoint templates are Nice. Presenters tell us our Clip PowerPoint templates and PPT Slides help you meet deadlines which are an element of today's workplace. Just browse and pick the slides that appeal to your intuitive senses. Customers tell us our steady way to represent 7 diverging step Relative Circular Arrow Chart PowerPoint templates are Magical. The feedback we get is that our Chart PowerPoint templates and PPT Slides are Royal. Our Steady Way To Represent 7 Diverging Step Relative Circular Arrow Chart PowerPoint Templates will blow your ideas. They will fan out across the audience.

Business Process Flow Chart Example And Laptop PowerPoint Templates Ppt Backgrounds For Slides
We present our business process flow chart example and laptop PowerPoint templates PPT backgrounds for slides.Use our Internet PowerPoint Templates because Our PowerPoint Templates and Slides has conjured up a web of all you need with the help of our great team. Use them to string together your glistening ideas. Download and present our Education PowerPoint Templates because You can Score a slam dunk with our PowerPoint Templates and Slides. Watch your audience hang onto your every word. Present our Business PowerPoint Templates because It will get your audience in sync. Present our Success PowerPoint Templates because You have gained great respect for your brilliant ideas. Use our PowerPoint Templates and Slides to strengthen and enhance your reputation. Use our Symbol PowerPoint Templates because Our PowerPoint Templates and Slides will give you great value for your money. Be assured of finding the best projection to highlight your words. Use these PowerPoint slides for presentations relating to 3d, Abstract, Aluminum, Attitude, Author, Black, Book, Browsing, Buttons, Communication, Deal, Finance, Hand, Human, Informatics, Isolated, Laptop, Laying, Letters, Man, Modern, Mouse, Network, Notebook, Office, Optimist, Pad, Pc, People, Person, Plastic, Reading, Research, Screen, Student, Tasks, Technology, Touch, White, Wireless. The prominent colors used in the PowerPoint template are Red, Gray, Black. We assure you our business process flow chart example and laptop PowerPoint templates PPT backgrounds for slides will help you be quick off the draw. Just enter your specific text and see your points hit home. Use our Author PowerPoint templates and PPT Slides will impress their bosses and teams. We assure you our business process flow chart example and laptop PowerPoint templates PPT backgrounds for slides are aesthetically designed to attract attention. We guarantee that they will grab all the eyeballs you need. Professionals tell us our Book PowerPoint templates and PPT Slides will generate and maintain the level of interest you desire. They will create the impression you want to imprint on your audience. The feedback we get is that our business process flow chart example and laptop PowerPoint templates PPT backgrounds for slides will impress their bosses and teams. You can be sure our Attitude PowerPoint templates and PPT Slides have awesome images to get your point across. Our Business Process Flow Chart Example And Laptop PowerPoint Templates Ppt Backgrounds For Slides are designed by a dedicated team. Use them and give form to your brilliant ideas.
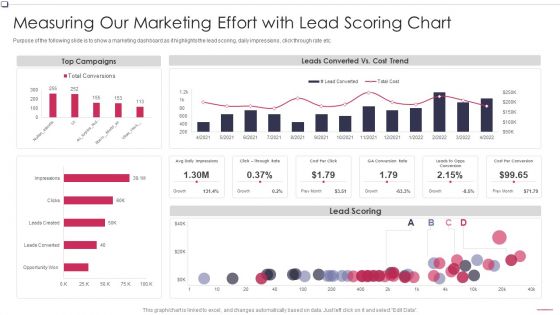
Measuring Our Marketing Chart Business To Business Promotion Sales Lead Professional PDF
Purpose of the following slide is to show a marketing dashboard as it highlights the lead scoring, daily impressions , click through rate etc. Deliver an awe inspiring pitch with this creative Measuring Our Marketing Chart Business To Business Promotion Sales Lead Professional PDF bundle. Topics like Lead Scoring, Leads Converted, Top Campaigns can be discussed with this completely editable template. It is available for immediate download depending on the needs and requirements of the user.
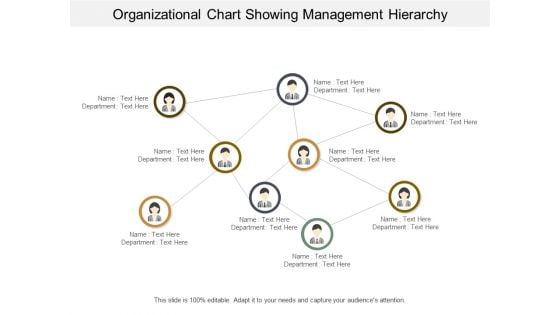
Organizational Chart Showing Management Hierarchy Ppt PowerPoint Presentation Visual Aids Infographics
This is a organizational chart showing management hierarchy ppt powerpoint presentation visual aids infographics. This is a nine stage process. The stages in this process are flow chart, org chart, hierarchy chart.
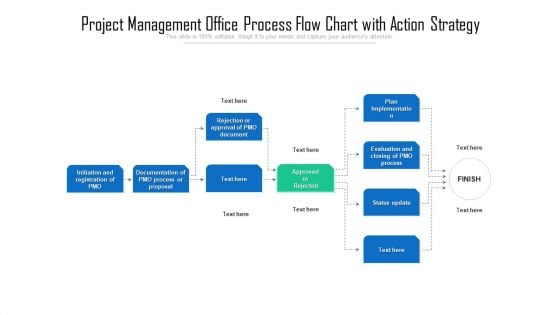
Project Management Office Process Flow Chart With Action Strategy Graphics PDF
Presenting project management office process flow chart with action strategy graphics pdf to dispense important information. This template comprises nine stages. It also presents valuable insights into the topics including project management office process flow chart with action strategy. This is a completely customizable PowerPoint theme that can be put to use immediately. So, download it and address the topic impactfully.
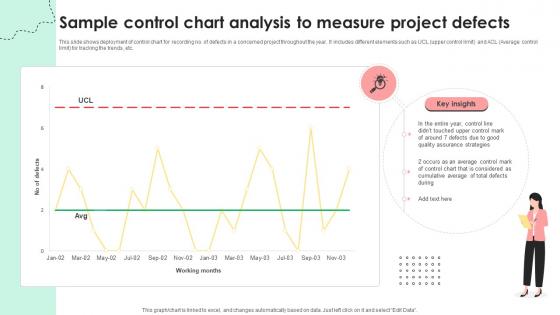
Administering Quality Assurance Sample Control Chart Analysis To Measure Project Defects PM SS V
This slide shows deployment of control chart for recording no. of defects in a concerned project throughout the year. It includes different elements such as UCL upper control limit and ACL Average control limit for tracking the trends, etc. From laying roadmaps to briefing everything in detail, our templates are perfect for you. You can set the stage with your presentation slides. All you have to do is download these easy-to-edit and customizable templates. Administering Quality Assurance Sample Control Chart Analysis To Measure Project Defects PM SS V will help you deliver an outstanding performance that everyone would remember and praise you for. Do download this presentation today. This slide shows deployment of control chart for recording no. of defects in a concerned project throughout the year. It includes different elements such as UCL upper control limit and ACL Average control limit for tracking the trends, etc.
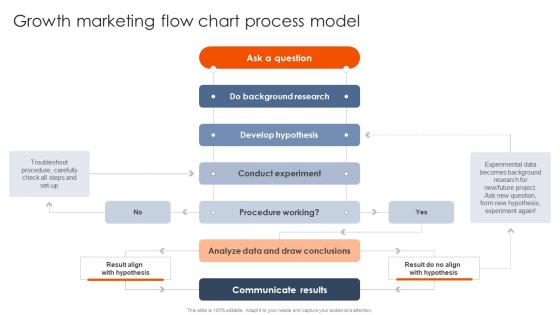
Best Practices For Using Growth Marketing Flow Chart Process Model MKT SS V
Do you have an important presentation coming up Are you looking for something that will make your presentation stand out from the rest Look no further than Best Practices For Using Growth Marketing Flow Chart Process Model MKT SS V. With our professional designs, you can trust that your presentation will pop and make delivering it a smooth process. And with Slidegeeks, you can trust that your presentation will be unique and memorable. So why wait Grab Best Practices For Using Growth Marketing Flow Chart Process Model MKT SS V today and make your presentation stand out from the rest Our Best Practices For Using Growth Marketing Flow Chart Process Model MKT SS V are topically designed to provide an attractive backdrop to any subject. Use them to look like a presentation pro.
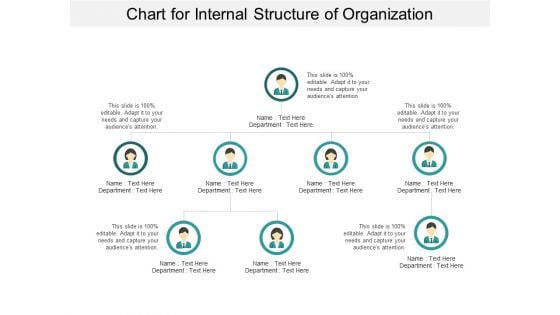
Chart For Internal Structure Of Organization Ppt PowerPoint Presentation Outline Tips
This is a chart for internal structure of organization ppt powerpoint presentation outline tips. This is a three stage process. The stages in this process are flow chart, org chart, hierarchy chart.
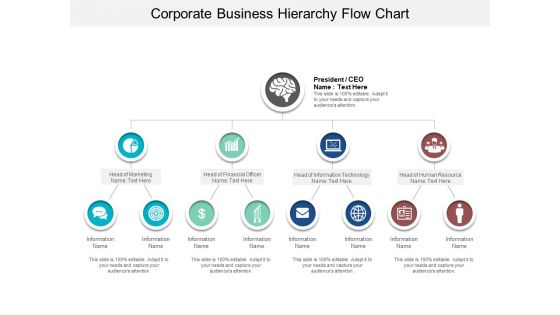
Corporate Business Hierarchy Flow Chart Ppt PowerPoint Presentation File Designs Download
This is a corporate business hierarchy flow chart ppt powerpoint presentation file designs download. This is a four stage process. The stages in this process are flow chart, org chart, hierarchy chart.
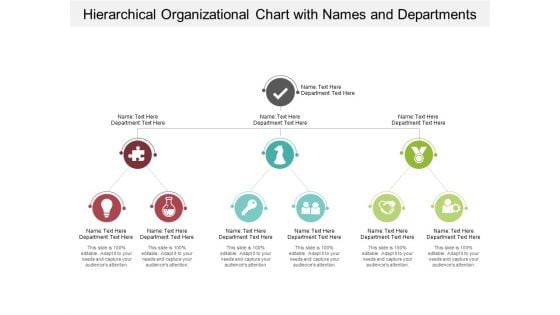
Hierarchical Organizational Chart With Names And Departments Ppt PowerPoint Presentation Infographics Background
This is a hierarchical organizational chart with names and departments ppt powerpoint presentation infographics background. This is a three stage process. The stages in this process are flow chart, org chart, hierarchy chart.
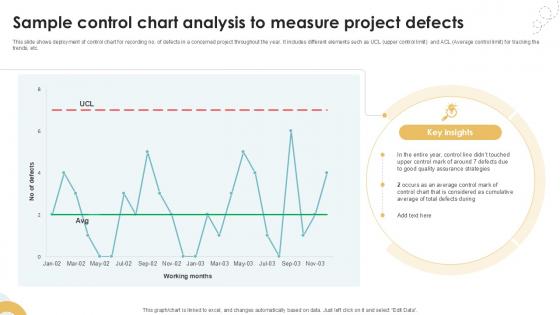
Sample Control Chart Analysis To Measure Project Executing Quality Ppt Sample PM SS V
This slide shows deployment of control chart for recording no. of defects in a concerned project throughout the year. It includes different elements such as UCL upper control limit and ACL Average control limit for tracking the trends, etc. Do you have an important presentation coming up Are you looking for something that will make your presentation stand out from the rest Look no further than Sample Control Chart Analysis To Measure Project Executing Quality Ppt Sample PM SS V. With our professional designs, you can trust that your presentation will pop and make delivering it a smooth process. And with Slidegeeks, you can trust that your presentation will be unique and memorable. So why wait Grab Sample Control Chart Analysis To Measure Project Executing Quality Ppt Sample PM SS V today and make your presentation stand out from the rest This slide shows deployment of control chart for recording no. of defects in a concerned project throughout the year. It includes different elements such as UCL upper control limit and ACL Average control limit for tracking the trends, etc.
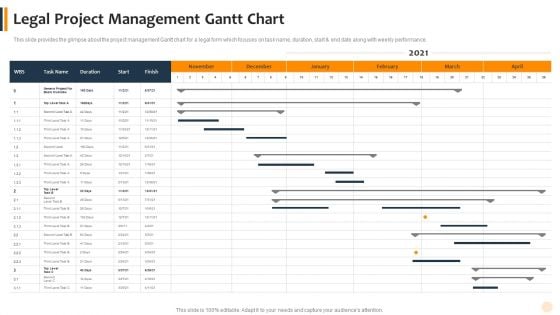
Agile Technique To Lawful Pitch And Proposals IT Legal Project Management Gantt Chart Slides PDF
Design a highly optimized project management report using this well-researched agile technique to lawful pitch and proposals it legal project management gantt chart slides pdf. This layout can be used to present the professional details of a task or activity. Showcase the activities allocated to the business executives with this Gantt Chart PowerPoint theme. List down the column tasks in various timeframes and allocate time for each. In addition, also monitor the actual time and make comparisons to interpret the final progress using this innovative Gantt Chart Template. Showcase the work breakdown structure to attract your audience. Download and share it using Google Slides, if it suits your requirement.

Enterprise Examination And Inspection Management Organizational Chart Ppt Inspiration Show PDF
Presenting enterprise examination and inspection management organizational chart ppt inspiration show pdf to provide visual cues and insights. Share and navigate important information on two stages that need your due attention. This template can be used to pitch topics like marketing, communication, development. In addtion, this PPT design contains high resolution images, graphics, etc, that are easily editable and available for immediate download.
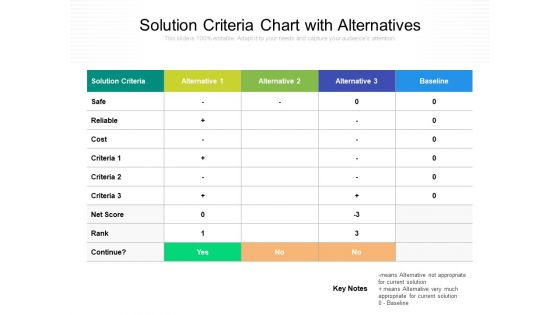
Solution Criteria Chart With Alternatives Ppt PowerPoint Presentation Outline Master Slide PDF
Presenting this set of slides with name solution criteria chart with alternatives ppt powerpoint presentation outline master slide pdf. The topics discussed in these slides are solution criteria, alternative, reliable, cost, net score, rank, continue. This is a completely editable PowerPoint presentation and is available for immediate download. Download now and impress your audience.
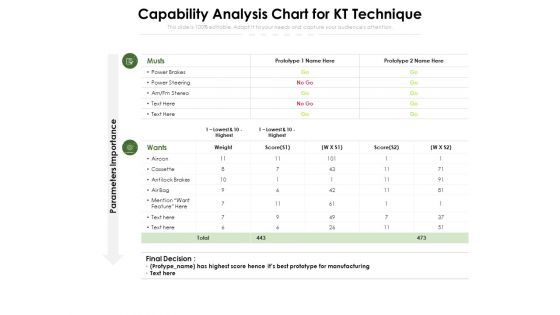
Capability Analysis Chart For KT Technique Ppt PowerPoint Presentation Show Structure PDF
Presenting this set of slides with name capability analysis chart for kt technique ppt powerpoint presentation show structure pdf. The topics discussed in these slides are power brakes, power steering, prototype, score. This is a completely editable PowerPoint presentation and is available for immediate download. Download now and impress your audience.
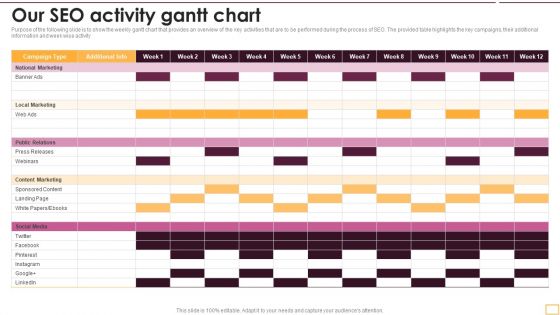
Implementing SEO Strategy To Enhance Business Performance Our SEO Activity Gantt Chart Sample PDF
Purpose of the following slide is to show the weekly gantt chart that provides an overview of the key activities that are to be performed during the process of SEO. The provided table highlights the key campaigns, their additional information and week wise activity. Design a highly optimized project management report using this well-researched Implementing SEO Strategy To Enhance Business Performance Our SEO Activity Gantt Chart Sample PDF. This layout can be used to present the professional details of a task or activity. Showcase the activities allocated to the business executives with this Gantt Chart PowerPoint theme. List down the column tasks in various timeframes and allocate time for each. In addition, also monitor the actual time and make comparisons to interpret the final progress using this innovative Gantt Chart Template. Showcase the work breakdown structure to attract your audience. Download and share it using Google Slides, if it suits your requirement.
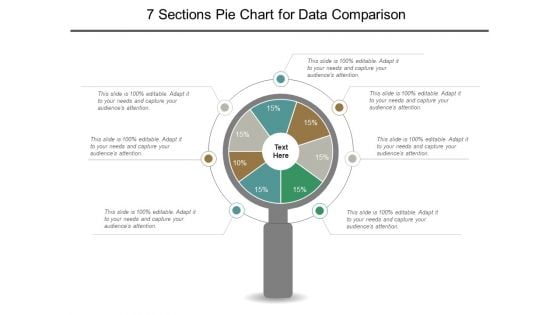
7 Sections Pie Chart For Data Comparison Ppt PowerPoint Presentation File Graphics Template
This is a 7 sections pie chart for data comparison ppt powerpoint presentation file graphics template. This is a seven stage process. The stages in this process are 6 piece pie chart, 6 segment pie chart, 6 parts pie chart.
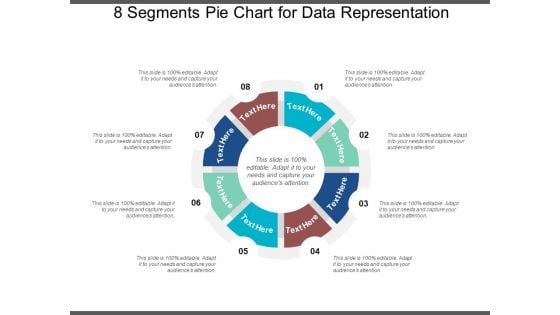
8 Segments Pie Chart For Data Representation Ppt PowerPoint Presentation Infographics Design Templates
This is a 8 segments pie chart for data representation ppt powerpoint presentation infographics design templates. This is a eight stage process. The stages in this process are 6 piece pie chart, 6 segment pie chart, 6 parts pie chart.
6 Segments Pie Chart For Data Representation Ppt PowerPoint Presentation Icon Graphics
This is a 6 segments pie chart for data representation ppt powerpoint presentation icon graphics. This is a six stage process. The stages in this process are 6 piece pie chart, 6 segment pie chart, 6 parts pie chart.
Eight Sections Pie Chart For Percentage Data Analysis Ppt PowerPoint Presentation Styles Icons
This is a eight sections pie chart for percentage data analysis ppt powerpoint presentation styles icons. This is a eight stage process. The stages in this process are 6 piece pie chart, 6 segment pie chart, 6 parts pie chart.
Food Process Tracking With Control Chart Uplift Food Production Company Quality Standards Introduction PDF
The quality team will use control chart as food quality management tool. It will help in determining the food processes are stable and capable under provided conditions. Deliver an awe inspiring pitch with this creative food process tracking with control chart uplift food production company quality standards introduction pdf bundle. Topics like action plan, resources, chart analysis can be discussed with this completely editable template. It is available for immediate download depending on the needs and requirements of the user.
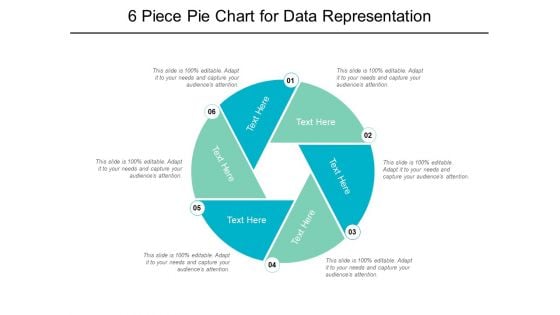
6 Piece Pie Chart For Data Representation Ppt PowerPoint Presentation Professional Brochure
This is a 6 piece pie chart for data representation ppt powerpoint presentation professional brochure. This is a six stage process. The stages in this process are 6 piece pie chart, 6 segment pie chart, 6 parts pie chart.
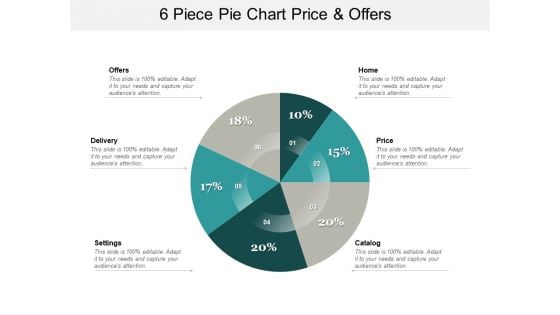
6 Piece Pie Chart Price And Offers Ppt PowerPoint Presentation Ideas Layout
This is a 6 piece pie chart price and offers ppt powerpoint presentation ideas layout. This is a six stage process. The stages in this process are 6 piece pie chart, 6 segment pie chart, 6 parts pie chart.
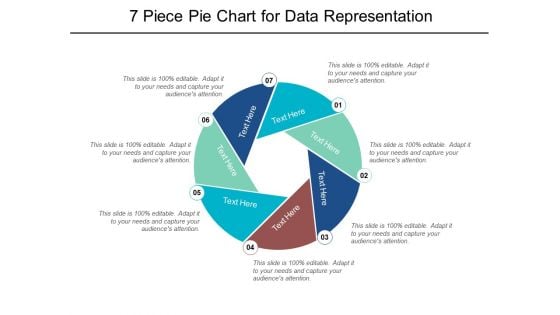
7 Piece Pie Chart For Data Representation Ppt PowerPoint Presentation Portfolio Graphics
This is a 7 piece pie chart for data representation ppt powerpoint presentation portfolio graphics. This is a seven stage process. The stages in this process are 6 piece pie chart, 6 segment pie chart, 6 parts pie chart.
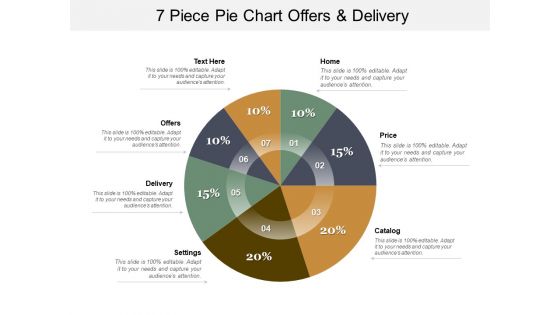
7 Piece Pie Chart Offers And Delivery Ppt PowerPoint Presentation Infographics Samples
This is a 7 piece pie chart offers and delivery ppt powerpoint presentation infographics samples. This is a seven stage process. The stages in this process are 6 piece pie chart, 6 segment pie chart, 6 parts pie chart.
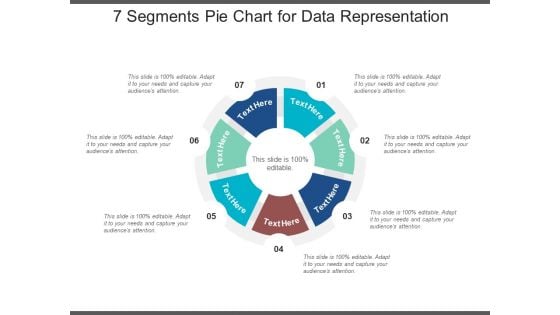
7 Segments Pie Chart For Data Representation Ppt PowerPoint Presentation Styles Summary
This is a 7 segments pie chart for data representation ppt powerpoint presentation styles summary. This is a seven stage process. The stages in this process are 6 piece pie chart, 6 segment pie chart, 6 parts pie chart.
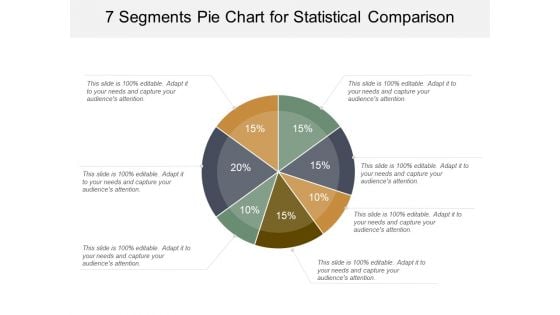
7 Segments Pie Chart For Statistical Comparison Ppt PowerPoint Presentation Gallery Visual Aids
This is a 7 segments pie chart for statistical comparison ppt powerpoint presentation gallery visual aids. This is a seven stage process. The stages in this process are 6 piece pie chart, 6 segment pie chart, 6 parts pie chart.
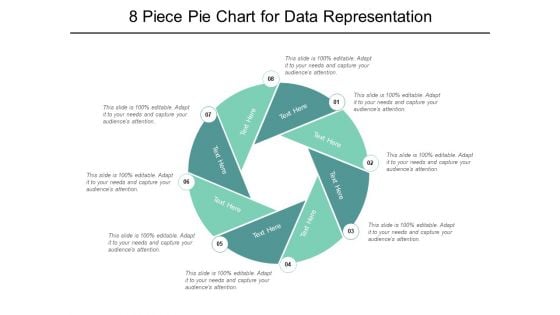
8 Piece Pie Chart For Data Representation Ppt PowerPoint Presentation Ideas
This is a 8 piece pie chart for data representation ppt powerpoint presentation ideas. This is a eight stage process. The stages in this process are 6 piece pie chart, 6 segment pie chart, 6 parts pie chart.

8 Piece Pie Chart Price Offers And Delivery Ppt PowerPoint Presentation Layouts Skills
This is a 8 piece pie chart price offers and delivery ppt powerpoint presentation layouts skills. This is a eight stage process. The stages in this process are 6 piece pie chart, 6 segment pie chart, 6 parts pie chart.
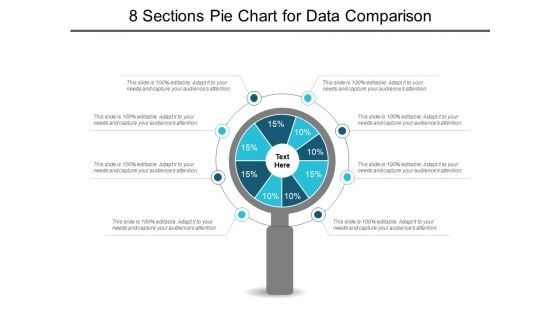
8 Sections Pie Chart For Data Comparison Ppt PowerPoint Presentation Show Slideshow
This is a 8 sections pie chart for data comparison ppt powerpoint presentation show slideshow. This is a eight stage process. The stages in this process are 6 piece pie chart, 6 segment pie chart, 6 parts pie chart.
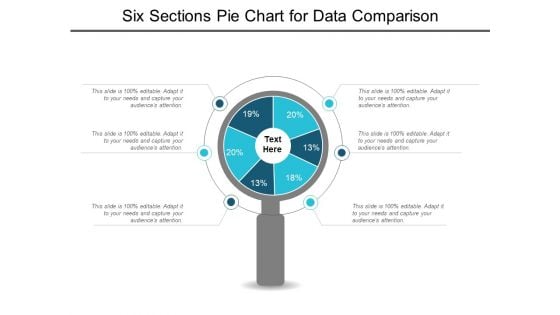
Six Sections Pie Chart For Data Comparison Ppt PowerPoint Presentation Styles Graphics Example
This is a six sections pie chart for data comparison ppt powerpoint presentation styles graphics example. This is a six stage process. The stages in this process are 6 piece pie chart, 6 segment pie chart, 6 parts pie chart.
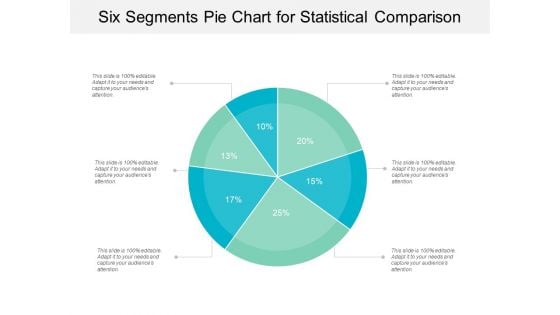
Six Segments Pie Chart For Statistical Comparison Ppt PowerPoint Presentation Gallery Background
This is a six segments pie chart for statistical comparison ppt powerpoint presentation gallery background. This is a six stage process. The stages in this process are 6 piece pie chart, 6 segment pie chart, 6 parts pie chart.
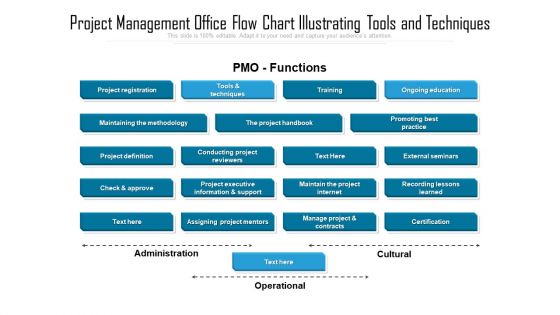
Project Management Office Flow Chart Illustrating Tools And Techniques Slides PDF
Presenting project management office flow chart illustrating tools and techniques slides pdf to dispense important information. This template comprises one stage. It also presents valuable insights into the topics including promoting best practice, project executive information, project internet. This is a completely customizable PowerPoint theme that can be put to use immediately. So, download it and address the topic impactfully.
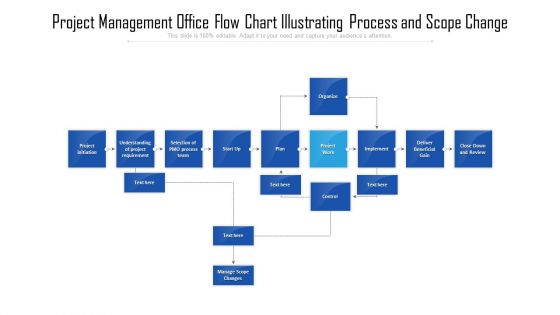
Project Management Office Flow Chart Illustrating Process And Scope Change Information PDF
Presenting project management office flow chart illustrating process and scope change information pdf to dispense important information. This template comprises one stage. It also presents valuable insights into the topics including process team, project requirement, project initiation. This is a completely customizable PowerPoint theme that can be put to use immediately. So, download it and address the topic impactfully.
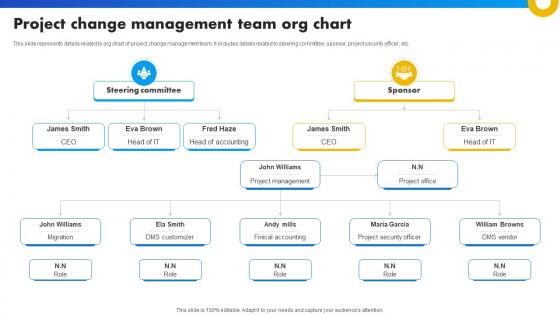
Project Change Management Team Org Chart Strategies For Success In Digital
This slide represents details related to org chart of project change management team. It includes details related to steering committee, sponsor, project security officer, etc. Presenting this PowerPoint presentation, titled Project Change Management Team Org Chart Strategies For Success In Digital, with topics curated by our researchers after extensive research. This editable presentation is available for immediate download and provides attractive features when used. Download now and captivate your audience. Presenting this Project Change Management Team Org Chart Strategies For Success In Digital. Our researchers have carefully researched and created these slides with all aspects taken into consideration. This is a completely customizable Project Change Management Team Org Chart Strategies For Success In Digital that is available for immediate downloading. Download now and make an impact on your audience. Highlight the attractive features available with our PPTs. This slide represents details related to org chart of project change management team. It includes details related to steering committee, sponsor, project security officer, etc.
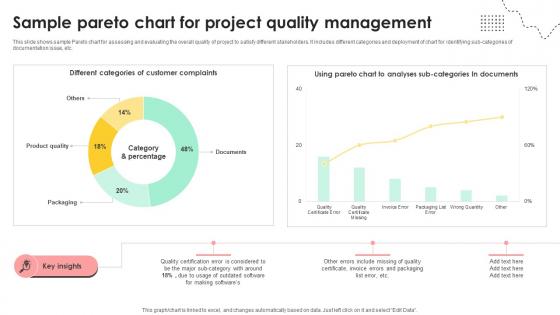
Administering Quality Assurance Sample Pareto Chart For Project Quality Management PM SS V
This slide shows sample Pareto chart for assessing and evaluating the overall quality of project to satisfy different stakeholders. It includes different categories and deployment of chart for identifying sub-categories of documentation issue, etc. Slidegeeks is here to make your presentations a breeze with Administering Quality Assurance Sample Pareto Chart For Project Quality Management PM SS V With our easy-to-use and customizable templates, you can focus on delivering your ideas rather than worrying about formatting. With a variety of designs to choose from, you are sure to find one that suits your needs. And with animations and unique photos, illustrations, and fonts, you can make your presentation pop. So whether you are giving a sales pitch or presenting to the board, make sure to check out Slidegeeks first This slide shows sample Pareto chart for assessing and evaluating the overall quality of project to satisfy different stakeholders. It includes different categories and deployment of chart for identifying sub-categories of documentation issue, etc.
Histogram Column Chart With Red Arrow Vector Icon Ppt PowerPoint Presentation Outline Ideas Cpb
This is a histogram column chart with red arrow vector icon ppt powerpoint presentation outline ideas cpb. This is a three stage process. The stages in this process are bar chart icon, bar graph icon, data chart icon.
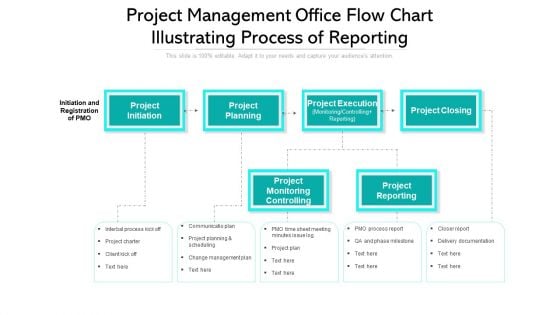
Project Management Office Flow Chart Illustrating Process Of Reporting Designs PDF
Persuade your audience using this project management office flow chart illustrating process of reporting designs pdf. This PPT design covers six stages, thus making it a great tool to use. It also caters to a variety of topics including project initiation, project planning, project monitoring controlling, project reporting. Download this PPT design now to present a convincing pitch that not only emphasizes the topic but also showcases your presentation skills.
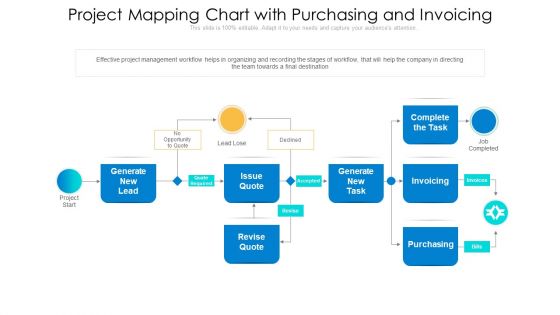
Project Mapping Chart With Purchasing And Invoicing Ppt Inspiration Smartart PDF
Showcasing this set of slides titled project mapping chart with purchasing and invoicing ppt inspiration smartart pdf. The topics addressed in these templates are opportunity, project management workflow, team. All the content presented in this PPT design is completely editable. Download it and make adjustments in color, background, font etc. as per your unique business setting.


 Continue with Email

 Home
Home


