Service Icons
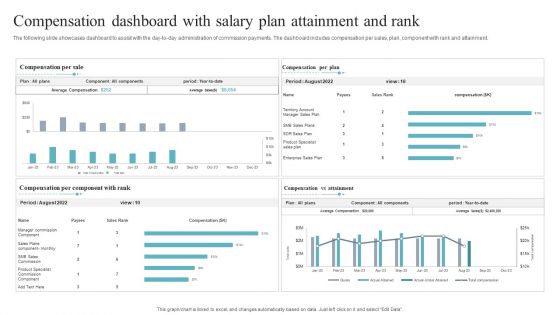
Compensation Dashboard With Salary Plan Attainment And Rank Slides PDF
The following slide showcases dashboard to assist with the day to day administration of commission payments. The dashboard includes compensation per sales, plan, component with rank and attainment. Pitch your topic with ease and precision using this Compensation Dashboard With Salary Plan Attainment And Rank Slides PDF. This layout presents information on Salary Plan Attainment Rank, Compensation Dashboard. It is also available for immediate download and adjustment. So, changes can be made in the color, design, graphics or any other component to create a unique layout.
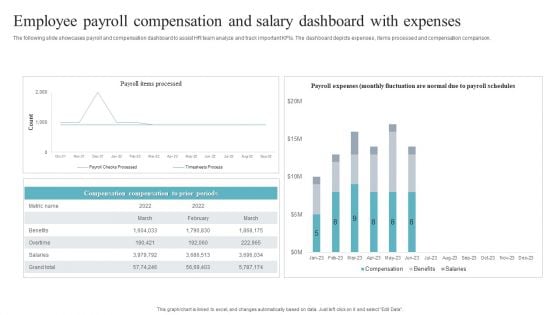
Employee Payroll Compensation And Salary Dashboard With Expenses Professional PDF
The following slide showcases payroll and compensation dashboard to assist HR team analyze and track important KPIs. The dashboard depicts expenses , items processed and compensation comparison. Showcasing this set of slides titled Employee Payroll Compensation And Salary Dashboard With Expenses Professional PDF. The topics addressed in these templates are Employee Payroll Compensation, Salary Dashboard With Expenses. All the content presented in this PPT design is completely editable. Download it and make adjustments in color, background, font etc. as per your unique business setting.
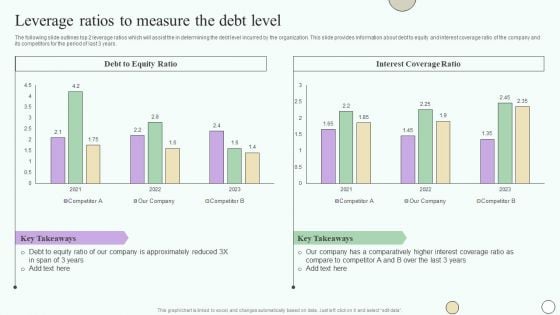
Estimating Business Overall Leverage Ratios To Measure The Debt Level Professional PDF
The following slide outlines top 2 leverage ratios which will assist the in determining the debt level incurred by the organization. This slide provides information about debt to equity and interest coverage ratio of the company and its competitors for the period of last 3 years. If your project calls for a presentation, then Slidegeeks is your go-to partner because we have professionally designed, easy-to-edit templates that are perfect for any presentation. After downloading, you can easily edit Estimating Business Overall Leverage Ratios To Measure The Debt Level Professional PDF and make the changes accordingly. You can rearrange slides or fill them with different images. Check out all the handy templates.
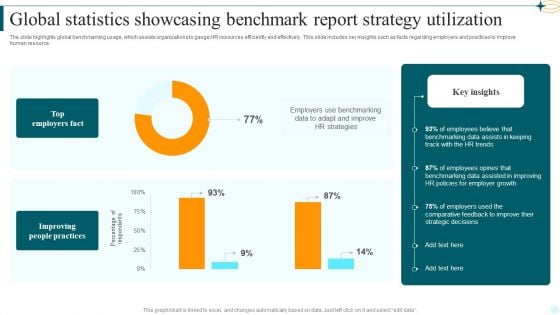
Global Statistics Showcasing Benchmark Report Strategy Utilization Mockup PDF
The slide highlights global benchmarking usage, which assists organizations to gauge HR resources efficiently and effectively. This slide includes key insights such as facts regarding employers and practices to improve human resource. Showcasing this set of slides titled Global Statistics Showcasing Benchmark Report Strategy Utilization Mockup PDF. The topics addressed in these templates are Top Employers Fact, Improving People Practices, Employers Use Benchmarking. All the content presented in this PPT design is completely editable. Download it and make adjustments in color, background, font etc. as per your unique business setting.
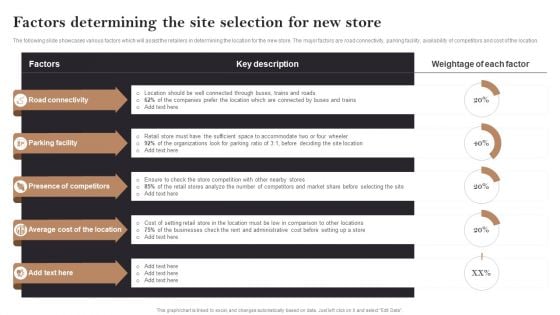
Factors Determining The Site Selection For New Store Opening Retail Store In Untapped Summary PDF
The following slide showcases various factors which will assist the retailers in determining the location for the new store. The major factors are road connectivity, parking facility, availability of competitors and cost of the location. The best PPT templates are a great way to save time, energy, and resources. Slidegeeks have 100 precent editable powerpoint slides making them incredibly versatile. With these quality presentation templates, you can create a captivating and memorable presentation by combining visually appealing slides and effectively communicating your message. Download Factors Determining The Site Selection For New Store Opening Retail Store In Untapped Summary PDF from Slidegeeks and deliver a wonderful presentation.

KPI Dashboard Highlighting Marketing Campaign Results Mockup PDF
The purpose of this slide is to highlight a comprehensive dashboard which can assist the organization to evaluate the marketing campaign results. The dashboard covers information about sales performance, product performance, ecommerce conversion rate, etc. Showcasing this set of slides titled KPI Dashboard Highlighting Marketing Campaign Results Mockup PDF. The topics addressed in these templates are Sales Performance, Product Performance Analysis. All the content presented in this PPT design is completely editable. Download it and make adjustments in color, background, font etc. as per your unique business setting.
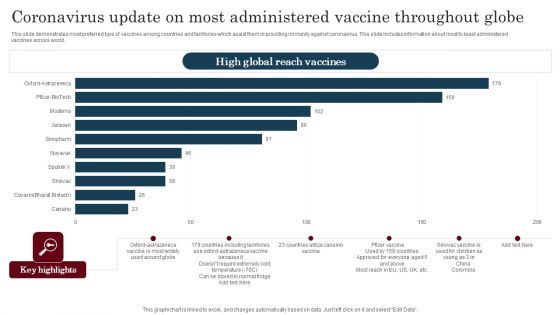
Coronavirus Update On Most Administered Vaccine Throughout Globe Mockup PDF
This slide demonstrates most preferred type of vaccines among countries and territories which assist them in providing immunity against coronavirus. This slide includes information about most to least administered vaccines across world. Pitch your topic with ease and precision using this Coronavirus Update On Most Administered Vaccine Throughout Globe Mockup PDF. This layout presents information on Coronavirus Update, Most Administered Vaccine. It is also available for immediate download and adjustment. So, changes can be made in the color, design, graphics or any other component to create a unique layout.
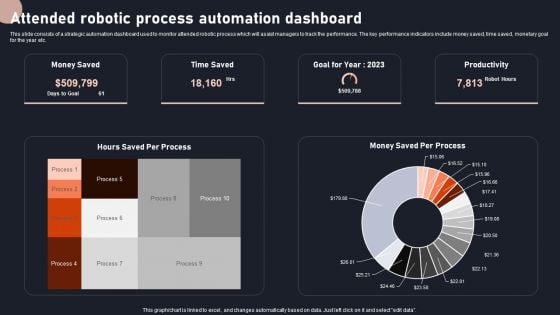
Attended Robotic Process Automation Dashboard Rules PDF
This slide consists of a strategic automation dashboard used to monitor attended robotic process which will assist managers to track the performance. The key performance indicators include money saved, time saved, monetary goal for the year etc. Showcasing this set of slides titled Attended Robotic Process Automation Dashboard Rules PDF. The topics addressed in these templates are Productivity, Goal, Process Automation Dashboard. All the content presented in this PPT design is completely editable. Download it and make adjustments in color, background, font etc. as per your unique business setting.
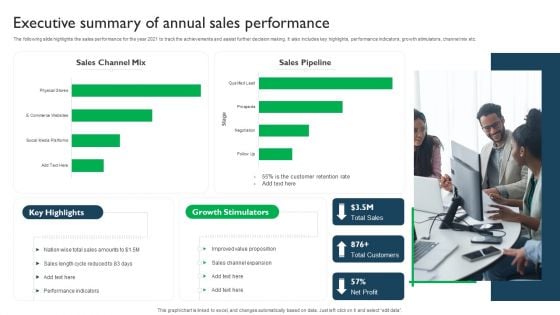
Executive Summary Of Annual Sales Performance Topics PDF
The following slide highlights the sales performance for the year 2021 to track the achievements and assist further decision making. It also includes key highlights, performance indicators, growth stimulators, channel mix etc. Pitch your topic with ease and precision using this Executive Summary Of Annual Sales Performance Topics PDF. This layout presents information on Growth Stimulators, Sales, Value Proposition. It is also available for immediate download and adjustment. So, changes can be made in the color, design, graphics or any other component to create a unique layout.
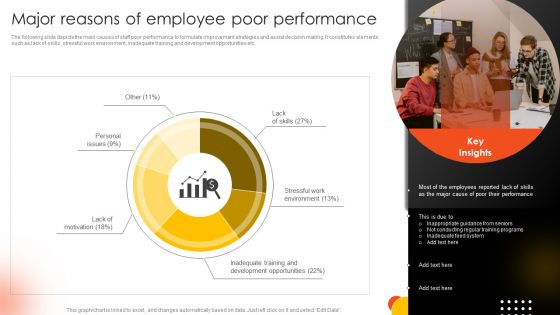
Effective Staff Performance Optimization Techniques Major Reasons Of Employee Poor Performance Slides PDF
The following slide depicts the main causes of staff poor performance to formulate improvement strategies and assist decision making. It constitutes elements such as lack of skills, stressful work environment, inadequate training and development opportunities etc. There are so many reasons you need a Effective Staff Performance Optimization Techniques Major Reasons Of Employee Poor Performance Slides PDF. The first reason is you can not spend time making everything from scratch, Thus, Slidegeeks has made presentation templates for you too. You can easily download these templates from our website easily.
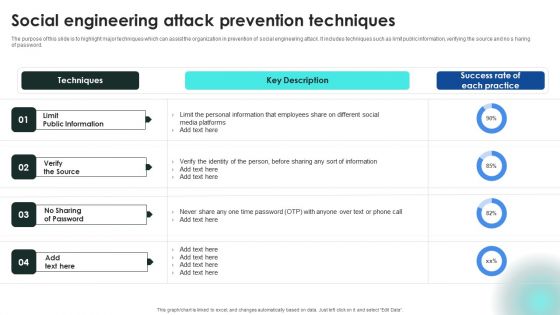
Implementing Cybersecurity Awareness Program To Prevent Attacks Social Engineering Attack Prevention Techniques Topics PDF
The purpose of this slide is to highlight major techniques which can assist the organization in prevention of social engineering attack. It includes techniques such as limit public information, verifying the source and no s haring of password. There are so many reasons you need a Implementing Cybersecurity Awareness Program To Prevent Attacks Social Engineering Attack Prevention Techniques Topics PDF. The first reason is you cannot spend time making everything from scratch, Thus, Slidegeeks has made presentation templates for you too. You can easily download these templates from our website easily.
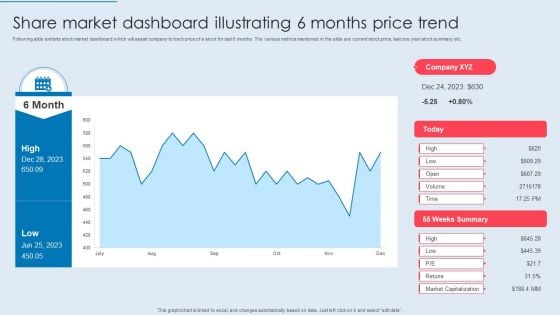
Share Market Dashboard Illustrating 6 Months Price Trend Ideas PDF
Following slide exhibits stock market dashboard which will assist company to track price of a stock for last 6 months. The various metrics mentioned in the slide are current stock price, last one year stock summary etc. Showcasing this set of slides titled Share Market Dashboard Illustrating 6 Months Price Trend Ideas PDF. The topics addressed in these templates are Share Market, Dashboard Illustrating, Months Price Trend. All the content presented in this PPT design is completely editable. Download it and make adjustments in color, background, font etc. as per your unique business setting.
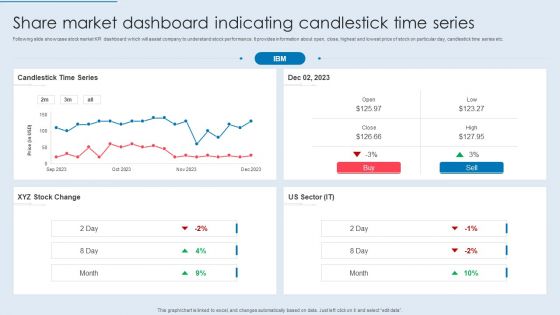
Share Market Dashboard Indicating Candlestick Time Series Formats PDF
Following slide showcase stock market KPI dashboard which will assist company to understand stock performance. It provides information about open, close, highest and lowest price of stock on particular day, candlestick time series etc. Pitch your topic with ease and precision using this Share Market Dashboard Indicating Candlestick Time Series Formats PDF. This layout presents information on Candlestick Time Series, Stock Change, US Sector. It is also available for immediate download and adjustment. So, changes can be made in the color, design, graphics or any other component to create a unique layout.
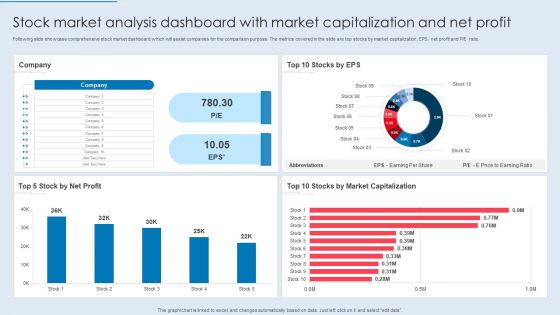
Stock Market Analysis Dashboard With Market Capitalization And Net Profit Elements PDF
Following slide showcase comprehensive stock market dashboard which will assist companies for the comparison purpose. The metrics covered in the slide are top stocks by market capitalization, EPS, net profit and PE ratio. Pitch your topic with ease and precision using this Stock Market Analysis Dashboard With Market Capitalization And Net Profit Elements PDF. This layout presents information on Company, Net Profit, Market Capitalization. It is also available for immediate download and adjustment. So, changes can be made in the color, design, graphics or any other component to create a unique layout.
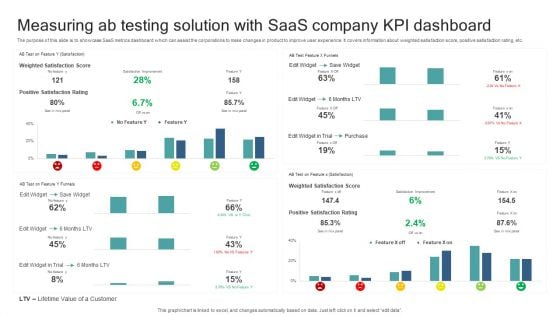
Measuring Ab Testing Solution With Saas Company KPI Dashboard Guidelines PDF
The purpose of this slide is to showcase SaaS metrics dashboard which can assist the corporations to make changes in product to improve user experience. It covers information about weighted satisfaction score, positive satisfaction rating, etc. Pitch your topic with ease and precision using this Measuring Ab Testing Solution With Saas Company KPI Dashboard Guidelines PDF. This layout presents information on Lifetime Value Customer, Positive Satisfaction Rating, Save Widget, Weighted Satisfaction Score. It is also available for immediate download and adjustment. So, changes can be made in the color, design, graphics or any other component to create a unique layout.
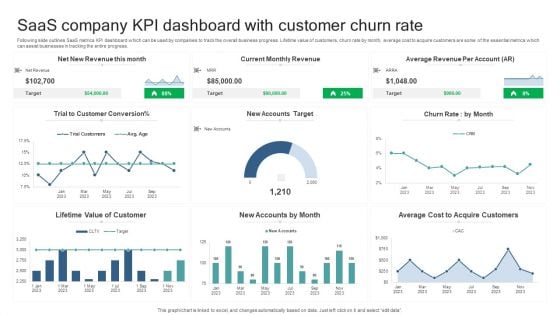
Saas Company KPI Dashboard With Customer Churn Rate Microsoft PDF
Following slide outlines SaaS metrics KPI dashboard which can be used by companies to track the overall business progress. Lifetime value of customers, churn rate by month, average cost to acquire customers are some of the essential metrics which can assist businesses in tracking the entire progress. Pitch your topic with ease and precision using this Saas Company KPI Dashboard With Customer Churn Rate Microsoft PDF. This layout presents information on Lifetime Value Of Customer, New Accounts By Month, Average Cost Acquire Customers. It is also available for immediate download and adjustment. So, changes can be made in the color, design, graphics or any other component to create a unique layout.
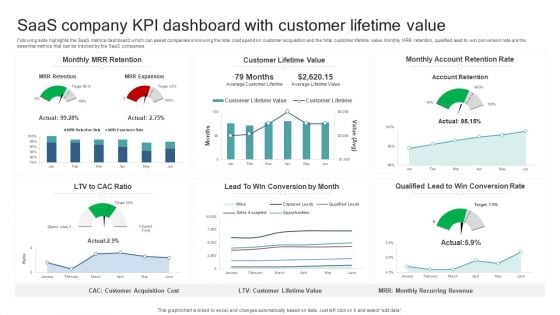
Saas Company KPI Dashboard With Customer Lifetime Value Professional PDF
Following slide highlights the SaaS metrics dashboard which can assist companies in knowing the total cost spend on customer acquisition and the total customer lifetime value. Monthly MRR retention, qualified lead to win conversion rate are the essential metrics that can be tracked by the SaaS companies. Showcasing this set of slides titled Saas Company KPI Dashboard With Customer Lifetime Value Professional PDF. The topics addressed in these templates are Monthly Mrr Retention, Customer Lifetime Value, Monthly Account Retention Rate. All the content presented in this PPT design is completely editable. Download it and make adjustments in color, background, font etc. as per your unique business setting.
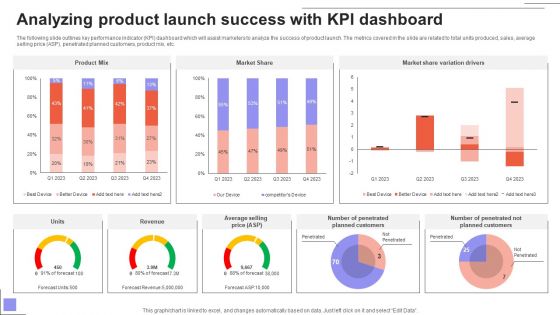
Overview Of The Food Analyzing Product Launch Success With KPI Dashboard Mockup PDF
The following slide outlines key performance indicator KPI dashboard which will assist marketers to analyze the success of product launch. The metrics covered in the slide are related to total units produced, sales, average selling price ASP, penetrated planned customers, product mix, etc. Find a pre-designed and impeccable Overview Of The Food Analyzing Product Launch Success With KPI Dashboard Mockup PDF. The templates can ace your presentation without additional effort. You can download these easy-to-edit presentation templates to make your presentation stand out from others. So, what are you waiting for Download the template from Slidegeeks today and give a unique touch to your presentation.
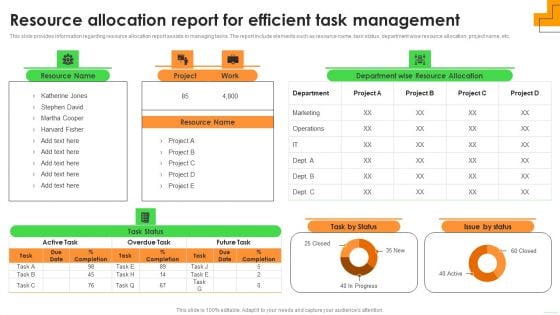
Resource Allocation Report For Efficient Task Management Guidelines PDF
This slide provides information regarding resource allocation report assists in managing tasks. The report include elements such as resource name, task status, department wise resource allocation, project name, etc. If your project calls for a presentation, then Slidegeeks is your go-to partner because we have professionally designed, easy-to-edit templates that are perfect for any presentation. After downloading, you can easily edit Resource Allocation Report For Efficient Task Management Guidelines PDF and make the changes accordingly. You can rearrange slides or fill them with different images. Check out all the handy templates
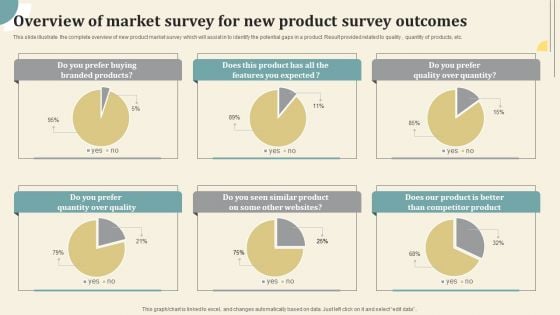
Overview Of Market Survey For New Product Survey Outcomes Survey SS
This slide illustrate the complete overview of new product market survey which will assist in to identify the potential gaps in a product. Result provided related to quality , quantity of products, etc. Pitch your topic with ease and precision using this Overview Of Market Survey For New Product Survey Outcomes Survey SS. This layout presents information on Overview Of Market Survey, Product Survey Outcomes . It is also available for immediate download and adjustment. So, changes can be made in the color, design, graphics or any other component to create a unique layout.
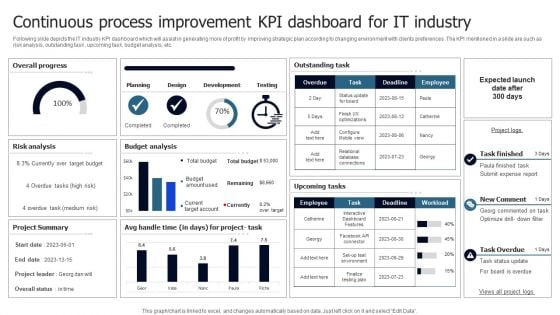
Continuous Process Improvement KPI Dashboard For IT Industry Clipart PDF
Following slide depicts the IT industry KPI dashboard which will assist in generating more of profit by improving strategic plan according to changing environment with clients preferences .The KPI mentioned in a slide are such as risk analysis, outstanding task , upcoming task, budget analysis, etc. Pitch your topic with ease and precision using this Continuous Process Improvement KPI Dashboard For IT Industry Clipart PDF. This layout presents information on Overall Progress, Risk Analysis, Budget Analysis. It is also available for immediate download and adjustment. So, changes can be made in the color, design, graphics or any other component to create a unique layout.
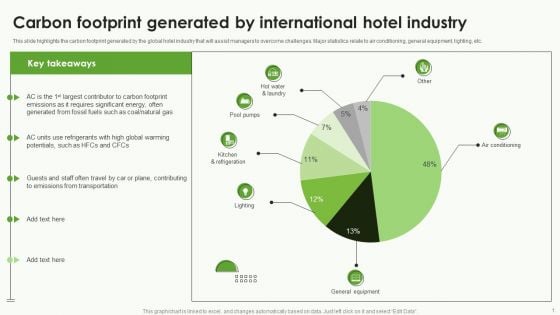
Carbon Footprint Generated By International Hotel Industry Ideas PDF
This slide highlights the carbon footprint generated by the global hotel industry that will assist managers to overcome challenges. Major statistics relate to air conditioning, general equipment, lighting, etc. Showcasing this set of slides titled Carbon Footprint Generated By International Hotel Industry Ideas PDF. The topics addressed in these templates are Hot Water Laundry, Pool Pumps, Kitchen Refrigeration. All the content presented in this PPT design is completely editable. Download it and make adjustments in color, background, font etc. as per your unique business setting.
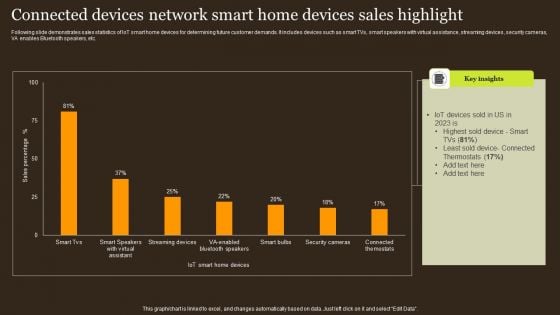
Connected Devices Network Smart Home Devices Sales Highlight Structure PDF
Following slide demonstrates sales statistics of IoT smart home devices for determining future customer demands. It includes devices such as smart TVs, smart speakers with virtual assistance, streaming devices, security cameras, VA enables Bluetooth speakers, etc. Showcasing this set of slides titled Connected Devices Network Smart Home Devices Sales Highlight Structure PDF. The topics addressed in these templates are Iot Devices, Least Sold Device, Thermostats. All the content presented in this PPT design is completely editable. Download it and make adjustments in color, background, font etc. as per your unique business setting.
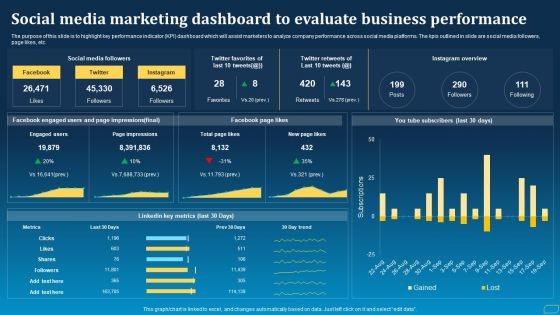
Direct Marketing Techniques To Enhance Business Presence Social Media Marketing Dashboard To Evaluate Rules PDF
The purpose of this slide is to highlight key performance indicator KPI dashboard which will assist marketers to analyze company performance across social media platforms. The kpis outlined in slide are social media followers, page likes, etc. Make sure to capture your audiences attention in your business displays with our gratis customizable Direct Marketing Techniques To Enhance Business Presence Social Media Marketing Dashboard To Evaluate Rules PDF. These are great for business strategies, office conferences, capital raising or task suggestions. If you desire to acquire more customers for your tech business and ensure they stay satisfied, create your own sales presentation with these plain slides.
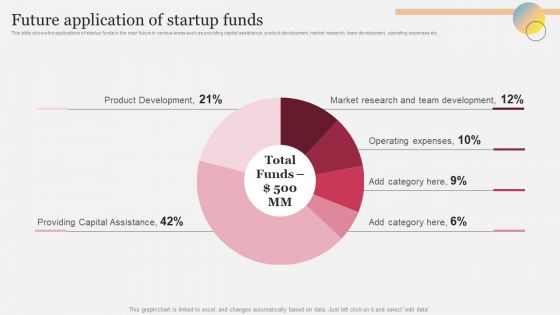
Future Application Of Startup Funds Ppt Model Format Ideas PDF
This slide shows the applications of startup funds in the near future in various areas such as providing capital assistance, product development, market research, team development, operating expenses etc. Make sure to capture your audiences attention in your business displays with our gratis customizable Future Application Of Startup Funds Ppt Model Format Ideas PDF. These are great for business strategies, office conferences, capital raising or task suggestions. If you desire to acquire more customers for your tech business and ensure they stay satisfied, create your own sales presentation with these plain slides.
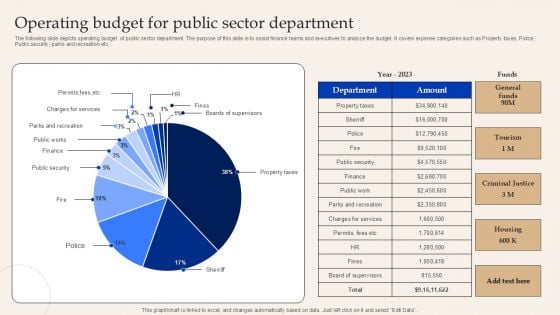
Operating Budget For Public Sector Department Designs PDF
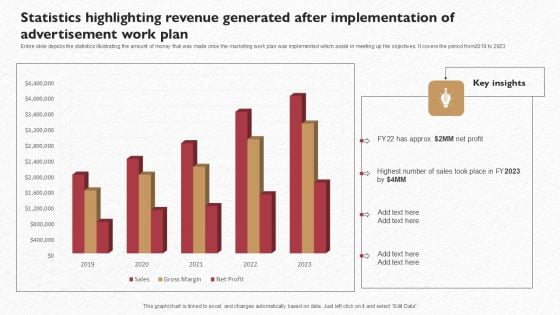
Statistics Highlighting Revenue Generated After Implementation Of Advertisement Work Plan Professional PDF
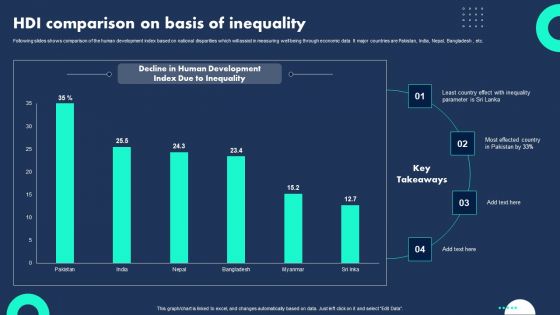
HDI Comparison On Basis Of Inequality Infographics PDF
Following slides shows comparison of the human development index based on national disparities which will assist in measuring well being through economic data It major countries are Pakistan, India, Nepal, Bangladesh , etc. Showcasing this set of slides titled HDI Comparison On Basis Of Inequality Infographics PDF. The topics addressed in these templates are Country Effect, Most Effected Country, Human Development. All the content presented in this PPT design is completely editable. Download it and make adjustments in color, background, font etc. as per your unique business setting.
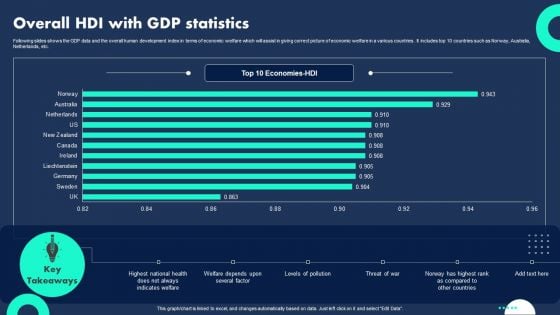
Overall HDI With Gdp Statistics Professional PDF
Following slides shows the GDP data and the overall human development index in terms of economic welfare which will assist in giving correct picture of economic welfare in a various countries . It includes top 10 countries such as Norway, Australia, Netherlands, etc. Showcasing this set of slides titled Overall HDI With Gdp Statistics Professional PDF. The topics addressed in these templates are Indicates Welfare, Welfare Depends, Levels Pollution. All the content presented in this PPT design is completely editable. Download it and make adjustments in color, background, font etc. as per your unique business setting.
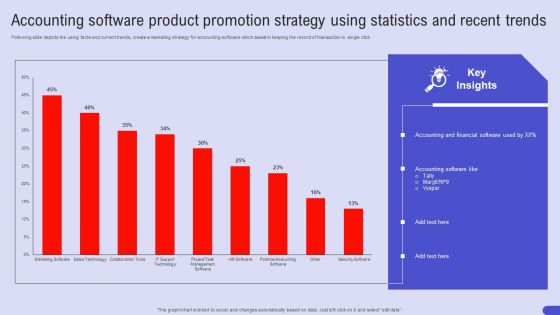
Accounting Software Product Promotion Strategy Using Statistics And Recent Trends Sample PDF
Following slide depicts the using facts and current trends, create a marketing strategy for accounting software which assist in keeping the record of transaction in single click. Pitch your topic with ease and precision using this Accounting Software Product Promotion Strategy Using Statistics And Recent Trends Sample PDF. This layout presents information on Accounting Software Product, Promotion Strategy, Statistics And Recent Trends. It is also available for immediate download and adjustment. So, changes can be made in the color, design, graphics or any other component to create a unique layout.
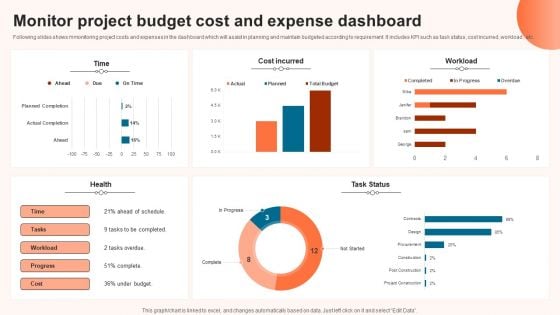
Monitor Project Budget Cost And Expense Dashboard Brochure PDF
Following slides shows mmonitoring project costs and expenses in the dashboard which will assist in planning and maintain budgeted according to requirement. It includes KPI such as task status, cost incurred ,workload , etc. Pitch your topic with ease and precision using this Monitor Project Budget Cost And Expense Dashboard Brochure PDF. This layout presents information on Expense Dashboard, Monitor Project Budget Cost. It is also available for immediate download and adjustment. So, changes can be made in the color, design, graphics or any other component to create a unique layout.
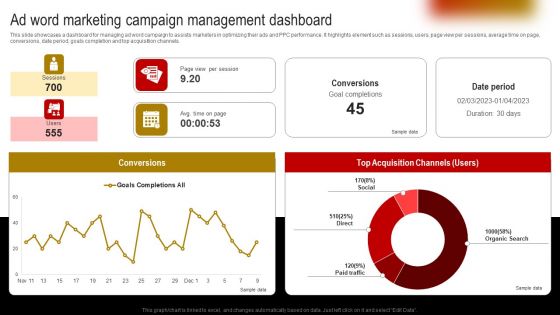
Ad Word Marketing Campaign Management Dashboard Designs PDF
This slide showcases a dashboard for managing ad word campaign to assists marketers in optimizing their ads and PPC performance. It highlights element such as sessions, users, page view per sessions, average time on page, conversions, date period, goals completion and top acquisition channels. Find a pre designed and impeccable Ad Word Marketing Campaign Management Dashboard Designs PDF. The templates can ace your presentation without additional effort. You can download these easy to edit presentation templates to make your presentation stand out from others. So, what are you waiting for Download the template from Slidegeeks today and give a unique touch to your presentation.
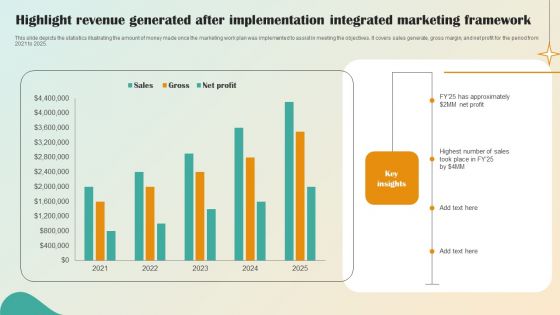
Highlight Revenue Generated After Implementation Integrated Marketing Framework Professional PDF
This slide depicts the statistics illustrating the amount of money made once the marketing work plan was implemented to assist in meeting the objectives. It covers sales generate, gross margin, and net profit for the period from 2021 to 2025.Showcasing this set of slides titled Highlight Revenue Generated After Implementation Integrated Marketing Framework Professional PDF. The topics addressed in these templates are Highest Number, Sales Took. All the content presented in this PPT design is completely editable. Download it and make adjustments in color, background, font etc. as per your unique business setting.
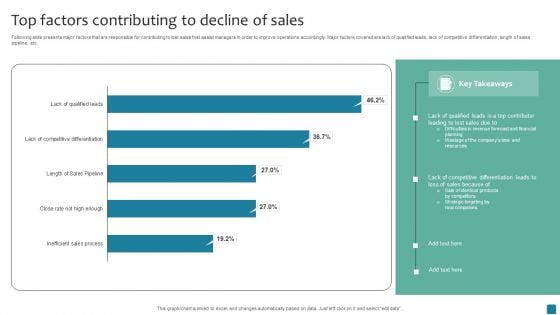
Top Factors Contributing To Decline Of Sales Demonstration PDF
Following slide presents major factors that are responsible for contributing to lost sales that assist managers in order to improve operations accordingly. Major factors covered are lack of qualified leads, lack of competitive differentiation, length of sales pipeline, etc. Showcasing this set of slides titled Top Factors Contributing To Decline Of Sales Demonstration PDF. The topics addressed in these templates are Top Factors Contributing, Decline Of Sales. All the content presented in this PPT design is completely editable. Download it and make adjustments in color, background, font etc. as per your unique business setting.
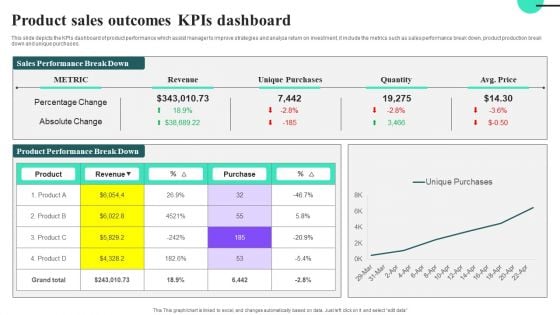
Product Sales Outcomes Kpis Dashboard Ideas PDF
This slide depicts the KPIs dashboard of product performance which assist manager to improve strategies and analyze return on investment, it include the metrics such as sales performance break down, product production break down and unique purchases.Showcasing this set of slides titled Product Sales Outcomes Kpis Dashboard Ideas PDF. The topics addressed in these templates are Percentage Change, Absolute Change. All the content presented in this PPT design is completely editable. Download it and make adjustments in color, background, font etc. as per your unique business setting.
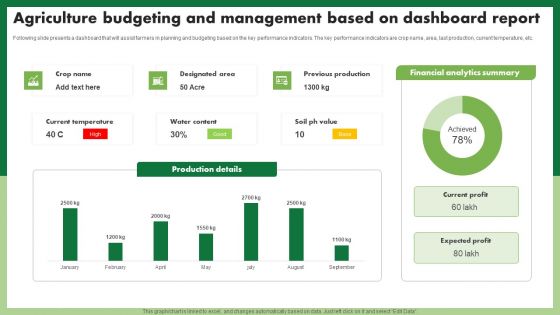
Agriculture Budgeting And Management Based On Dashboard Report Topics PDF
Following slide presents a dashboard that will assist farmers in planning and budgeting based on the key performance indicators. The key performance indicators are crop name, area, last production, current temperature, etc. Showcasing this set of slides titled Agriculture Budgeting And Management Based On Dashboard Report Topics PDF. The topics addressed in these templates are Production Details. All the content presented in this PPT design is completely editable. Download it and make adjustments in color, background, font etc. as per your unique business setting.
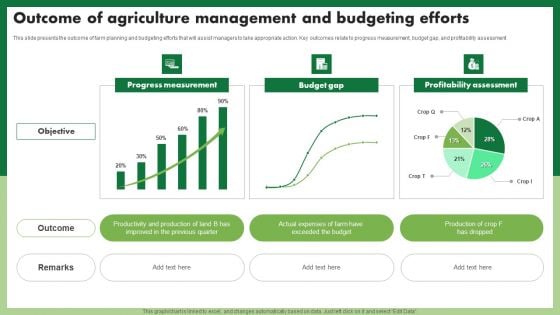
Outcome Of Agriculture Management And Budgeting Efforts Professional PDF
This slide presents the outcome of farm planning and budgeting efforts that will assist managers to take appropriate action. Key outcomes relate to progress measurement, budget gap, and profitability assessment. Showcasing this set of slides titled Outcome Of Agriculture Management And Budgeting Efforts Professional PDF. The topics addressed in these templates are Progress Measurement, Budget Gap, Profitability Assessment. All the content presented in this PPT design is completely editable. Download it and make adjustments in color, background, font etc. as per your unique business setting.
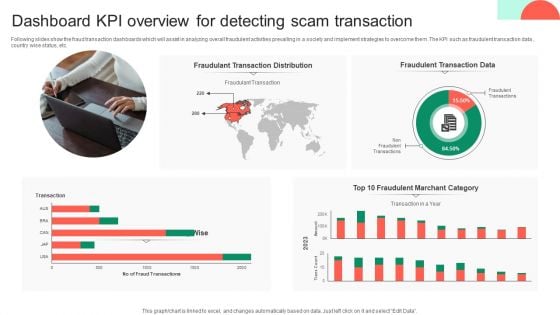
Dashboard KPI Overview For Detecting Scam Transaction Microsoft PDF
Following slides show the fraud transaction dashboards which will assist in analyzing overall fraudulent activities prevailing in a society and implement strategies to overcome them .The KPI such as fraudulent transaction data , country wise status, etc. Showcasing this set of slides titled Dashboard KPI Overview For Detecting Scam Transaction Microsoft PDF. The topics addressed in these templates are Fraudulant Transaction Distribution, Fraudulent Transaction Data, Detecting Scam Transaction. All the content presented in this PPT design is completely editable. Download it and make adjustments in color, background, font etc. as per your unique business setting.
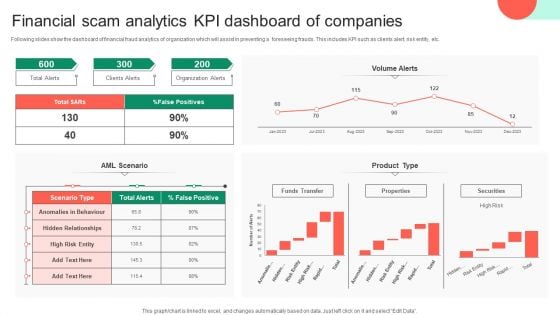
Financial Scam Analytics KPI Dashboard Of Companies Clipart PDF
Following slides show the dashboard of financial fraud analytics of organization which will assist in preventing a foreseeing frauds. This includes KPI such as clients alert, risk entity, etc. Pitch your topic with ease and precision using this Financial Scam Analytics KPI Dashboard Of Companies Clipart PDF. This layout presents information on Financial Scam Analytics, Kpi Dashboard Of Companies. It is also available for immediate download and adjustment. So, changes can be made in the color, design, graphics or any other component to create a unique layout.
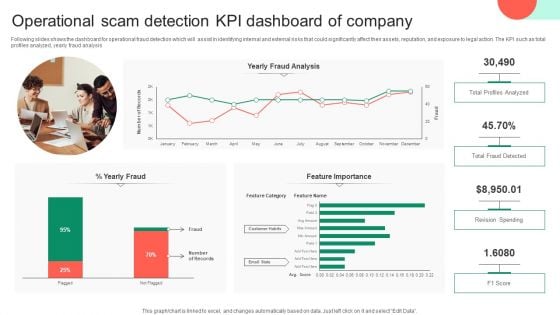
Operational Scam Detection KPI Dashboard Of Company Topics PDF
Following slides shows the dashboard for operational fraud detection which will assist in identifying internal and external risks that could significantly affect their assets, reputation, and exposure to legal action. The KPI such as total profiles analyzed, yearly fraud analysis. Pitch your topic with ease and precision using this Operational Scam Detection KPI Dashboard Of Company Topics PDF. This layout presents information on Profiles Analyzed, Operational Scam Detection, Kpi Dashboard Of Company. It is also available for immediate download and adjustment. So, changes can be made in the color, design, graphics or any other component to create a unique layout.
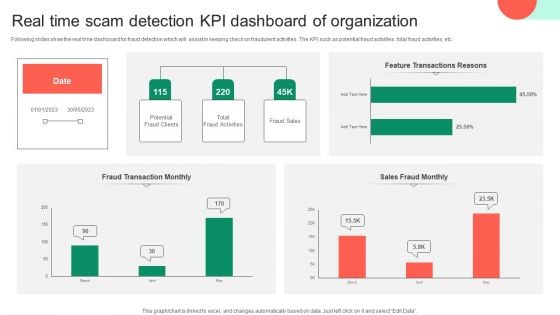
Real Time Scam Detection KPI Dashboard Of Organization Information PDF
Following slides show the real time dashboard for fraud detection which will assist in keeping check on fraudulent activities. The KPI such as potential fraud activities, total fraud activities, etc. Pitch your topic with ease and precision using this Real Time Scam Detection KPI Dashboard Of Organization Information PDF. This layout presents information on Real Time Scam Detection, Kpi Dashboard Of Organization. It is also available for immediate download and adjustment. So, changes can be made in the color, design, graphics or any other component to create a unique layout.
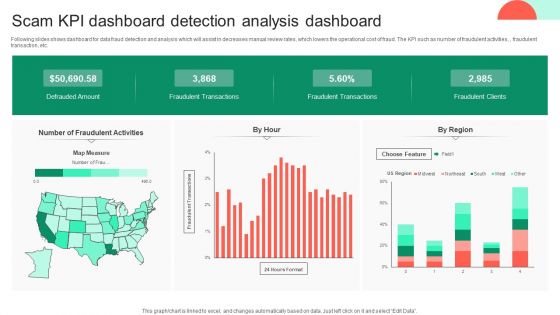
Scam KPI Dashboard Detection Analysis Dashboard Background PDF
Following slides shows dashboard for data fraud detection and analysis which will assist in decreases manual review rates, which lowers the operational cost of fraud. The KPI such as number of fraudulent activities, , fraudulent transaction, etc. Showcasing this set of slides titled Scam KPI Dashboard Detection Analysis Dashboard Background PDF. The topics addressed in these templates are Scam Kpi Dashboard, Detection Analysis Dashboard. All the content presented in this PPT design is completely editable. Download it and make adjustments in color, background, font etc. as per your unique business setting.
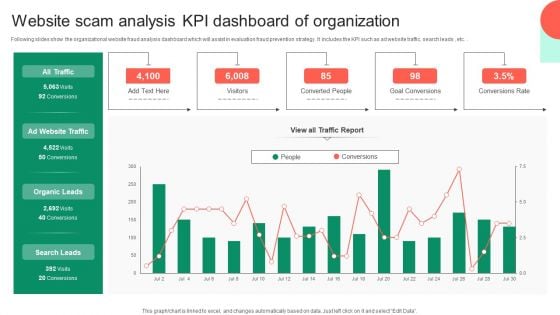
Website Scam Analysis KPI Dashboard Of Organization Sample PDF
Following slides show the organizational website fraud analysis dashboard which will assist in evaluation fraud prevention strategy. It includes the KPI such as ad website traffic, search leads , etc. Showcasing this set of slides titled Website Scam Analysis KPI Dashboard Of Organization Sample PDF. The topics addressed in these templates are Goal Conversions, Conversions Rate, Organic Leads. All the content presented in this PPT design is completely editable. Download it and make adjustments in color, background, font etc. as per your unique business setting.
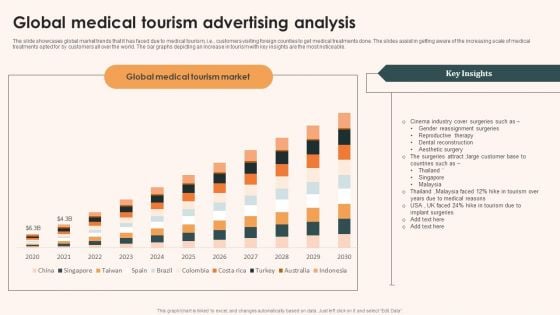
Global Medical Tourism Advertising Analysis Pictures PDF
The slide showcases global market trends that it has faced due to medical tourism, i.e., customers visiting foreign counties to get medical treatments done. The slides assist in getting aware of the increasing scale of medical treatments opted for by customers all over the world. The bar graphs depicting an increase in tourism with key insights are the most noticeable. Showcasing this set of slides titled Global Medical Tourism Advertising Analysis Pictures PDF. The topics addressed in these templates are Key Insights, Reassignment Surgeries, Reconstruction. All the content presented in this PPT design is completely editable. Download it and make adjustments in color, background, font etc. as per your unique business setting.

KPI Analytics Dashboard With Sourcing Raw Material Cycle Time Inspiration PDF
Following slide shows the key performance indicator KPI dashboard which will assist corporates to effectively monitor procurement process. The metrics are number of suppliers, contract compliance, average procurement cycle time, etc. Showcasing this set of slides titled KPI Analytics Dashboard With Sourcing Raw Material Cycle Time Inspiration PDF. The topics addressed in these templates are Kpi Analytics Dashboard, Sourcing Raw Material, Cycle Time. All the content presented in this PPT design is completely editable. Download it and make adjustments in color, background, font etc. as per your unique business setting.
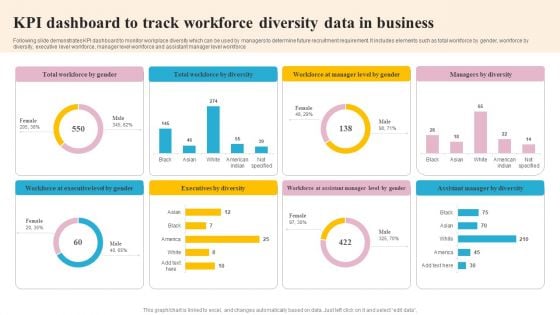
KPI Dashboard To Track Workforce Diversity Data In Business Mockup PDF
Following slide demonstrates KPI dashboard to monitor workplace diversity which can be used by managers to determine future recruitment requirement. It includes elements such as total workforce by gender, workforce by diversity, executive level workforce, manager level workforce and assistant manager level workforce. Pitch your topic with ease and precision using this KPI Dashboard To Track Workforce Diversity Data In Business Mockup PDF. This layout presents information on Executives By Diversity, Workforce By Diversity, Executive Level By Gender. It is also available for immediate download and adjustment. So, changes can be made in the color, design, graphics or any other component to create a unique layout.
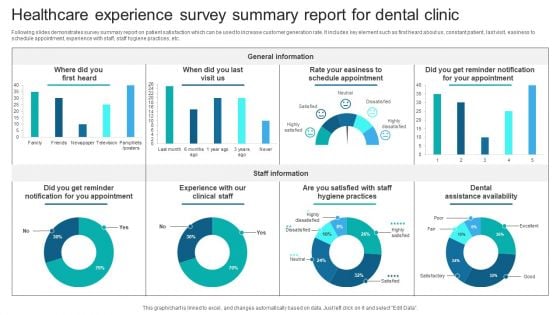
Healthcare Experience Survey Summary Report For Dental Clinic Survey SS
Following slides demonstrates survey summary report on patient satisfaction which can be used to increase customer generation rate. It includes key element such as first heard about us, constant patient, last visit, easiness to schedule appointment, experience with staff, staff hygiene practices, etc. Pitch your topic with ease and precision using this Healthcare Experience Survey Summary Report For Dental Clinic Survey SS. This layout presents information on General Information, Staff Information, Easiness To Schedule Appointment, Dental Assistance Availability, Staff Hygiene Practices. It is also available for immediate download and adjustment. So, changes can be made in the color, design, graphics or any other component to create a unique layout.
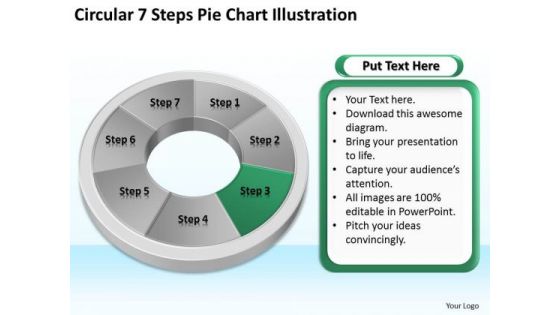
Circular 7 Steps Pie Chart Illustration How Do Make Business Plan PowerPoint Templates
We present our circular 7 steps pie chart illustration how do make business plan PowerPoint templates.Present our Circle Charts PowerPoint Templates because Our PowerPoint Templates and Slides has conjured up a web of all you need with the help of our great team. Use them to string together your glistening ideas. Download and present our Ring Charts PowerPoint Templates because You can Create a matrix with our PowerPoint Templates and Slides. Feel the strength of your ideas click into place. Use our Shapes PowerPoint Templates because Our PowerPoint Templates and Slides are Clear and concise. Use them and dispel any doubts your team may have. Download and present our Business PowerPoint Templates because It will get your audience in sync. Use our Signs PowerPoint Templates because You can Be the star of the show with our PowerPoint Templates and Slides. Rock the stage with your ideas.Use these PowerPoint slides for presentations relating to teps, flow, chart, diagram, process, graph, wheel, pie, stages, segments, green, corporate, red, business, blank, arrow, yellow, curving, copyspace, slices, graphic, directional, shape, modern, cycle, illustration, circular, round, clipart, seven, colorful, clip, blue, infographic, art, work, puzzle, clockwise, financial. The prominent colors used in the PowerPoint template are Green, Gray, Black. Your assessment will be the deciding factor. Help the audience figure it out with our Circular 7 Steps Pie Chart Illustration How Do Make Business Plan PowerPoint Templates.
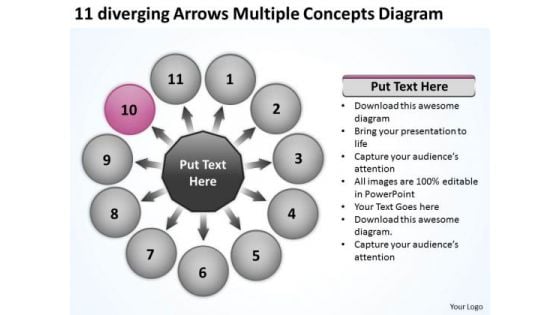
Diverging Arrows Multilple Concepts Diagram Ppt Circular Flow Chart PowerPoint Templates
We present our diverging arrows multilple concepts diagram ppt Circular Flow Chart PowerPoint templates.Present our Circle charts PowerPoint Templates because they are the tools that helped most of us evolve. Present our Arrows PowerPoint Templates because you can Transmit this concern to your staff using our helpful slides. Download and present our Flow charts PowerPoint Templates because the foundation stones of many a life. Download our Business PowerPoint Templates because you have churned your mind and come upwith solutions. Present our Spheres PowerPoint Templates because readymade PowerPoint templates can prove best of your knowledge for your slides to show.Use these PowerPoint slides for presentations relating to circle, commute, commuting, converge, diverge, fast, illustration infinity, iron, isolated, journey, locomotive, move, passage, passenger, path, rail railroad, railway, ring, road, route, speed, splint, station, steel, streak, strip, track, traintraintrack, tram, transit, transport, transportation, travel, travelling, turn, vacation vintage, voyage. The prominent colors used in the PowerPoint template are Purple, Gray, White. You can be sure our diverging arrows multilple concepts diagram ppt Circular Flow Chart PowerPoint templates are Cheerful. You can be sure our fast PowerPoint templates and PPT Slides are Tranquil. People tell us our diverging arrows multilple concepts diagram ppt Circular Flow Chart PowerPoint templates are Ultra. We assure you our fast PowerPoint templates and PPT Slides are specially created by a professional team with vast experience. They diligently strive to come up with the right vehicle for your brilliant Ideas. The feedback we get is that our diverging arrows multilple concepts diagram ppt Circular Flow Chart PowerPoint templates are incredible easy to use. We assure you our iron PowerPoint templates and PPT Slides are Wistful. Beat the budget with our Diverging Arrows Multilple Concepts Diagram Ppt Circular Flow Chart PowerPoint Templates. Have enough to spare in the end.
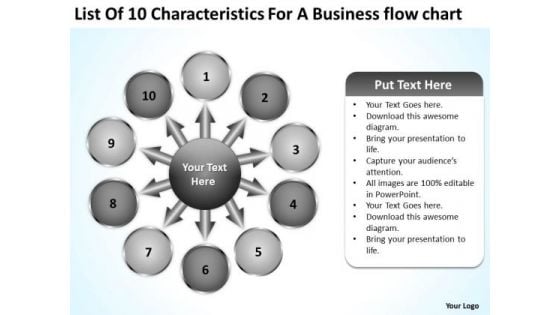
A Business PowerPoint Templates Download Flow Chart Business Cycle Arrow Diagram Slides
We present our a business powerpoint templates download flow chart business Cycle Arrow Diagram Slides.Download our Circle charts PowerPoint Templates because this slide is Designed to help bullet-point your views and thoughts. Use our Arrows PowerPoint Templates because Our PowerPoint Templates and Slides ensures Effective communication. They help you put across your views with precision and clarity. Present our Flow charts PowerPoint Templates because sprout your thoughts into the minds of your colleagues. Use our Business PowerPoint Templates because the great Bald headed Eagle embodies your personality. the eagle eye to seize upon the smallest of opportunities. Use our Shapes PowerPoint Templates because there are different paths to gain the necessary knowledge to acheive it.Use these PowerPoint slides for presentations relating to circle, commute, commuting, converge, diverge, fast, illustration infinity, iron, isolated, journey, locomotive, move, passage, passenger, path, rail railroad, railway, ring, road, route, speed, splint, station, steel, streak, strip, track, traintraintrack, tram, transit, transport, transportation, travel, travelling, turn, vacation vintage, voyage. The prominent colors used in the PowerPoint template are Gray, Black, White. You can be sure our a business powerpoint templates download flow chart business Cycle Arrow Diagram Slides are Reminiscent. The feedback we get is that our converge PowerPoint templates and PPT Slides will make you look like a winner. Customers tell us our a business powerpoint templates download flow chart business Cycle Arrow Diagram Slides are Stunning. You can be sure our fast PowerPoint templates and PPT Slides are Whimsical. The feedback we get is that our a business powerpoint templates download flow chart business Cycle Arrow Diagram Slides are Whimsical. You can be sure our fast PowerPoint templates and PPT Slides are Magical. Bring your value system to the table. Our A Business PowerPoint Templates Download Flow Chart Business Cycle Arrow Diagram Slides will show your good taste.
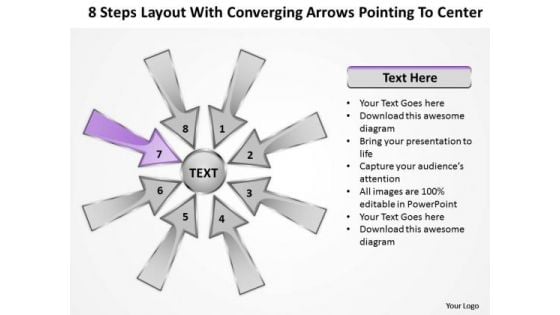
Steps Layout With Converging Arrows Pointing To Center Ppt Charts And Diagrams PowerPoint Slides
We present our steps layout with converging arrows pointing to center ppt Charts and Diagrams PowerPoint Slides.Present our Arrows PowerPoint Templates because this slide can help to bullet point your views. Download our Circle Charts PowerPoint Templates because you know your business and have a vision for it. Download and present our Shapes PowerPoint Templates because with the help of our Slides you can Illustrate these thoughts with this slide. Use our Business PowerPoint Templates because maximising sales of your product is the intended destination. Present our Flow Charts PowerPoint Templates because you require care and diligence to function well.Use these PowerPoint slides for presentations relating to 3d, abstract, all, around, arrow, aspect, attention, attract, blue, center, collect, colorful, conceptual, converge, course, cutout, direct, direction, factor, gather, globalization, go, green, guide, illustration, indicate, integration, isolated, location, many, movement, point, pointer, rainbow, reach, red, round, show, sides, sign, source, sphere, strategy, summon, symbol, target, unity, way, white, yellow. The prominent colors used in the PowerPoint template are Purple, Gray, Black. Presenters tell us our steps layout with converging arrows pointing to center ppt Charts and Diagrams PowerPoint Slides are Amazing. The feedback we get is that our attention PowerPoint templates and PPT Slides are second to none. Presenters tell us our steps layout with converging arrows pointing to center ppt Charts and Diagrams PowerPoint Slides are visually appealing. You can be sure our aspect PowerPoint templates and PPT Slides are Multicolored. People tell us our steps layout with converging arrows pointing to center ppt Charts and Diagrams PowerPoint Slides are Endearing. PowerPoint presentation experts tell us our around PowerPoint templates and PPT Slides are Majestic. Become a genius with our Steps Layout With Converging Arrows Pointing To Center Ppt Charts And Diagrams PowerPoint Slides. You will come out on top.
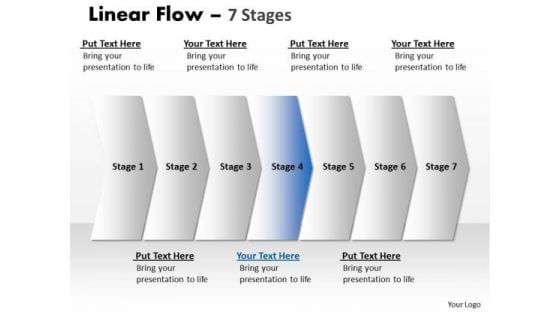
Flow Ppt Theme Parellel 415 PowerPoint Charts Of 7 Practice Macro Steps Image
We present our flow PPT Theme parallel 415 power point charts of 7 practice macro steps Image. Use our Arrows PowerPoint Templates because, Spread the light of knowledge around you, clear the doubts and enlighten the questioning minds with your brilliance and ability. Use our Background PowerPoint Templates because, they enhance the essence of your viable ideas. Use our Shapes PowerPoint Templates because, Now you have to coordinate and motivate your team. Use our Business PowerPoint Templates because; Help them align their arrows to consistently be accurate. Use our Process and Flows PowerPoint Templates because, Drive home your reasons and chart the path ahead to arrive at tour destination and achieve the goal. Use these PowerPoint slides for presentations relating to background, blog, business, chain, communication, community, concept, contact, design, interaction, internet, line, linear, location, logistic, map, modern, movement, network, pointer, reaction, social, stream, structure, system, team,. The prominent colors used in the PowerPoint template are Blue, White, and Black Educate an audience with our Flow Ppt Theme Parellel 415 PowerPoint Charts Of 7 Practice Macro Steps Image. Just download, type and present.
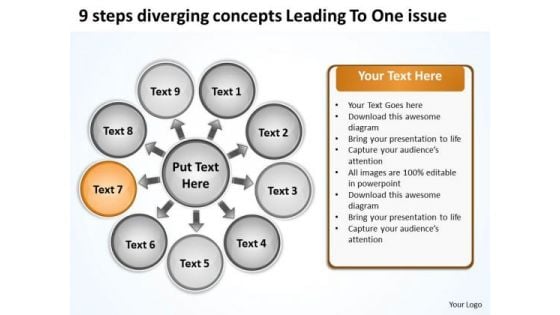
9 Steps Diverging Concepts Leading To One Issue Cycle Motion Diagram PowerPoint Slides
We present our 9 steps diverging concepts leading to one issue Cycle Motion Diagram PowerPoint Slides.Download our Circle charts PowerPoint Templates because using our templates for your colleagues will impart knowledge to feed. Download and present our Signs PowerPoint Templates because this template helps you to illustrate your method, piece by piece, and interlock the whole process in the minds of your audience. Use our Process and flows PowerPoint Templates because you can Help your viewers automatically emphathise with your thoughts. Download and present our Shapes PowerPoint Templates because all elements of the venture are equally critical. Use our Ring charts PowerPoint Templates because your brain is always churning out ideas like cogs in a wheel.Use these PowerPoint slides for presentations relating to Arrows, business, chart, circle, company, concept, continuity, continuous, cycle, dependency, diagram, direction, dynamic, endless, feeds, graph, iteration, iterative, method, path, phase, presentation, process, production, progress, progression, report, rotation, sequence, succession. The prominent colors used in the PowerPoint template are Orange, Black, White. You can be sure our 9 steps diverging concepts leading to one issue Cycle Motion Diagram PowerPoint Slides are Amazing. Presenters tell us our circle PowerPoint templates and PPT Slides are readymade to fit into any presentation structure. We assure you our 9 steps diverging concepts leading to one issue Cycle Motion Diagram PowerPoint Slides are Bright. Customers tell us our concept PowerPoint templates and PPT Slides are Beautiful. Presenters tell us our 9 steps diverging concepts leading to one issue Cycle Motion Diagram PowerPoint Slides are Royal. You can be sure our concept PowerPoint templates and PPT Slides are designed by a team of presentation professionals. Display a fair minded approach with our 9 Steps Diverging Concepts Leading To One Issue Cycle Motion Diagram PowerPoint Slides. Give due attention to all aspects.
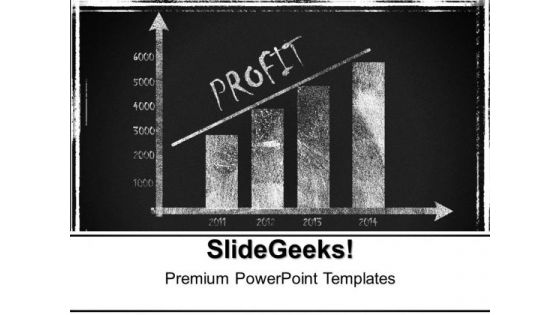
Profit Presentation Success PowerPoint Templates And PowerPoint Themes 0512
Microsoft Powerpoint Templates and Background with business chart on blackboard Help them fathom the depths of your mind. Give them a dive with our Profit Presentation Success PowerPoint Templates And PowerPoint Themes 0512.
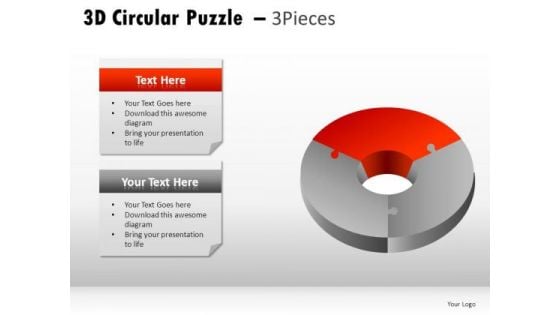
Creativity 3d Circular Puzzle 3 Pieces PowerPoint Slides And Ppt Diagram Templates
Creativity 3D Circular Puzzle 3 Pieces PowerPoint Slides And PPT Diagram Templates-These high quality powerpoint pre-designed slides and powerpoint templates have been carefully created by our professional team to help you impress your audience. All slides have been created and are 100% editable in powerpoint. Each and every property of any graphic - color, size, orientation, shading, outline etc. can be modified to help you build an effective powerpoint presentation. Any text can be entered at any point in the powerpoint template or slide. Simply DOWNLOAD, TYPE and PRESENT! Correct the errant with our Creativity 3d Circular Puzzle 3 Pieces PowerPoint Slides And Ppt Diagram Templates. They will willingly accept your advice.
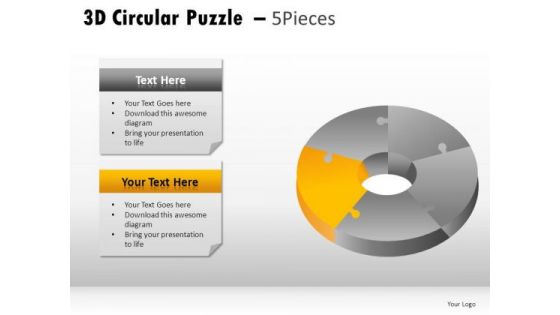
Creativity 3d Circular Puzzle 5 Pieces PowerPoint Slides And Ppt Diagram Templates
Creativity 3D Circular Puzzle 5 Pieces PowerPoint Slides And PPT Diagram Templates-These high quality powerpoint pre-designed slides and powerpoint templates have been carefully created by our professional team to help you impress your audience. All slides have been created and are 100% editable in powerpoint. Each and every property of any graphic - color, size, orientation, shading, outline etc. can be modified to help you build an effective powerpoint presentation. Any text can be entered at any point in the powerpoint template or slide. Simply DOWNLOAD, TYPE and PRESENT! Achieve aggressive turnaround leadership with our Creativity 3d Circular Puzzle 5 Pieces PowerPoint Slides And Ppt Diagram Templates. They will make you look good.
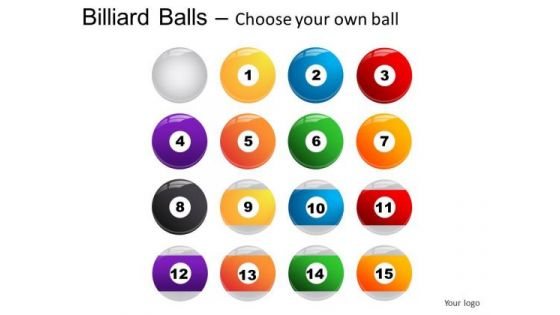
Felt Billiard Balls With Cue PowerPoint Slides And Ppt Diagram Templates
Felt Billiard Balls With Cue PowerPoint Slides And PPT Diagram Templates-These high quality powerpoint pre-designed slides and powerpoint templates have been carefully created by our professional team to help you impress your audience. All slides have been created and are 100% editable in powerpoint. Each and every property of any graphic - color, size, orientation, shading, outline etc. can be modified to help you build an effective powerpoint presentation. Any text can be entered at any point in the powerpoint template or slide. Simply DOWNLOAD, TYPE and PRESENT! Our Felt Billiard Balls With Cue PowerPoint Slides And Ppt Diagram Templates remain within bounds. They will never exceed their brief.
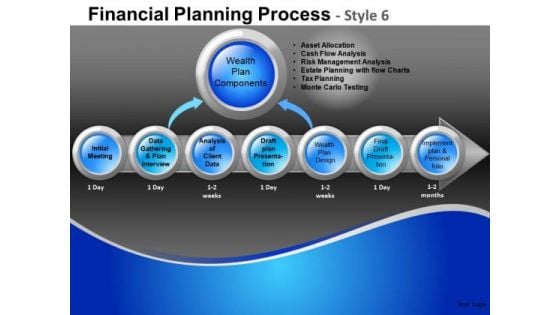
Components Financial Planning Process 6 PowerPoint Slides And Ppt Diagram Templates
Components Financial Planning Process 6 PowerPoint Slides And PPT Diagram Templates-These high quality powerpoint pre-designed slides and powerpoint templates have been carefully created by our professional team to help you impress your audience. All slides have been created and are 100% editable in powerpoint. Each and every property of any graphic - color, size, orientation, shading, outline etc. can be modified to help you build an effective powerpoint presentation. Any text can be entered at any point in the powerpoint template or slide. Simply DOWNLOAD, TYPE and PRESENT! Our Components Financial Planning Process 6 PowerPoint Slides And Ppt Diagram Templates are evidently advantageous. The balance will tilt in your favour.
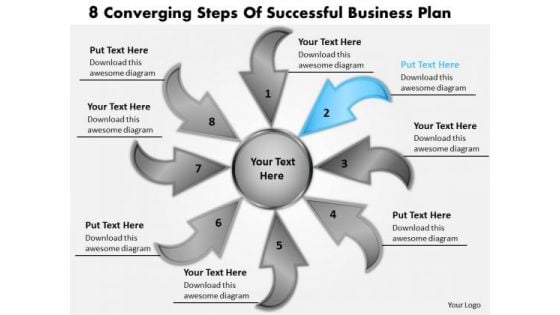
Successful Business PowerPoint Theme Plan Circular Flow Motion Process Templates
We present our successful business powerpoint theme plan Circular Flow Motion Process templates.Use our Flow Charts PowerPoint Templates because they will Amplify your plans to have dedicated sub groups working on related but distinct tasks. Download our Business PowerPoint Templates because it helps you to project your enthusiasm and single mindedness to your colleagues. Present our Arrows PowerPoint Templates because Our PowerPoint Templates and Slides will let you Illuminate the road ahead to Pinpoint the important landmarks along the way. Use our Shapes PowerPoint Templates because These PowerPoint Templates and Slides will give the updraft to your ideas. See them soar to great heights with ease. Present our Process and Flows PowerPoint Templates because It can Bubble and burst with your ideas.Use these PowerPoint slides for presentations relating to Arrow, Business, Chart, Circular, Concept, Diagram, Informative, Internet, Market, Marketing, Member, Performance, Process, Profit, Profitable, Project, Refer, Referral, Referring, Revenue, Socialize, Steps, Strategy, Web, Websites. The prominent colors used in the PowerPoint template are Blue light, Gray, White. People tell us our successful business powerpoint theme plan Circular Flow Motion Process templates are Fabulous. People tell us our Internet PowerPoint templates and PPT Slides are Amazing. The feedback we get is that our successful business powerpoint theme plan Circular Flow Motion Process templates are incredible easy to use. Presenters tell us our Internet PowerPoint templates and PPT Slides are Perfect. Customers tell us our successful business powerpoint theme plan Circular Flow Motion Process templates are Sparkling. The feedback we get is that our Diagram PowerPoint templates and PPT Slides are designed by professionals Display entrepreneurial leadership with our Successful Business PowerPoint Theme Plan Circular Flow Motion Process Templates. They will make you look good.
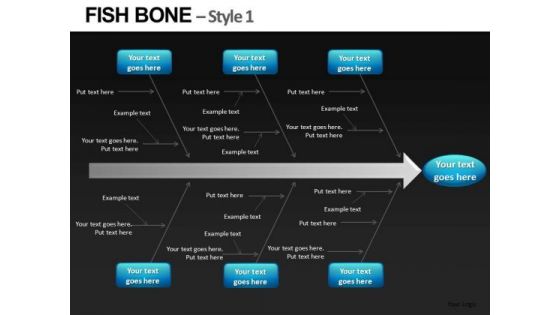
Cause And Effect Fishbone Diagram PowerPoint Slides Editable Ppt Templates
Cause and Effect FishBone Diagram PowerPoint Slides Editable PPT Templates-These high quality powerpoint pre-designed slides and powerpoint templates have been carefully created by our professional team to help you impress your audience. All slides have been created and are 100% editable in powerpoint. Each and every property of any graphic - color, size, orientation, shading, outline etc. can be modified to help you build an effective powerpoint presentation. Any text can be entered at any point in the powerpoint template or slide. Simply DOWNLOAD, TYPE and PRESENT!These PowerPoint Presentation slides can be used for themes relating to--Arrow, cause, defect, deficiency, diagram, document, effect, envelope, environment, fishbone, flow, industry, kahashiwara, machine, manufacture, material, paper, pencil, safety, sketch Coach subordinates with our Cause And Effect Fishbone Diagram PowerPoint Slides Editable Ppt Templates. Download without worries with our money back guaranteee.

 Home
Home