Ships Icon
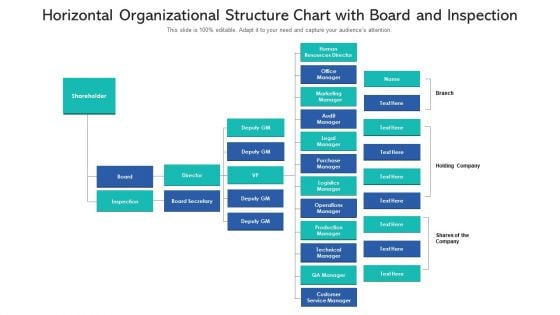
Horizontal Organizational Structure Chart With Board And Inspection Ppt PowerPoint Presentation File Master Slide PDF
Presenting horizontal organizational structure chart with board and inspection ppt powerpoint presentation file master slide pdf to dispense important information. This template comprises five stages. It also presents valuable insights into the topics including technical manager, customer service manager, legal manager. This is a completely customizable PowerPoint theme that can be put to use immediately. So, download it and address the topic impactfully.
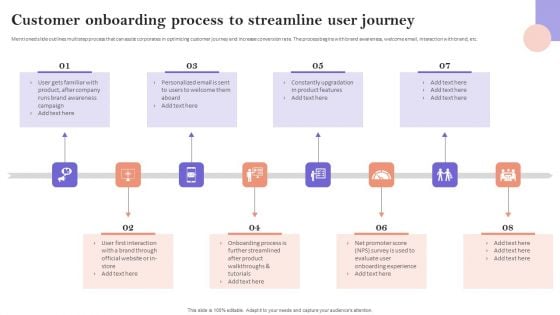
Customer Onboarding Process To Streamline User Journey Diagrams PDF
Mentioned slide outlines multistep process that can assist corporates in optimizing customer journey and increase conversion rate. The process begins with brand awareness, welcome email, interaction with brand, etc. Slidegeeks is here to make your presentations a breeze with Customer Onboarding Process To Streamline User Journey Diagrams PDF With our easy to use and customizable templates, you can focus on delivering your ideas rather than worrying about formatting. With a variety of designs to choose from, you are sure to find one that suits your needs. And with animations and unique photos, illustrations, and fonts, you can make your presentation pop. So whether you are giving a sales pitch or presenting to the board, make sure to check out Slidegeeks first.
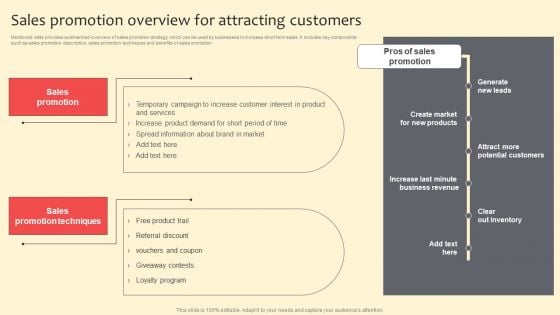
Sales Promotion Overview For Attracting Customers Diagrams PDF
Mentioned slide provides summarized overview of sales promotion strategy which can be used by businesses to increase short term sales. It includes key components such as sales promotion description, sales promotion techniques and benefits of sales promotion. This modern and well arranged Sales Promotion Overview For Attracting Customers Diagrams PDF provides lots of creative possibilities. It is very simple to customize and edit with the Powerpoint Software. Just drag and drop your pictures into the shapes. All facets of this template can be edited with Powerpoint no extra software is necessary. Add your own material, put your images in the places assigned for them, adjust the colors, and then you can show your slides to the world, with an animated slide included.
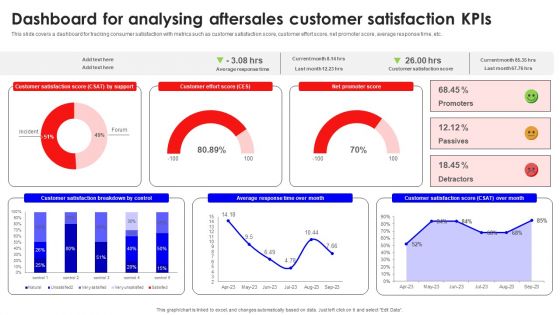
Dashboard For Analysing Aftersales Customer Satisfaction Kpis Mockup PDF
This slide covers a dashboard for tracking consumer satisfaction with metrics such as customer satisfaction score, customer effort score, net promoter score, average response time, etc. Are you searching for a Dashboard For Analysing Aftersales Customer Satisfaction Kpis Mockup PDF that is uncluttered, straightforward, and original Its easy to edit, and you can change the colors to suit your personal or business branding. For a presentation that expresses how much effort you have put in, this template is ideal With all of its features, including tables, diagrams, statistics, and lists, its perfect for a business plan presentation. Make your ideas more appealing with these professional slides. Download Dashboard For Analysing Aftersales Customer Satisfaction Kpis Mockup PDF from Slidegeeks today.
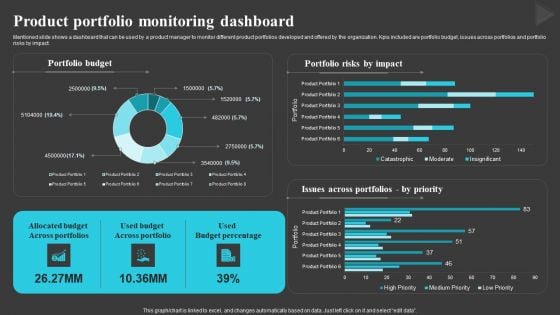
Product Portfolio Monitoring Dashboard Creating And Offering Multiple Product Ranges In New Business Diagrams PDF
Mentioned slide shows a dashboard that can be used by a product manager to monitor different product portfolios developed and offered by the organization. Kpis included are portfolio budget, issues across portfolios and portfolio risks by impact.Crafting an eye-catching presentation has never been more straightforward. Let your presentation shine with this tasteful yet straightforward Product Portfolio Monitoring Dashboard Creating And Offering Multiple Product Ranges In New Business Diagrams PDF template. It offers a minimalistic and classy look that is great for making a statement. The colors have been employed intelligently to add a bit of playfulness while still remaining professional. Construct the ideal Product Portfolio Monitoring Dashboard Creating And Offering Multiple Product Ranges In New Business Diagrams PDF that effortlessly grabs the attention of your audience Begin now and be certain to wow your customers.
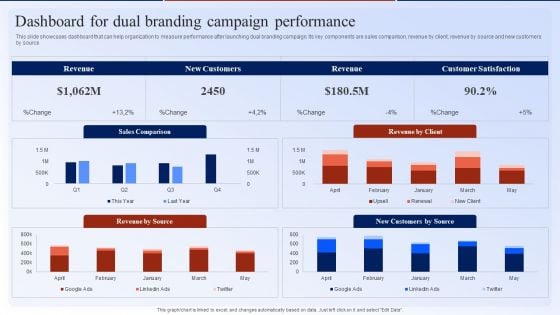
Dashboard For Dual Branding Campaign Performance Dual Branding Marketing Campaign Diagrams PDF
This slide showcases dashboard that can help organization to measure performance after launching dual branding campaign. Its key components are sales comparison, revenue by client, revenue by source and new customers by source. Here you can discover an assortment of the finest PowerPoint and Google Slides templates. With these templates, you can create presentations for a variety of purposes while simultaneously providing your audience with an eye-catching visual experience. Download Dashboard For Dual Branding Campaign Performance Dual Branding Marketing Campaign Diagrams PDF to deliver an impeccable presentation. These templates will make your job of preparing presentations much quicker, yet still, maintain a high level of quality. Slidegeeks has experienced researchers who prepare these templates and write high-quality content for you. Later on, you can personalize the content by editing the Dashboard For Dual Branding Campaign Performance Dual Branding Marketing Campaign Diagrams PDF.
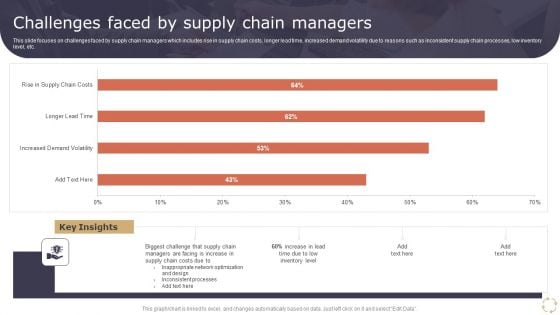
Optimizing Logistics Models To Enhance Supply Chain Management Challenges Faced By Supply Chain Managers Diagrams PDF
This slide focuses on challenges faced by supply chain managers which includes rise in supply chain costs, longer lead time, increased demand volatility due to reasons such as inconsistent supply chain processes, low inventory level, etc. Crafting an eye catching presentation has never been more straightforward. Let your presentation shine with this tasteful yet straightforward Optimizing Logistics Models To Enhance Supply Chain Management Challenges Faced By Supply Chain Managers Diagrams PDF template. It offers a minimalistic and classy look that is great for making a statement. The colors have been employed intelligently to add a bit of playfulness while still remaining professional. Construct the ideal Optimizing Logistics Models To Enhance Supply Chain Management Challenges Faced By Supply Chain Managers Diagrams PDF that effortlessly grabs the attention of your audience Begin now and be certain to wow your customers.
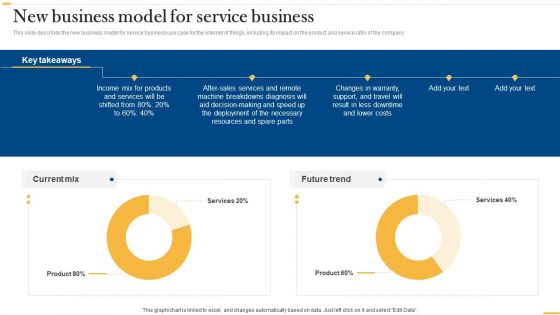
Deploying Ai To Enhance New Business Model For Service Business Diagrams PDF
This slide describes the new business model for service business use case for the internet of things, including its impact on the product and service ratio of the company. Crafting an eye-catching presentation has never been more straightforward. Let your presentation shine with this tasteful yet straightforward Deploying Ai To Enhance New Business Model For Service Business Diagrams PDF template. It offers a minimalistic and classy look that is great for making a statement. The colors have been employed intelligently to add a bit of playfulness while still remaining professional. Construct the ideal Deploying Ai To Enhance New Business Model For Service Business Diagrams PDF that effortlessly grabs the attention of your audience Begin now and be certain to wow your customers.
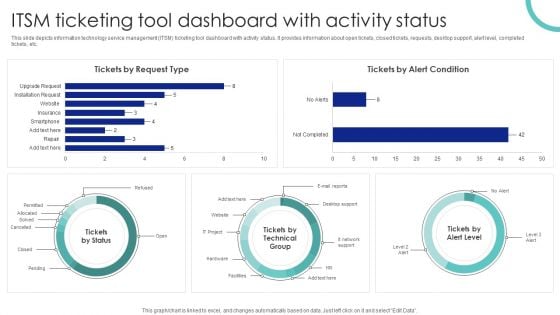
ITSM Ticketing Tool Dashboard With Activity Status Ppt PowerPoint Presentation File Diagrams PDF
This slide depicts information technology service management ITSM ticketing tool dashboard with activity status. It provides information about open tickets, closed tickets, requests, desktop support, alert level, completed tickets, etc. Crafting an eye catching presentation has never been more straightforward. Let your presentation shine with this tasteful yet straightforward ITSM Ticketing Tool Dashboard With Activity Status Ppt PowerPoint Presentation File Diagrams PDF template. It offers a minimalistic and classy look that is great for making a statement. The colors have been employed intelligently to add a bit of playfulness while still remaining professional. Construct the ideal ITSM Ticketing Tool Dashboard With Activity Status Ppt PowerPoint Presentation File Diagrams PDF that effortlessly grabs the attention of your audience Begin now and be certain to wow your customers.
Performance Tracking Dashboard For 5G Architecture 5G Network Structure Diagrams PDF
This slide describes the performance tracking dashboard for 5G architecture by covering the details of subscribers, quality of experience, consumption, customer support, coverage, devices, and dimensions.Explore a selection of the finest Performance Tracking Dashboard For 5G Architecture 5G Network Structure Diagrams PDF here. With a plethora of professionally designed and pre-made slide templates, you can quickly and easily find the right one for your upcoming presentation. You can use our Performance Tracking Dashboard For 5G Architecture 5G Network Structure Diagrams PDF to effectively convey your message to a wider audience. Slidegeeks has done a lot of research before preparing these presentation templates. The content can be personalized and the slides are highly editable. Grab templates today from Slidegeeks.
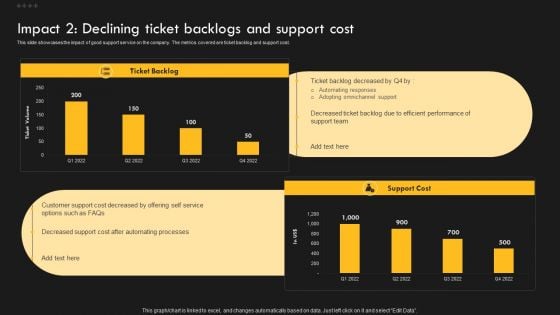
Service Improvement Techniques For Client Retention Impact 2 Declining Ticket Backlogs And Support Diagrams PDF
This slide showcases the impact of good support service on the company. The metrics covered are customer satisfaction and retention. Explore a selection of the finest Service Improvement Techniques For Client Retention Impact 2 Declining Ticket Backlogs And Support Diagrams PDF here. With a plethora of professionally designed and pre-made slide templates, you can quickly and easily find the right one for your upcoming presentation. You can use our Service Improvement Techniques For Client Retention Impact 2 Declining Ticket Backlogs And Support Diagrams PDF to effectively convey your message to a wider audience. Slidegeeks has done a lot of research before preparing these presentation templates. The content can be personalized and the slides are highly editable. Grab templates today from Slidegeeks.
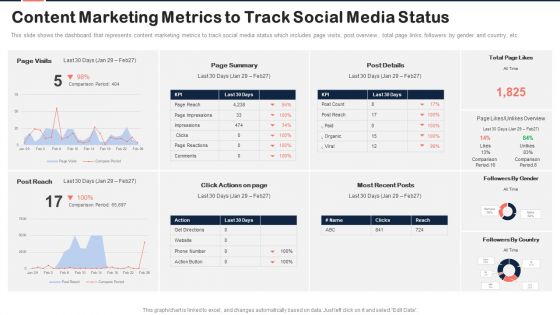
Implementing Content Marketing Plan To Nurture Leads Content Marketing Metrics To Track Diagrams PDF
This slide shows the dashboard that represents content marketing metrics to track social media status which includes page visits, post overview, total page links, followers by gender and country, etc. Crafting an eye catching presentation has never been more straightforward. Let your presentation shine with this tasteful yet straightforward Implementing Content Marketing Plan To Nurture Leads Content Marketing Metrics To Track Diagrams PDF template. It offers a minimalistic and classy look that is great for making a statement. The colors have been employed intelligently to add a bit of playfulness while still remaining professional. Construct the ideal Implementing Content Marketing Plan To Nurture Leads Content Marketing Metrics To Track Diagrams PDF that effortlessly grabs the attention of your audience Begin now and be certain to wow your customers.

Merry Christmas Smiley In The Basket Joy Template PowerPoint Slides
We present our merry christmas smiley in the basket joy template PowerPoint Slides.Download our Festival PowerPoint Templates because it is a step by step process with levels rising at every stage. Use our Religion PowerPoint Templates because this PPt slide highlights any anticipated problems, shortfalls or weak areas. Download and present our Christmas PowerPoint Templates because the basic stages are in place, you need to build upon them with our PowerPoint templates. Download our Holidays PowerPoint Templates because you have a good idea of the roadmap to your desired destination. Present our Church PowerPoint Templates because this diagram helps to reaffirm to your team your faith in maintaining the highest ethical standards.Use these PowerPoint slides for presentations relating to Backgrounds, Baubles, Bow, Box, Card, Celebration, Christmas, Conifer, Coniferous, Copy, Space, December, Decor, Decorative, Deer, Design, Eve, Face, Frame, Gift, Golden, Hat, Holiday, Holly, House, Illustration, Merry, Moon, Nature, Needles, New, Year, Night, Red, Ribbon, Santa, Claus, Silhouette, Sky, Sleigh, Smile, Snow, Snowfall, Snowman, Stars, Town, Toys. The prominent colors used in the PowerPoint template are Brown, White, Red. The feedback we get is that our merry christmas smiley in the basket joy template PowerPoint Slides are designed by professionals Presenters tell us our Celebration PowerPoint templates and PPT Slides are Magnificent. PowerPoint presentation experts tell us our merry christmas smiley in the basket joy template PowerPoint Slides are Second to none. Professionals tell us our Box PowerPoint templates and PPT Slides are Dynamic. The feedback we get is that our merry christmas smiley in the basket joy template PowerPoint Slides look good visually. Customers tell us our Box PowerPoint templates and PPT Slides are Efficacious. Courageously battle controversy with our Merry Christmas Smiley In The Basket Joy Template PowerPoint Slides. Your thoughts will resolve the dichotomy.
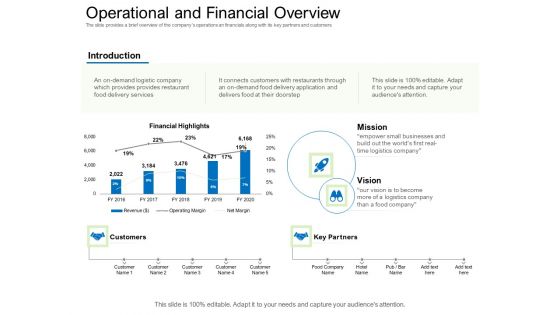
Collective Equity Funding Pitch Deck Operational And Financial Overview Clipart PDF
The slide provides a brief overview of the companys operations an financials along with its key partners and customers. Deliver an awe-inspiring pitch with this creative collective equity funding pitch deck operational and financial overview clipart pdf. bundle. Topics like provides restaurant, food delivery services, businesses, introduction can be discussed with this completely editable template. It is available for immediate download depending on the needs and requirements of the user.

Optimizing Administrative Efficiencies Through Human Resource Service Delivery Ppt PowerPoint Presentation Complete Deck With Slides
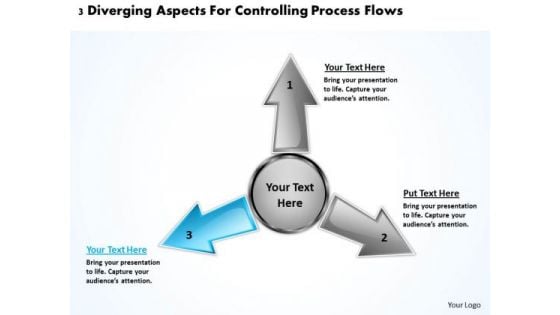
3 Diverging Aspects For Controlling Process Flows Cycle Diagram PowerPoint Templates
We present our 3 diverging aspects for controlling process flows Cycle Diagram PowerPoint templates.Download our Business PowerPoint Templates because you can Flutter your wings and enchant the world. Impress them with the innate attractiveness of your thoughts and words. Download our Shapes PowerPoint Templates because this Diagram emphasizes on any critical or key factors within them. Use our Flow Charts PowerPoint Templates because you understand the illness and its causes. Present our Arrows PowerPoint Templates because you will be able to Highlight your ideas broad-based on strong fundamentals and illustrate how they step by step acheive the set growth factor. Use our Process and Flows PowerPoint Templates because you have a clear vision of the cake you want.Use these PowerPoint slides for presentations relating to Arrow, Brochure, Business, Chart, Circle, Cyclic, Data, Diagram, Financial, Goal, Graph, Illustration, Info, Information, Investment, Manage, Marketing, Model, Option, Part, Pie, Presentation, Process, Result, Sphere, Statistics, Stock, Strategy, Template, Wheel. The prominent colors used in the PowerPoint template are Blue light, Gray, Black. People tell us our 3 diverging aspects for controlling process flows Cycle Diagram PowerPoint templates are Beautiful. Customers tell us our Chart PowerPoint templates and PPT Slides are Elegant. People tell us our 3 diverging aspects for controlling process flows Cycle Diagram PowerPoint templates are Perfect. Professionals tell us our Business PowerPoint templates and PPT Slides are Fantastic. Customers tell us our 3 diverging aspects for controlling process flows Cycle Diagram PowerPoint templates are designed by a team of presentation professionals. Use our Data PowerPoint templates and PPT Slides are Radiant. Get the best backing available. It'll be difficult to beat your thoughts and our 3 Diverging Aspects For Controlling Process Flows Cycle Diagram PowerPoint Templates.
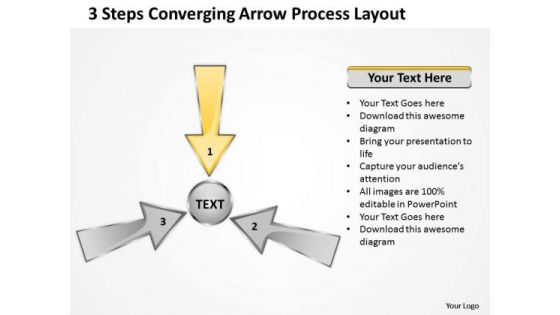
3 Steps Converging Arrow Process Layout Cycle Flow Diagram PowerPoint Template
We present our 3 steps converging arrow process layout Cycle Flow Diagram PowerPoint template.Present our Flow Charts PowerPoint Templates because this template helps you to put your finger on the pulse of your business and sense the need to re-align a bit. Present our Business PowerPoint Templates because this diagram is designed to help your audience to develop their thoughts along the way. Present our Shapes PowerPoint Templates because this diagram put it all together to form the complete picture and reach the goal. Present our Success PowerPoint Templates because the choices you make today will determine the future growth of your enterprise. Use our Arrows PowerPoint Templates because individual components well researched and understood in their place.Use these PowerPoint slides for presentations relating to Arrow, Business, Chart, Circular, Concept, Diagram, Informative, Internet, Market, Marketing, Member, Performance, Process, Profit, Profitable, Project, Refer, Referral, Referring, Revenue, Socialize, Steps, Strategy, Web, Websites. The prominent colors used in the PowerPoint template are Yellow, White, Gray. People tell us our 3 steps converging arrow process layout Cycle Flow Diagram PowerPoint template are aesthetically designed to attract attention. We guarantee that they will grab all the eyeballs you need. Customers tell us our Concept PowerPoint templates and PPT Slides will make the presenter successul in his career/life. People tell us our 3 steps converging arrow process layout Cycle Flow Diagram PowerPoint template are second to none. Professionals tell us our Diagram PowerPoint templates and PPT Slides will help them to explain complicated concepts. Customers tell us our 3 steps converging arrow process layout Cycle Flow Diagram PowerPoint template are Spiffy. Use our Market PowerPoint templates and PPT Slides are Reminiscent. Show attitude with our 3 Steps Converging Arrow Process Layout Cycle Flow Diagram PowerPoint Template. Let your listeners know your depth.
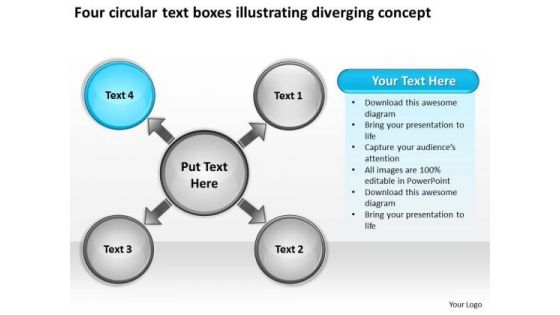
Text Boxes Illustrating Diverging Concept Cycle Circular Flow Spoke Diagram PowerPoint Slides
We present our text boxes illustrating diverging concept cycle Circular Flow Spoke Diagram PowerPoint Slides.Use our Business PowerPoint Templates because watch the excitement levels rise as they realise their worth. Download and present our Success PowerPoint Templates because iT outlines the entire thought process for the benefit of others. Tell it to the world with your characteristic aplomb. Present our Process and Flows PowerPoint Templates because you will be able to Highlight your ideas broad-based on strong fundamentals and illustrate how they step by step acheive the set growth factor. Present our Circle Charts PowerPoint Templates because this can explain the various related aspects of these varied tracks and how they will, on hitting their own targets, cumulatively contribute to hitting GOLD. Present our Shapes PowerPoint Templates because you have a clear vision of the cake you want.Use these PowerPoint slides for presentations relating to Access, Arrows, Bright, Business, Chart, Circle, Concept, Conceptual, Connection, Creative, Cycle, Different, Element, Empty, Graphic, Group, Illustration, Match, Process, Strategy, Template. The prominent colors used in the PowerPoint template are Blue, White, Black. Professionals tell us our text boxes illustrating diverging concept cycle Circular Flow Spoke Diagram PowerPoint Slides are Dynamic. Customers tell us our Conceptual PowerPoint templates and PPT Slides are designed by a team of presentation professionals. Use our text boxes illustrating diverging concept cycle Circular Flow Spoke Diagram PowerPoint Slides are Wonderful. The feedback we get is that our Chart PowerPoint templates and PPT Slides are readymade to fit into any presentation structure. Professionals tell us our text boxes illustrating diverging concept cycle Circular Flow Spoke Diagram PowerPoint Slides are Magnificent. Presenters tell us our Chart PowerPoint templates and PPT Slides are Vintage. Convince your customers that you care. Express your commitment through our Text Boxes Illustrating Diverging Concept Cycle Circular Flow Spoke Diagram PowerPoint Slides.
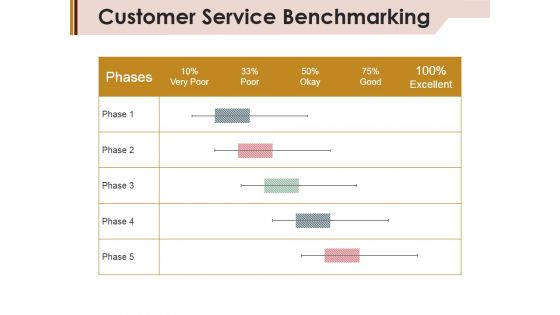
Customer Service Benchmarking Ppt Powerpoint Presentation Infographic Template Gallery
This is a customer service benchmarking ppt powerpoint presentation infographic template gallery. This is a five stage process. The stages in this process are phases, poor, very poor, okay.
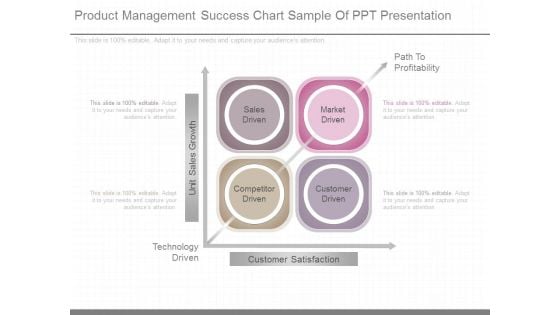
Product Management Success Chart Sample Of Ppt Presentation
This is a product management success chart sample of ppt presentation. This is a four stage process. The stages in this process are sales driven, market driven, competitor driven, customer driven, technology driven, path to profitability, customer satisfaction, unit sales growth.
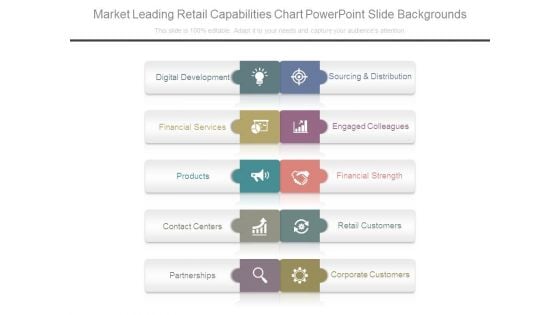
Market Leading Retail Capabilities Chart Powerpoint Slide Backgrounds
This is a market leading retail capabilities chart powerpoint slide backgrounds. This is a five stage process. The stages in this process are digital development, financial services, products, contact centers, partnerships, sourcing and distribution, engaged colleagues, financial strength, retail customers, corporate customers.
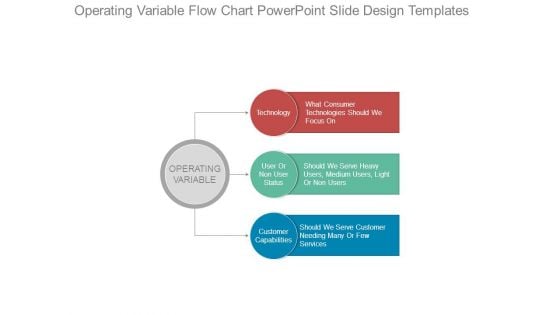
Operating Variable Flow Chart Powerpoint Slide Design Templates
This is a operating variable flow chart powerpoint slide design templates. This is a three stage process. The stages in this process are operating variable, technology what consumer technologies should we focus on, user or non user status should we serve heavy users medium users light or non users, customer capabilities should we serve customer needing many or few services.
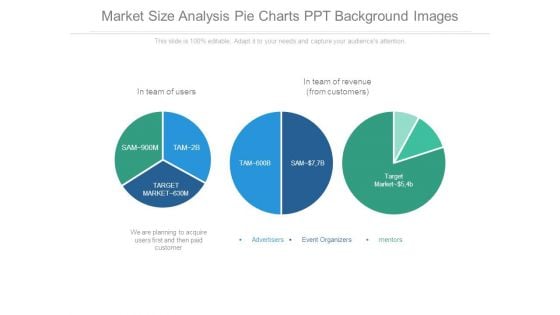
Market Size Analysis Pie Charts Ppt Background Images
This is a market size analysis pie charts ppt background images. This is a three stage process. The stages in this process are in team of users, in team of revenue from customers, target market, we are planning to acquire users first and then paid customer, advertisers, event organizers, mentors.
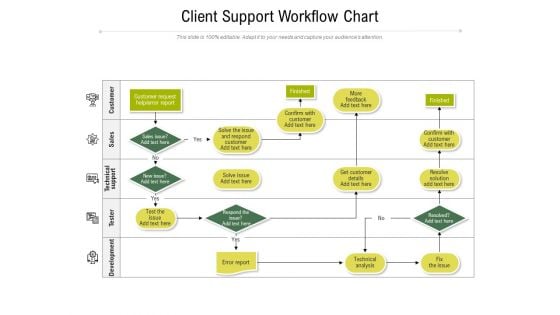
Client Support Workflow Chart Ppt PowerPoint Presentation Gallery Tips PDF
Presenting this set of slides with name client support workflow chart ppt powerpoint presentation gallery tips pdf. This is a five stage process. The stages in this process are development, tester, technical support, sales, customer request help, error report customer, technical analysis, fix the issue. This is a completely editable PowerPoint presentation and is available for immediate download. Download now and impress your audience.
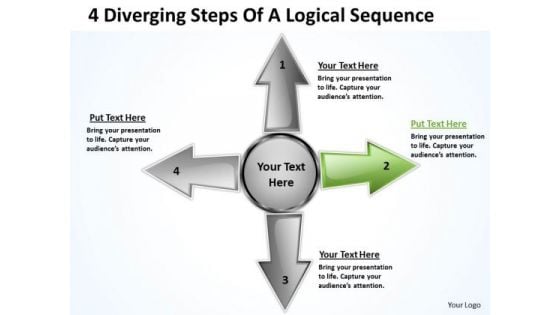
4 Diverging Steps Of A Logical Sequence Circular Arrow Diagram PowerPoint Template
We present our 4 diverging steps of a logical sequence Circular Arrow Diagram PowerPoint template.Present our Business PowerPoint Templates because Building castles in the sand is a danger and you are aware of. You have taken the precaution of building strong fundamentals. Use our Shapes PowerPoint Templates because they pinpoint the core values of your organisation. Download and present our Flow Charts PowerPoint Templates because you can illustrate your ideas and imprint them in the minds of your team with this template. Download our Arrows PowerPoint Templates because you can Enlighten them with your brilliant understanding of mental health. Present our Process and Flows PowerPoint Templates because readymade PowerPoint templates can prove best of your knowledge for your slides to show.Use these PowerPoint slides for presentations relating to Arrow, Brochure, Business, Chart, Circle, Cyclic, Data, Diagram, Financial, Goal, Graph, Illustration, Info, Information, Investment, Manage, Marketing, Model, Option, Part, Pie, Presentation, Process, Result, Sphere, Statistics, Stock, Strategy, Template, Wheel. The prominent colors used in the PowerPoint template are Green, Gray, White. People tell us our 4 diverging steps of a logical sequence Circular Arrow Diagram PowerPoint template are Wistful. Customers tell us our Data PowerPoint templates and PPT Slides are Stylish. People tell us our 4 diverging steps of a logical sequence Circular Arrow Diagram PowerPoint template are designed by professionals Professionals tell us our Data PowerPoint templates and PPT Slides are Majestic. Customers tell us our 4 diverging steps of a logical sequence Circular Arrow Diagram PowerPoint template are Youthful. Use our Chart PowerPoint templates and PPT Slides are Great. Create an effective checklist with our 4 Diverging Steps Of A Logical Sequence Circular Arrow Diagram PowerPoint Template. Put all the ticks in the right place.
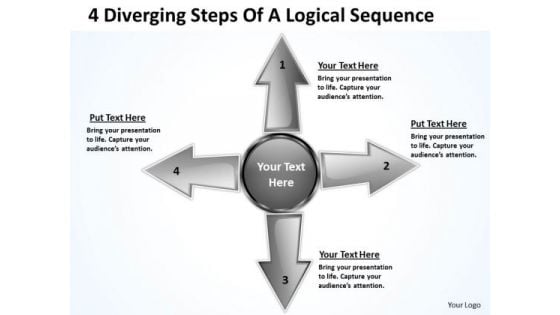
4 Diverging Steps Of A Logical Sequence Circular Arrow Diagram PowerPoint Templates
We present our 4 diverging steps of a logical sequence Circular Arrow Diagram PowerPoint templates.Download our Success PowerPoint Templates because the choices you make today will determine the future growth of your enterprise. Download our Business PowerPoint Templates because you have churned your mind and come upwith solutions. Use our Arrows PowerPoint Templates because getting it done may not be enough. Download and present our Flow Charts PowerPoint Templates because in this Slide Various threads are joining up and being stitched together providing necessary strength Now you have to take the last leap. Download our Shapes PowerPoint Templates because you have it all down to a nicety, slice by slice, layer by layer.Use these PowerPoint slides for presentations relating to Arrow, Brochure, Business, Chart, Circle, Cyclic, Data, Diagram, Financial, Goal, Graph, Illustration, Info, Information, Investment, Manage, Marketing, Model, Option, Part, Pie, Presentation, Process, Result, Sphere, Statistics, Stock, Strategy, Template, Wheel. The prominent colors used in the PowerPoint template are Black, Gray, White. People tell us our 4 diverging steps of a logical sequence Circular Arrow Diagram PowerPoint templates provide you with a vast range of viable options. Select the appropriate ones and just fill in your text. Customers tell us our Chart PowerPoint templates and PPT Slides are Luxuriant. People tell us our 4 diverging steps of a logical sequence Circular Arrow Diagram PowerPoint templates are Versatile. Professionals tell us our Data PowerPoint templates and PPT Slides are Wistful. Customers tell us our 4 diverging steps of a logical sequence Circular Arrow Diagram PowerPoint templates look good visually. Use our Data PowerPoint templates and PPT Slides are Romantic. Our 4 Diverging Steps Of A Logical Sequence Circular Arrow Diagram PowerPoint Templates are specially created by professionals. They diligently strive to come up with the right vehicle for your thoughts.

Seven Steps Business PowerPoint Templates Download Strategy Ppt Venn Diagram Slide
We present our seven steps business powerpoint templates download strategy ppt Venn Diagram Slide.Present our Process and Flows PowerPoint Templates because you can Show them how you can save the day. Present our Finance PowerPoint Templates because you envisage some areas of difficulty in the near future. The overall financial situation could be a source of worry. Download and present our Circle Charts PowerPoint Templates because you will be able to Highlight these individual targets and the paths to their achievement. Present our Shapes PowerPoint Templates because with the help of our Slides you can Illustrate how each element flows seamlessly onto the next stage. Use our Marketing PowerPoint Templates because networking is an imperative in todays world. You need to access the views of others. Similarly you need to give access to them of your abilities.Use these PowerPoint slides for presentations relating to Background, business, chart, circle, circular, company, concept, diagram, management, marketing, model, navigation, point, presentation, representation, six, sphere, team, website. The prominent colors used in the PowerPoint template are Green, Gray, White. The feedback we get is that our seven steps business powerpoint templates download strategy ppt Venn Diagram Slide are Enchanting. Customers tell us our concept PowerPoint templates and PPT Slides are Efficient. Professionals tell us our seven steps business powerpoint templates download strategy ppt Venn Diagram Slide are Spiffy. Customers tell us our circular PowerPoint templates and PPT Slides are Endearing. Use our seven steps business powerpoint templates download strategy ppt Venn Diagram Slide will get their audience's attention. Professionals tell us our chart PowerPoint templates and PPT Slides are Romantic. Be a conscious and capable citizen. Elaborate on your environmental concerns with our Seven Steps Business PowerPoint Templates Download Strategy Ppt Venn Diagram Slide.
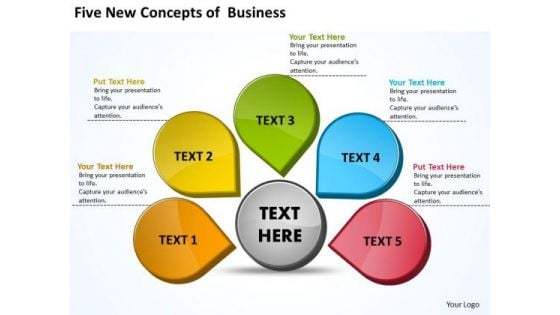
Five New Concepts Of Business S PowerPoint Slides Presentation Diagrams Templates
We present our Five New Concepts of Business s powerpoint slides presentation diagrams templates.Download our Business PowerPoint Templates because you are sure you have the right people for your plans. Download and present our Circle Charts PowerPoint Templates because they are Gauranteed to focus the minds of your team. Present our Signs PowerPoint Templates because you too have a bagful of great ideas. Use our Design PowerPoint Templates because Our PowerPoint Templates and Slides will fulfill your every need. Use them and effectively satisfy the desires of your audience. Use our Marketing PowerPoint Templates because customer satisfaction is a mantra of the marketplace. Building a loyal client base is an essential element of your business.Use these PowerPoint slides for presentations relating to abstract, background, blue, box, brochure, business, catalog, chart, circle, color, concept, cross, description, design, development, diagram, five, goals, graphic, green, guide, illustration, isolated, item, management, marketing, model, modern, navigation, new, orange, paper, parts, pie, plans, presentation, red, reports, round, sign, symbol, team, template, text, title, vector, web, website, wheel, yellow. The prominent colors used in the PowerPoint template are Green, Blue, Red. People tell us our Five New Concepts of Business s powerpoint slides presentation diagrams templates are Striking. The feedback we get is that our chart PowerPoint templates and PPT Slides are Efficient. Professionals tell us our Five New Concepts of Business s powerpoint slides presentation diagrams templates are Great. Customers tell us our blue PowerPoint templates and PPT Slides are Splendid. The feedback we get is that our Five New Concepts of Business s powerpoint slides presentation diagrams templates provide great value for your money. Be assured of finding the best projection to highlight your words. Professionals tell us our catalog PowerPoint templates and PPT Slides have awesome images to get your point across. Orchestrate wins with our Five New Concepts Of Business S PowerPoint Slides Presentation Diagrams Templates. Download without worries with our money back guaranteee.
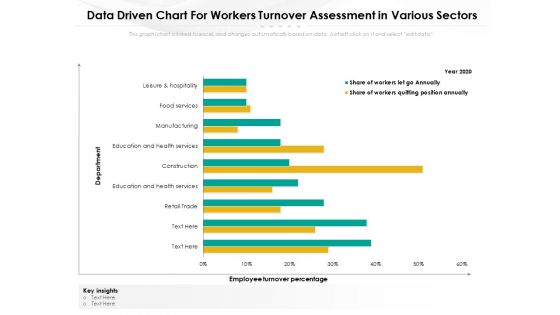
Data Driven Chart For Workers Turnover Assessment In Various Sectors Ppt PowerPoint Presentation Layouts Demonstration PDF
Presenting this set of slides with name data driven chart for workers turnover assessment in various sectors ppt powerpoint presentation layouts demonstration pdf. The topics discussed in these slides are share of workers quitting position annually, share of workers let go annually, leisure and hospitality, food services, manufacturing, construction. This is a completely editable PowerPoint presentation and is available for immediate download. Download now and impress your audience.
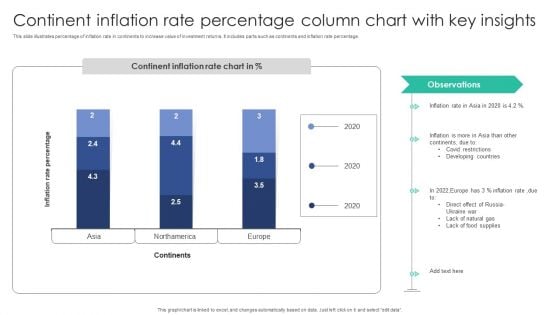
Continent Inflation Rate Percentage Column Chart With Key Insights Topics PDF
This slide illustrates percentage of inflation rate in continents to increase value of investment returns. It includes parts such as continents and inflation rate percentage.Showcasing this set of slides titled Continent Inflation Rate Percentage Column Chart With Key Insights Topics PDF. The topics addressed in these templates are Developing Countries, Covid Restrictions, Food Supplies. All the content presented in this PPT design is completely editable. Download it and make adjustments in color, background, font etc. as per your unique business setting.
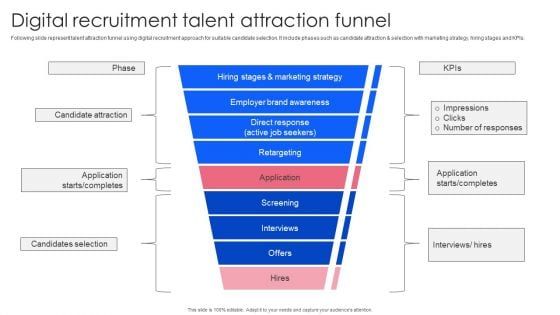
Effective Guide To Build Strong Online Hiring Strategy Digital Recruitment Talent Attraction Funnel Themes PDF
Following slide represent talent attraction funnel using digital recruitment approach for suitable candidate selection. It include phases such as candidate attraction and selection with marketing strategy, hiring stages and KPIs. Make sure to capture your audiences attention in your business displays with our gratis customizable Effective Guide To Build Strong Online Hiring Strategy Digital Recruitment Talent Attraction Funnel Themes PDF. These are great for business strategies, office conferences, capital raising or task suggestions. If you desire to acquire more customers for your tech business and ensure they stay satisfied, create your own sales presentation with these plain slides.
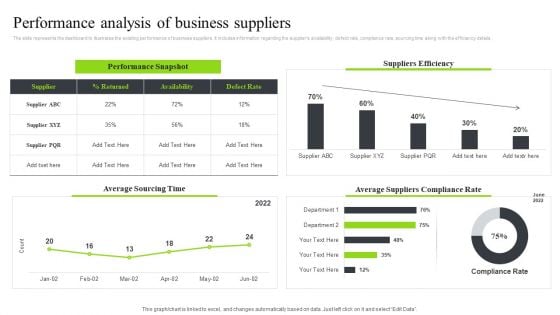
Strategic Sourcing And Supplier Quality Performance Analysis Of Business Suppliers Diagrams PDF
The slide represents the dashboard to illustrates the existing performance of business suppliers. It includes information regarding the suppliers availability, defect rate, compliance rate, sourcing time along with the efficiency details.Welcome to our selection of the Strategic Sourcing And Supplier Quality Performance Analysis Of Business Suppliers Diagrams PDF. These are designed to help you showcase your creativity and bring your sphere to life. Planning and Innovation are essential for any business that is just starting out. This collection contains the designs that you need for your everyday presentations. All of our PowerPoints are 100precent editable, so you can customize them to suit your needs. This multi-purpose template can be used in various situations. Grab these presentation templates today.

Nielsen Business Profile Revenue And Operating Income Ppt PowerPoint Presentation Diagram PDF
This slide highlights the Nielsen company revenue and operating income for the last 3 years. It includes the data in million of US dollars with a key takeaways section. This Nielsen Business Profile Revenue And Operating Income Ppt PowerPoint Presentation Diagram PDF from Slidegeeks makes it easy to present information on your topic with precision. It provides customization options, so you can make changes to the colors, design, graphics, or any other component to create a unique layout. It is also available for immediate download, so you can begin using it right away. Slidegeeks has done good research to ensure that you have everything you need to make your presentation stand out. Make a name out there for a brilliant performance.
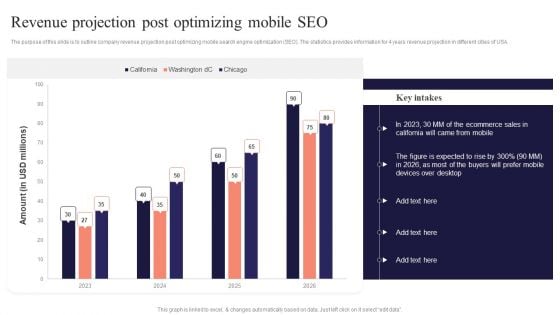
Revenue Projection Post Optimizing Mobile SEO Performing Mobile SEO Audit To Analyze Web Traffic Diagrams PDF
The purpose of this slide is to outline company revenue projection post optimizing mobile search engine optimization SEO. The statistics provides information for 4 years revenue projection in different cities of USA.Welcome to our selection of the Revenue Projection Post Optimizing Mobile SEO Performing Mobile SEO Audit To Analyze Web Traffic Diagrams PDF. These are designed to help you showcase your creativity and bring your sphere to life. Planning and Innovation are essential for any business that is just starting out. This collection contains the designs that you need for your everyday presentations. All of our PowerPoints are 100 precent editable, so you can customize them to suit your needs. This multi-purpose template can be used in various situations. Grab these presentation templates today.

Traditional Marketing Guide To Increase Audience Engagement Cost Spent On Traditional Marketing Channels Diagrams PDF
This slide provides an overview of the cost spent on various marketing forms. The forms covered are print, broadcasting, outdoor, one on one and referral marketing. This Traditional Marketing Guide To Increase Audience Engagement Cost Spent On Traditional Marketing Channels Diagrams PDF from Slidegeeks makes it easy to present information on your topic with precision. It provides customization options, so you can make changes to the colors, design, graphics, or any other component to create a unique layout. It is also available for immediate download, so you can begin using it right away. Slidegeeks has done good research to ensure that you have everything you need to make your presentation stand out. Make a name out there for a brilliant performance.

Strategic Plan For Enterprise Key Performance Indicators Highlighting Current Problems Diagrams PDF
This slide represents the key performance indicators to track the problems faced by organization and draw effective strategies to tackle the problems. It includes key performance indicators of decline in organizational sales and customer engagement rate. Coming up with a presentation necessitates that the majority of the effort goes into the content and the message you intend to convey. The visuals of a PowerPoint presentation can only be effective if it supplements and supports the story that is being told. Keeping this in mind our experts created Strategic Plan For Enterprise Key Performance Indicators Highlighting Current Problems Diagrams PDF to reduce the time that goes into designing the presentation. This way, you can concentrate on the message while our designers take care of providing you with the right template for the situation.
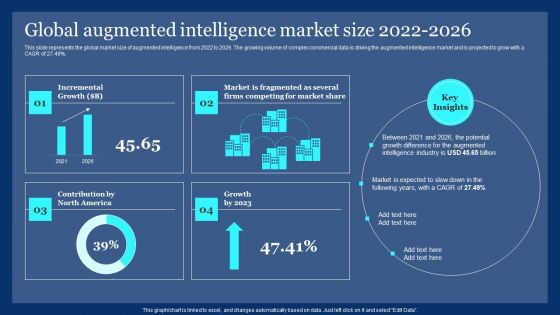
Global Augmented Intelligence Market Size 2022 2026 Ppt PowerPoint Presentation Diagram PDF
This slide represents the global market size of augmented intelligence from 2022 to 2026. The growing volume of complex commercial data is driving the augmented intelligence market and is projected to grow with a CAGR of 27.49 percent. This Global Augmented Intelligence Market Size 2022 2026 Ppt PowerPoint Presentation Diagram PDF from Slidegeeks makes it easy to present information on your topic with precision. It provides customization options, so you can make changes to the colors, design, graphics, or any other component to create a unique layout. It is also available for immediate download, so you can begin using it right away. Slidegeeks has done good research to ensure that you have everything you need to make your presentation stand out. Make a name out there for a brilliant performance.
Industrial Robots System Industrial Robots System Performance Tracking Dashboard Diagrams PDF
This slide shows the dashboard to keep a regular track of the performance of industrial robots. the purpose of this slide is to provide a graphical representation of robots performance to enhance the accuracy and effectiveness of these machines. This modern and well-arranged Industrial Robots System Industrial Robots System Performance Tracking Dashboard Diagrams PDF provides lots of creative possibilities. It is very simple to customize and edit with the Powerpoint Software. Just drag and drop your pictures into the shapes. All facets of this template can be edited with Powerpoint, no extra software is necessary. Add your own material, put your images in the places assigned for them, adjust the colors, and then you can show your slides to the world, with an animated slide included.
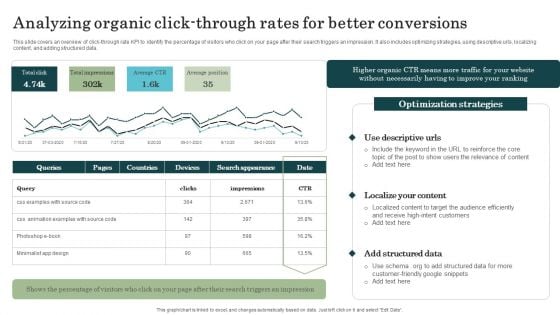
Marketing Success Metrics Analyzing Organic Click Through Rates For Better Diagrams PDF
This slide covers an overview of click-through rate KPI to identify the percentage of visitors who click on your page after their search triggers an impression. It also includes optimizing strategies, using descriptive urls, localizing content, and adding structured data. Welcome to our selection of the Marketing Success Metrics Analyzing Organic Click Through Rates For Better Diagrams PDF. These are designed to help you showcase your creativity and bring your sphere to life. Planning and Innovation are essential for any business that is just starting out. This collection contains the designs that you need for your everyday presentations. All of our PowerPoints are 100 percent editable, so you can customize them to suit your needs. This multi-purpose template can be used in various situations. Grab these presentation templates today.
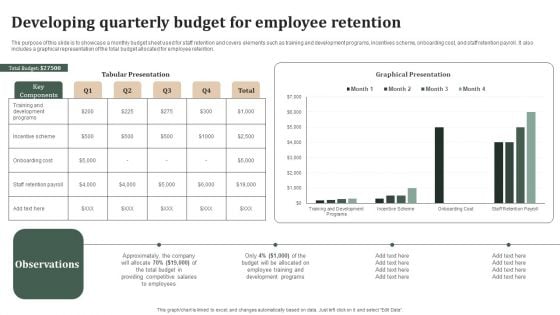
Successful Staff Retention Techniques Developing Quarterly Budget For Employee Retention Diagrams PDF
The purpose of this slide is to showcase a monthly budget sheet used for staff retention and covers elements such as training and development programs, incentives scheme, onboarding cost, and staff retention payroll. It also includes a graphical representation of the total budget allocated for employee retention. This Successful Staff Retention Techniques Developing Quarterly Budget For Employee Retention Diagrams PDF from Slidegeeks makes it easy to present information on your topic with precision. It provides customization options, so you can make changes to the colors, design, graphics, or any other component to create a unique layout. It is also available for immediate download, so you can begin using it right away. Slidegeeks has done good research to ensure that you have everything you need to make your presentation stand out. Make a name out there for a brilliant performance.
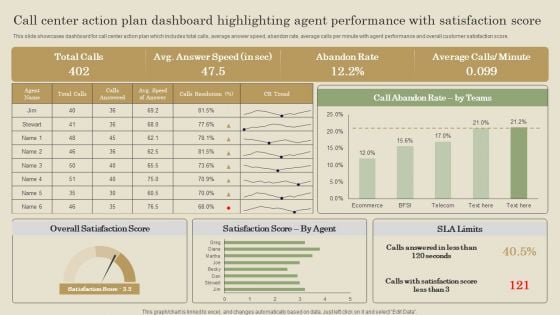
Call Center Action Plan Dashboard Highlighting Agent Performance With Satisfaction Score Diagrams PDF
This slide showcases dashboard for call center action plan which includes total calls, average answer speed, abandon rate, average calls per minute with agent performance and overall customer satisfaction score. Slidegeeks has constructed Call Center Action Plan Dashboard Highlighting Agent Performance With Satisfaction Score Diagrams PDF after conducting extensive research and examination. These presentation templates are constantly being generated and modified based on user preferences and critiques from editors. Here, you will find the most attractive templates for a range of purposes while taking into account ratings and remarks from users regarding the content. This is an excellent jumping off point to explore our content and will give new users an insight into our top notch PowerPoint Templates.
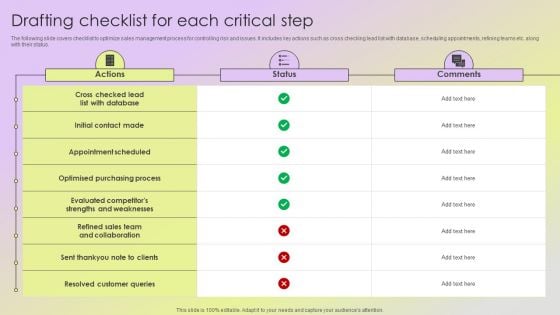
Mitigating Sales Risks With Strategic Action Planning Drafting Checklist For Each Critical Step Diagrams PDF
The following slide covers checklist to optimize sales management process for controlling risk and issues. It includes key actions such as cross checking lead list with database, scheduling appointments, refining teams etc. along with their status. Welcome to our selection of the Mitigating Sales Risks With Strategic Action Planning Drafting Checklist For Each Critical Step Diagrams PDF. These are designed to help you showcase your creativity and bring your sphere to life. Planning and Innovation are essential for any business that is just starting out. This collection contains the designs that you need for your everyday presentations. All of our PowerPoints are 100 percent editable, so you can customize them to suit your needs. This multi purpose template can be used in various situations. Grab these presentation templates today.

Impact Of Marketing Strategies On Business Performance Ppt PowerPoint Presentation Diagram Lists PDF
The following slide showcases the positive outcome of marketing strategies on companys performance. Post-implementing marketing strategies company recorded significant increase in brand awareness rate, sales and profit, market share, and customer retention rate. The Impact Of Marketing Strategies On Business Performance Ppt PowerPoint Presentation Diagram Lists PDF is a compilation of the most recent design trends as a series of slides. It is suitable for any subject or industry presentation, containing attractive visuals and photo spots for businesses to clearly express their messages. This template contains a variety of slides for the user to input data, such as structures to contrast two elements, bullet points, and slides for written information. Slidegeeks is prepared to create an impression.
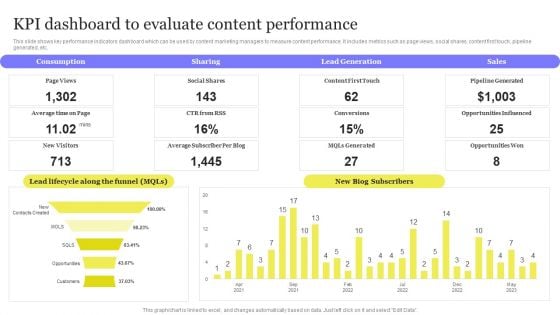
Enhancing Digital Visibility Using SEO Content Strategy KPI Dashboard To Evaluate Content Performance Diagrams PDF
This slide shows key performance indicators dashboard which can be used by content marketing managers to measure content performance. It includes metrics such as page views, social shares, content first touch, pipeline generated, etc. This modern and well arranged Enhancing Digital Visibility Using SEO Content Strategy KPI Dashboard To Evaluate Content Performance Diagrams PDF provides lots of creative possibilities. It is very simple to customize and edit with the Powerpoint Software. Just drag and drop your pictures into the shapes. All facets of this template can be edited with Powerpoint no extra software is necessary. Add your own material, put your images in the places assigned for them, adjust the colors, and then you can show your slides to the world, with an animated slide included.
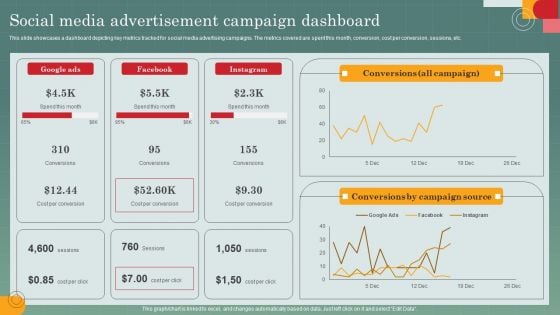
Advertising Programs Management Techniques Social Media Advertisement Campaign Dashboard Diagrams PDF
This slide showcases a dashboard depicting key metrics tracked for social media advertising campaigns. The metrics covered are spent this month, conversion, cost per conversion, sessions, etc. This modern and well arranged Advertising Programs Management Techniques Social Media Advertisement Campaign Dashboard Diagrams PDF provides lots of creative possibilities. It is very simple to customize and edit with the Powerpoint Software. Just drag and drop your pictures into the shapes. All facets of this template can be edited with Powerpoint no extra software is necessary. Add your own material, put your images in the places assigned for them, adjust the colors, and then you can show your slides to the world, with an animated slide included.
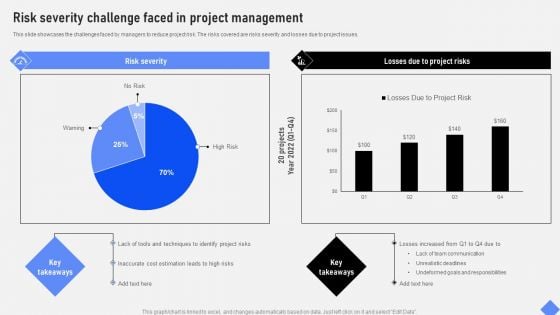
Effective Business Project Risk Mitigation Plan Risk Severity Challenge Faced In Project Management Diagrams PDF
This slide showcases the challenges faced by managers to reduce project risk. The risks covered are risks severity and losses due to project issues. This Effective Business Project Risk Mitigation Plan Risk Severity Challenge Faced In Project Management Diagrams PDF from Slidegeeks makes it easy to present information on your topic with precision. It provides customization options, so you can make changes to the colors, design, graphics, or any other component to create a unique layout. It is also available for immediate download, so you can begin using it right away. Slidegeeks has done good research to ensure that you have everything you need to make your presentation stand out. Make a name out there for a brilliant performance.
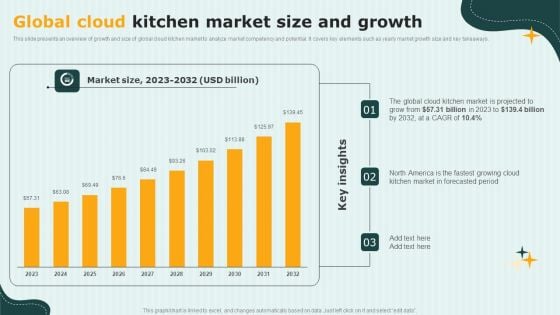
International Cloud Kitchen Industry Analysis Global Cloud Kitchen Market Size And Growth Diagrams PDF
This slide presents an overview of growth and size of global cloud kitchen market to analyze market competency and potential. It covers key elements such as yearly market growth size and key takeaways. This modern and well-arranged International Cloud Kitchen Industry Analysis Global Cloud Kitchen Market Size And Growth Diagrams PDF provides lots of creative possibilities. It is very simple to customize and edit with the Powerpoint Software. Just drag and drop your pictures into the shapes. All facets of this template can be edited with Powerpoint, no extra software is necessary. Add your own material, put your images in the places assigned for them, adjust the colors, and then you can show your slides to the world, with an animated slide included.
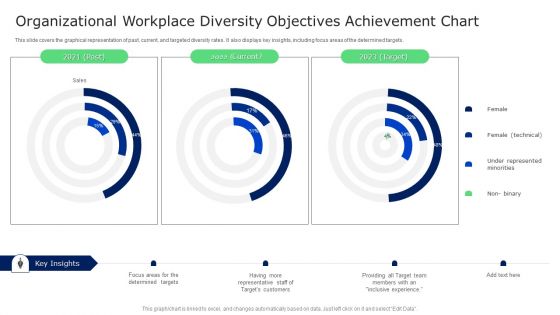
Organizational Workplace Diversity Objectives Achievement Chart Brochure PDF
This slide covers the graphical representation of past, current, and targeted diversity rates. It also displays key insights, including focus areas of the determined targets. Showcasing this set of slides titled Organizational Workplace Diversity Objectives Achievement Chart Brochure PDF. The topics addressed in these templates are Targets Customers, Determined Targets, Target Team. All the content presented in this PPT design is completely editable. Download it and make adjustments in color, background, font etc. as per your unique business setting.
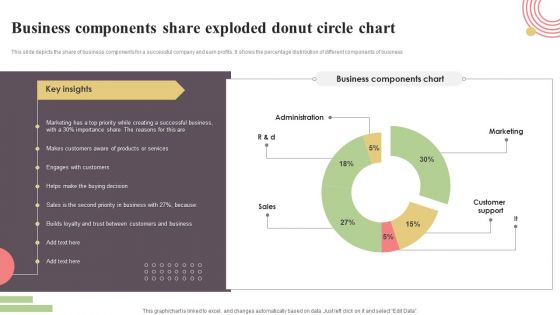
Business Components Share Exploded Donut Circle Chart Elements PDF
This slide depicts the share of business components for a successful company and earn profits. It shows the percentage distribution of different components of business. Pitch your topic with ease and precision using this Business Components Share Exploded Donut Circle Chart Elements PDF. This layout presents information on Administration, Marketing, Customer Support. It is also available for immediate download and adjustment. So, changes can be made in the color, design, graphics or any other component to create a unique layout.
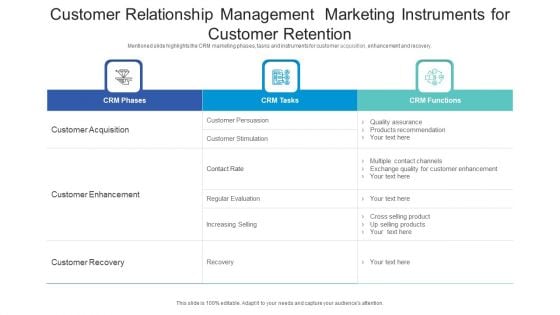
Customer Relationship Management Marketing Instruments For Customer Retention Files PDF
Mentioned slide highlights the CRM marketing phases, tasks and instruments for customer acquisition, enhancement and recovery. Showcasing this set of slides titled customer relationship management marketing instruments for customer retention files pdf. The topics addressed in these templates are customer acquisition, customer enhancement, customer recovery. All the content presented in this PPT design is completely editable. Download it and make adjustments in color, background, font etc. as per your unique business setting.
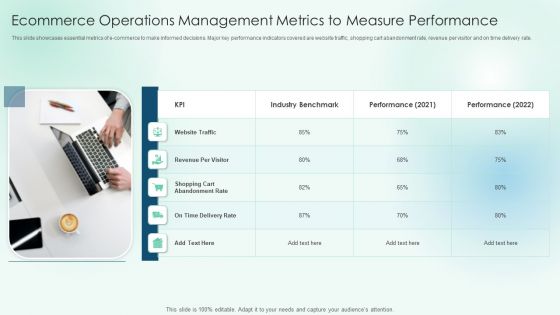
Ecommerce Operations Management Metrics To Measure Performance Professional PDF
This slide showcases essential metrics of e-commerce to make informed decisions. Major key performance indicators covered are website traffic, shopping cart abandonment rate, revenue per visitor and on time delivery rate. Presenting Ecommerce Operations Management Metrics To Measure Performance Professional PDF to dispense important information. This template comprises one stage. It also presents valuable insights into the topics including Abandonment Rate, Industry Benchmark, Performance. This is a completely customizable PowerPoint theme that can be put to use immediately. So, download it and address the topic impactfully.
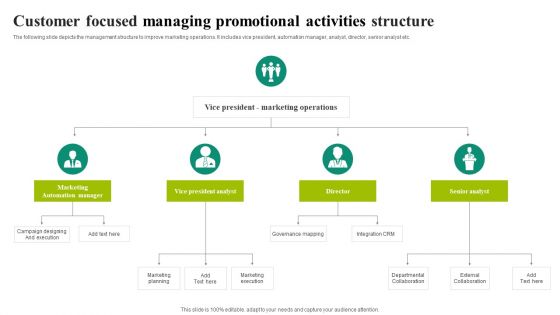
Customer Focused Managing Promotional Activities Structure Graphics PDF
The following slide depicts the management structure to improve marketing operations. It includes vice president, automation manager, analyst, director, senior analyst etc. Presenting Customer Focused Managing Promotional Activities Structure Graphics PDF to dispense important information. This template comprises three stages. It also presents valuable insights into the topics including Vice President, Marketing Operations, Senior Analyst. This is a completely customizable PowerPoint theme that can be put to use immediately. So, download it and address the topic impactfully.
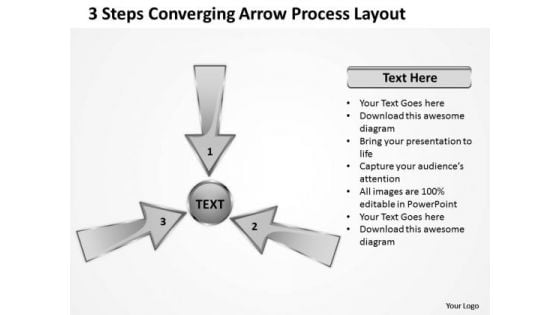
3 Steps Converging Arrow Process Layout Cycle Flow Diagram PowerPoint Templates
We present our 3 steps converging arrow process layout Cycle Flow Diagram PowerPoint templates.Download our Flow Charts PowerPoint Templates because you have the ability to think out of the box. It helps you maintain your unique identity. Download our Business PowerPoint Templates because like the famed William Tell, they put aside all emotions and concentrate on the target. Use our Shapes PowerPoint Templates because our creative template will lay down your views. Use our Success PowerPoint Templates because the choices you make today will determine the future growth of your enterprise. Present our Arrows PowerPoint Templates because Our PowerPoint Templates and Slides are conceived by a dedicated team. Use them and give form to your wondrous ideas.Use these PowerPoint slides for presentations relating to Arrow, Business, Chart, Circular, Concept, Diagram, Informative, Internet, Market, Marketing, Member, Performance, Process, Profit, Profitable, Project, Refer, Referral, Referring, Revenue, Socialize, Steps, Strategy, Web, Websites. The prominent colors used in the PowerPoint template are Black, White, Gray. People tell us our 3 steps converging arrow process layout Cycle Flow Diagram PowerPoint templates are Luxurious. Customers tell us our Market PowerPoint templates and PPT Slides are Classic. People tell us our 3 steps converging arrow process layout Cycle Flow Diagram PowerPoint templates are Efficacious. Professionals tell us our Market PowerPoint templates and PPT Slides are Endearing. Customers tell us our 3 steps converging arrow process layout Cycle Flow Diagram PowerPoint templates are Fabulous. Use our Diagram PowerPoint templates and PPT Slides will make the presenter look like a pro even if they are not computer savvy. Make your brainstorming effective with our 3 Steps Converging Arrow Process Layout Cycle Flow Diagram PowerPoint Templates. Churn out ideas to act upon.
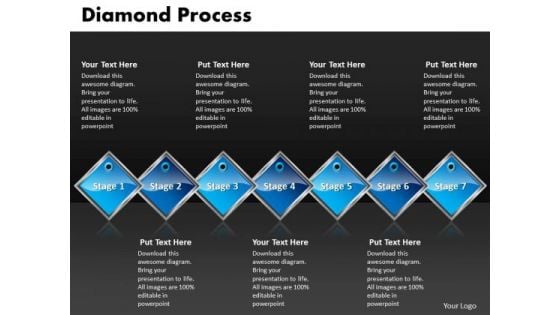
Ppt Diamond Process 7 State PowerPoint Presentation Diagram Templates
PPT diamond process 7 state powerpoint presentation diagram Templates-This chart visualize the of process steps, reoccurrences and components or of your company structure or product features.-PPT diamond process 7 state powerpoint presentation diagram Templates-Business, Button, Card, Chart, Chrome, Diamond, Figure, Graph, Graphic, Green, Label, Man, Medal, Money, Page, Podium, Presentation, Red, Round, Set, Shape, Shield, Sign, Speech, Stick, Success, Suit, Symbol, Tag, Tie, Vector In the market,customer is king. Anoint him with our Ppt Diamond Process 7 State PowerPoint Presentation Diagram Templates.
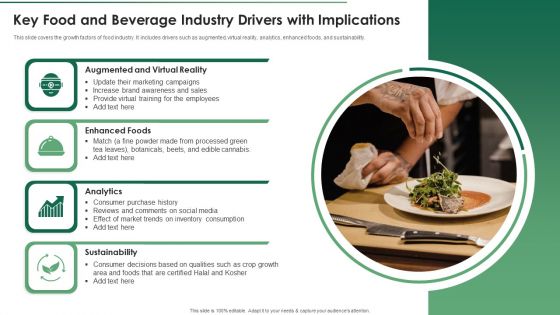
Key Food And Beverage Industry Drivers With Implications Download PDF
This slide covers the growth factors of food industry. It includes drivers such as augmented, virtual reality, analytics, enhanced foods, and sustainability Presenting Key Food And Beverage Industry Drivers With Implications Download PDF to dispense important information. This template comprises four stages. It also presents valuable insights into the topics including Analytics, Sustainability, Enhanced Foods . This is a completely customizable PowerPoint theme that can be put to use immediately. So, download it and address the topic impactfully
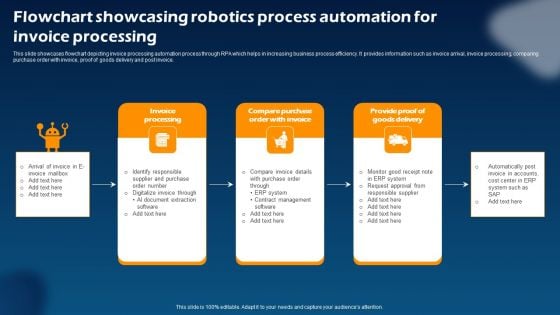
Flowchart Showcasing Robotics Process Automation For Invoice Processing Mockup PDF
This slide showcases flowchart depicting invoice processing automation process through RPA which helps in increasing business process efficiency. It provides information such as invoice arrival, invoice processing, comparing purchase order with invoice, proof of goods delivery and post invoice. Presenting Flowchart Showcasing Robotics Process Automation For Invoice Processing Mockup PDF to dispense important information. This template comprises three stages. It also presents valuable insights into the topics including Invoice Processing, Compare Purchase, Provide Proof Goods Delivery. This is a completely customizable PowerPoint theme that can be put to use immediately. So, download it and address the topic impactfully.
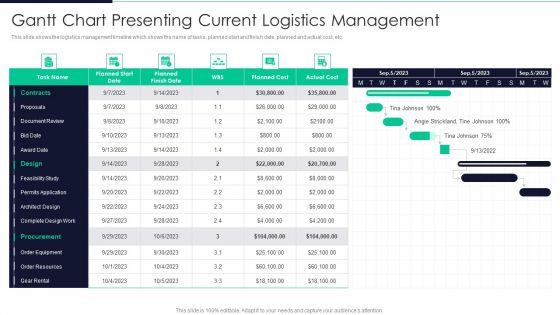
Developing Excellence In Logistics Operations Gantt Chart Presenting Current Logistics Management Topics PDF
This slide shows the logistics management timeline which shows the name of tasks, planned start and finish date, planned and actual cost, etc.Deliver and pitch your topic in the best possible manner with this Developing Excellence In Logistics Operations Gantt Chart Presenting Current Logistics Management Topics PDF Use them to share invaluable insights on Feasibility Study, Order Equipment, Order Resources and impress your audience. This template can be altered and modified as per your expectations. So, grab it now.

Website Development Plan With Key Requirements Chart Ppt Summary Clipart Images PDF
This slide shows website development outline with major requirements table. It provides information such as business, stakeholder, functional, order processing, repeated order, history, password, etc. Showcasing this set of slides titled Website Development Plan With Key Requirements Chart Ppt Summary Clipart Images PDF. The topics addressed in these templates are Business, Requirements, Executives For Evaluating. All the content presented in this PPT design is completely editable. Download it and make adjustments in color, background, font etc. as per your unique business setting.
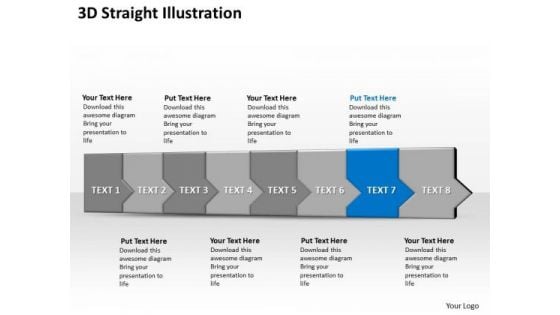
Ppt 3d Horizontal Illustration To Defend Marketing Losses Eight Steps PowerPoint Templates
PPT 3d horizontal illustration to defend marketing losses eight steps PowerPoint Templates-The theme of this PowerPoint template is linear arrows. Use them to illustrate a stepwise process or a phase structure.-PPT 3d horizontal illustration to defend marketing losses eight steps PowerPoint Templates-8 Steps, 8 Steps Diagram, Arrow, Artfulness, Chart, Circle, Circular, Circulation, Concept, Connection, Continuity, Correlate, Course, Diagram, Direction, Duplicate, Flow, Four, Iterate, Manage, Method, Order, Phase, Presentation, Procedure, Process, React, Recycle, Refresh, Relate, Repeat, Repetition, Report, Review, Section, Sequence, Simple, Stage, Step, Strategy, Success, Swirl, System, Work Flow Find the right words to convey your ideas. Get it exact with our Ppt 3d Horizontal Illustration To Defend Marketing Losses Eight Steps PowerPoint Templates.
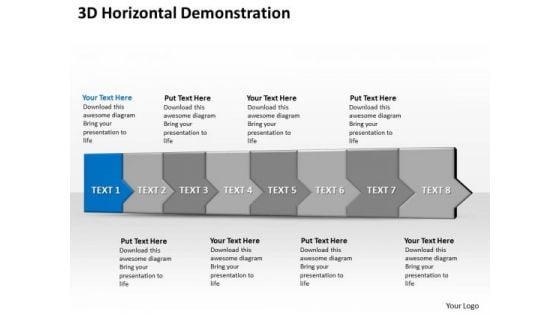
Ppt 3d Horizontal Illustration To End Marketing Losses Eight Steps PowerPoint Templates
PPT 3d horizontal illustration to end marketing losses eight steps PowerPoint Templates-The theme of this PowerPoint template is linear arrows. Use them to illustrate a stepwise process or a phase structure.-PPT 3d horizontal illustration to end marketing losses eight steps PowerPoint Templates-8 Steps, 8 Steps Diagram, Arrow, Artfulness, Chart, Circle, Circular, Circulation, Concept, Connection, Continuity, Correlate, Course, Diagram, Direction, Duplicate, Flow, Four, Iterate, Manage, Method, Order, Phase, Presentation, Procedure, Process, React, Recycle, Refresh, Relate, Repeat, Repetition, Report, Review, Section, Sequence, Simple, Stage, Step, Strategy, Success, Swirl, System, Work Flow You've found a treasure for presentations. Get goingwith our Ppt 3d Horizontal Illustration To End Marketing Losses Eight Steps PowerPoint Templates. You'll deliver your best presentation yet.

 Home
Home