Silhouette Icon
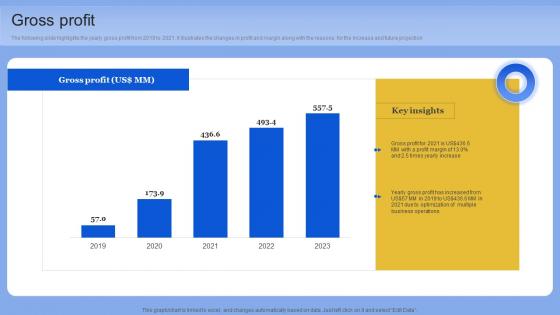
Gross Profit Data Analytics Company Outline Pictures PDF
The following slide highlights the yearly gross profit from 2019 to 2021. it illustrates the changes in profit and margin along with the reasons for the increase and future projection. Formulating a presentation can take up a lot of effort and time, so the content and message should always be the primary focus. The visuals of the PowerPoint can enhance the presenters message, so our Gross Profit Data Analytics Company Outline Pictures PDF was created to help save time. Instead of worrying about the design, the presenter can concentrate on the message while our designers work on creating the ideal templates for whatever situation is needed. Slidegeeks has experts for everything from amazing designs to valuable content, we have put everything into Gross Profit Data Analytics Company Outline Pictures PDF The following slide highlights the yearly gross profit from 2019 to 2021. it illustrates the changes in profit and margin along with the reasons for the increase and future projection
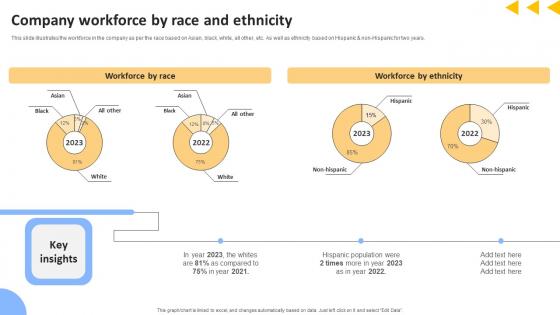
Workforce Productivity Improvement Company Workforce By Race And Ethnicity Slides Pdf
This slide illustrates the workforce in the company as per the race based on Asian, black, white, all other, etc. As well as ethnicity based on Hispanic and non Hispanic for two years. Make sure to capture your audiences attention in your business displays with our gratis customizable Workforce Productivity Improvement Company Workforce By Race And Ethnicity Slides Pdf. These are great for business strategies, office conferences, capital raising or task suggestions. If you desire to acquire more customers for your tech business and ensure they stay satisfied, create your own sales presentation with these plain slides. This slide illustrates the workforce in the company as per the race based on Asian, black, white, all other, etc. As well as ethnicity based on Hispanic and non Hispanic for two years.
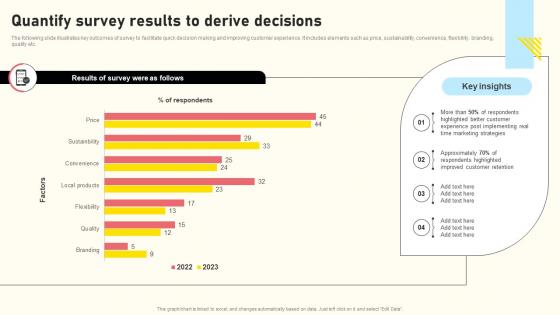
Effective Real Time Marketing Principles Quantify Survey Results To Derive Decisions Template Pdf
The following slide illustrates key outcomes of survey to facilitate quick decision making and improving customer experience. It includes elements such as price, sustainability, convenience, flexibility, branding, quality etc. Get a simple yet stunning designed Effective Real Time Marketing Principles Quantify Survey Results To Derive Decisions Template Pdf. It is the best one to establish the tone in your meetings. It is an excellent way to make your presentations highly effective. So, download this PPT today from Slidegeeks and see the positive impacts. Our easy-to-edit Effective Real Time Marketing Principles Quantify Survey Results To Derive Decisions Template Pdf can be your go-to option for all upcoming conferences and meetings. So, what are you waiting for Grab this template today. The following slide illustrates key outcomes of survey to facilitate quick decision making and improving customer experience. It includes elements such as price, sustainability, convenience, flexibility, branding, quality etc.
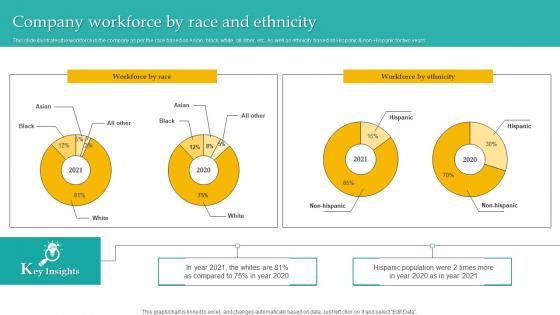
Company Workforce Race Ethnicity Administering Diversity And Inclusion At Workplace Introduction Pdf
This slide illustrates the workforce in the company as per the race based on Asian, black, white, all other, etc. As well as ethnicity based on Hispanic and non Hispanic for two years Get a simple yet stunning designed Company Workforce Race Ethnicity Administering Diversity And Inclusion At Workplace Introduction Pdf. It is the best one to establish the tone in your meetings. It is an excellent way to make your presentations highly effective. So, download this PPT today from Slidegeeks and see the positive impacts. Our easy to edit Company Workforce Race Ethnicity Administering Diversity And Inclusion At Workplace Introduction Pdf can be your go to option for all upcoming conferences and meetings. So, what are you waiting for Grab this template today. This slide illustrates the workforce in the company as per the race based on Asian, black, white, all other, etc. As well as ethnicity based on Hispanic and non Hispanic for two years
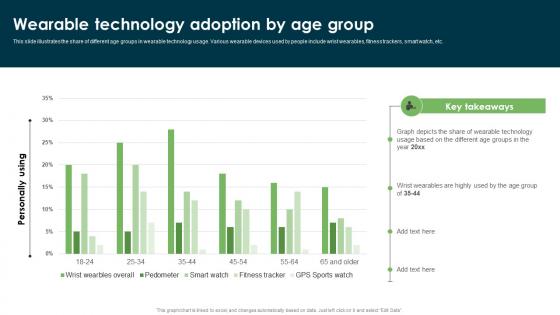
Wearable Technology Adoption By Age Group Wearable Technology Funding Slides PDF
This slide illustrates the share of different age groups in wearable technology usage. Various wearable devices used by people include wrist wearables, fitness trackers, smart watch, etc. Formulating a presentation can take up a lot of effort and time, so the content and message should always be the primary focus. The visuals of the PowerPoint can enhance the presenters message, so our Wearable Technology Adoption By Age Group Wearable Technology Funding Slides PDF was created to help save time. Instead of worrying about the design, the presenter can concentrate on the message while our designers work on creating the ideal templates for whatever situation is needed. Slidegeeks has experts for everything from amazing designs to valuable content, we have put everything into Wearable Technology Adoption By Age Group Wearable Technology Funding Slides PDF This slide illustrates the share of different age groups in wearable technology usage. Various wearable devices used by people include wrist wearables, fitness trackers, smart watch, etc.
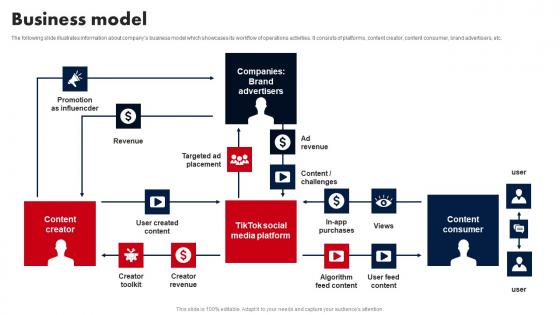
Business Model E Media Platform Investor Fund Raising Summary PDF
The following slide illustrates information about companys business model which showcases its workflow of operations activities. It consists of platforms, content creator, content consumer, brand advertisers, etc. Boost your pitch with our creative Business Model E Media Platform Investor Fund Raising Summary PDF. Deliver an awe-inspiring pitch that will mesmerize everyone. Using these presentation templates you will surely catch everyones attention. You can browse the ppts collection on our website. We have researchers who are experts at creating the right content for the templates. So you do not have to invest time in any additional work. Just grab the template now and use them. The following slide illustrates information about companys business model which showcases its workflow of operations activities. It consists of platforms, content creator, content consumer, brand advertisers, etc.
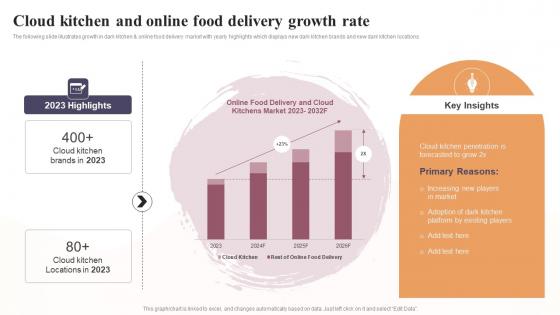
Cloud Kitchen And Online Food Delivery Growth Rate Global Virtual Restaurant Download Pdf
The following slide illustrates growth in dark kitchen and online food delivery market with yearly highlights which displays new dark kitchen brands and new dark kitchen locations. If your project calls for a presentation, then Slidegeeks is your go-to partner because we have professionally designed, easy-to-edit templates that are perfect for any presentation. After downloading, you can easily edit Cloud Kitchen And Online Food Delivery Growth Rate Global Virtual Restaurant Download Pdf and make the changes accordingly. You can rearrange slides or fill them with different images. Check out all the handy templates The following slide illustrates growth in dark kitchen and online food delivery market with yearly highlights which displays new dark kitchen brands and new dark kitchen locations.
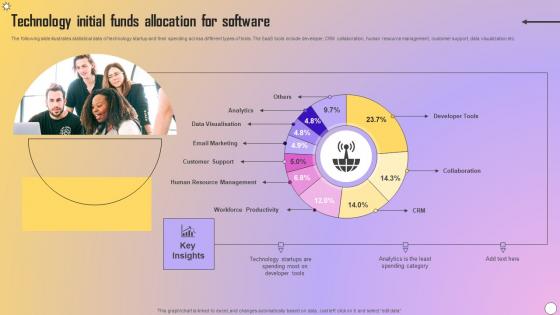
Technology Initial Funds Allocation For Software Elements Pdf
The following slide illustrates statistical data of technology startup and their spending across different types of tools. The SaaS tools include developer, CRM collaboration, human resource management, customer support, data visualization etc. Pitch your topic with ease and precision using this Technology Initial Funds Allocation For Software Elements Pdf. This layout presents information on Analytics, Data Visualisation, Email Marketing. It is also available for immediate download and adjustment. So, changes can be made in the color, design, graphics or any other component to create a unique layout. The following slide illustrates statistical data of technology startup and their spending across different types of tools. The SaaS tools include developer, CRM collaboration, human resource management, customer support, data visualization etc.
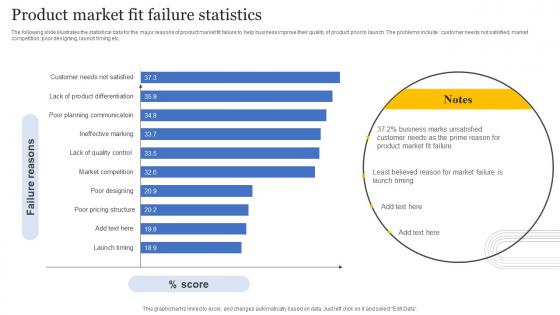
Product Market Fit Failure Statistics Professional Pdf
The following slide illustrates the statistical data for the major reasons of product market fit failure to help business improve their quality of product prior to launch. The problems include customer needs not satisfied, market competition, poor designing, launch timing etc. Pitch your topic with ease and precision using this Product Market Fit Failure Statistics Professional Pdf This layout presents information on Product Market Fit, Failure Statistics It is also available for immediate download and adjustment. So, changes can be made in the color, design, graphics or any other component to create a unique layout. The following slide illustrates the statistical data for the major reasons of product market fit failure to help business improve their quality of product prior to launch. The problems include customer needs not satisfied, market competition, poor designing, launch timing etc.
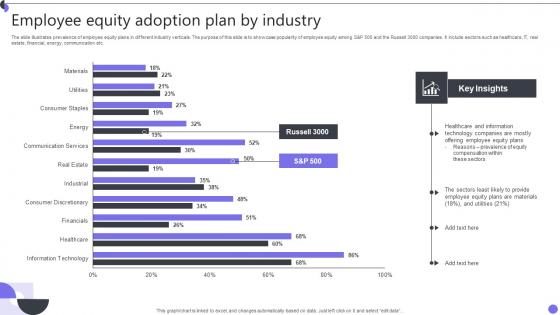
Employee Equity Adoption Plan By Industry Template Pdf
The slide illustrates prevalence of employee equity plans in different industry verticals. The purpose of this slide is to showcase popularity of employee equity among SandP 500 and the Russell 3000 companies. It include sectors such as healthcare, IT, real estate, financial, energy, communication etc. Showcasing this set of slides titled Employee Equity Adoption Plan By Industry Template Pdf The topics addressed in these templates are Healthcare Information Technology, Prevalence Equity Compensation, Employee Equity Plans . All the content presented in this PPT design is completely editable. Download it and make adjustments in color, background, font etc. as per your unique business setting. The slide illustrates prevalence of employee equity plans in different industry verticals. The purpose of this slide is to showcase popularity of employee equity among SandP 500 and the Russell 3000 companies. It include sectors such as healthcare, IT, real estate, financial, energy, communication etc.
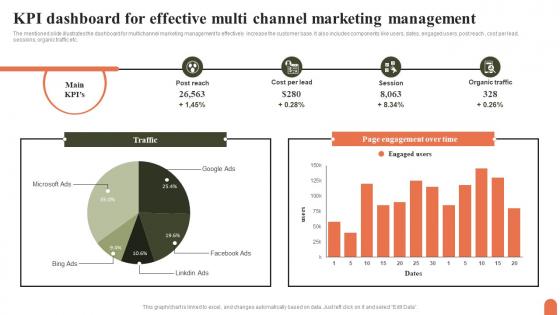
KPI Dashboard For Effective Multi Channel Marketing Management Topics Pdf
The mentioned slide illustrates the dashboard for multichannel marketing management to effectively increase the customer base. It also includes components like users, dates, engaged users, post reach , cost per lead, sessions, organic traffic etc. Showcasing this set of slides titled KPI Dashboard For Effective Multi Channel Marketing Management Topics Pdf. The topics addressed in these templates are KPI Dashboard, Effective Multi Channel, Marketing Management. All the content presented in this PPT design is completely editable. Download it and make adjustments in color, background, font etc. as per your unique business setting. The mentioned slide illustrates the dashboard for multichannel marketing management to effectively increase the customer base. It also includes components like users, dates, engaged users, post reach , cost per lead, sessions, organic traffic etc.

Multiple Step Policy Administration Process Guidelines Pdf
Following slide illustrates multi step policy development and management process which can be used by businesses to enhance workflow clarity among employee. It includes stages such as policy development, policy review, policy approval, policy communication and policy management. Showcasing this set of slides titled Multiple Step Policy Administration Process Guidelines Pdf. The topics addressed in these templates are Policy Development, Policy Review, Policy Approval. All the content presented in this PPT design is completely editable. Download it and make adjustments in color, background, font etc. as per your unique business setting. Following slide illustrates multi step policy development and management process which can be used by businesses to enhance workflow clarity among employee. It includes stages such as policy development, policy review, policy approval, policy communication and policy management.
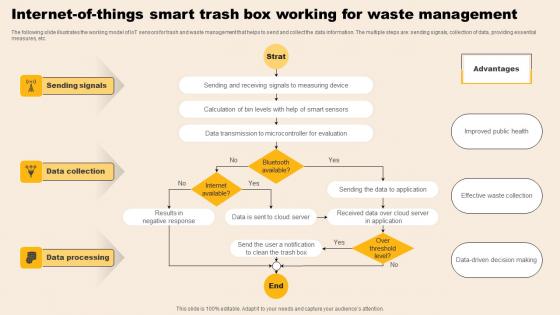
Internet Of Things Smart Trash Box Working For Waste Management Download Pdf
The following slide illustrates the working model of IoT sensors for trash and waste management that helps to send and collect the data information. The multiple steps are sending signals, collection of data, providing essential measures, etc. Showcasing this set of slides titled Internet Of Things Smart Trash Box Working For Waste Management Download Pdf. The topics addressed in these templates are Sending Signals, Collection Data, Providing Essential Measures. All the content presented in this PPT design is completely editable. Download it and make adjustments in color, background, font etc. as per your unique business setting. The following slide illustrates the working model of IoT sensors for trash and waste management that helps to send and collect the data information. The multiple steps are sending signals, collection of data, providing essential measures, etc.
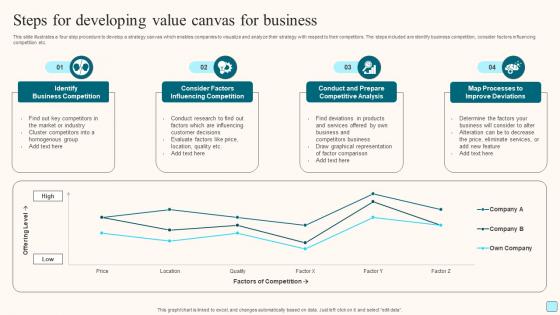
Steps For Developing Value Canvas For Business Portrait Pdf
This slide illustrates a four step procedure to develop a strategy canvas which enables companies to visualize and analyze their strategy with respect to their competitors. The steps included are identify business competition, consider factors influencing competition etc. Showcasing this set of slides titled Steps For Developing Value Canvas For Business Portrait Pdf. The topics addressed in these templates are Identify Business Competition, Prepare Competitive Analysis, Value Canvas For Business. All the content presented in this PPT design is completely editable. Download it and make adjustments in color, background, font etc. as per your unique business setting. This slide illustrates a four step procedure to develop a strategy canvas which enables companies to visualize and analyze their strategy with respect to their competitors. The steps included are identify business competition, consider factors influencing competition etc.
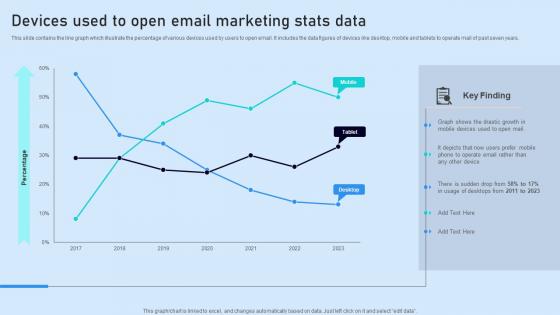
Devices Used To Open Email Marketing Stats Data Brochure Pdf
This slide contains the line graph which illustrate the percentage of various devices used by users to open email. It includes the data figures of devices like desktop, mobile and tablets to operate mail of past seven years. Pitch your topic with ease and precision using this Devices Used To Open Email Marketing Stats Data Brochure Pdf. This layout presents information on Key Finding, Stats Data, Devices. It is also available for immediate download and adjustment. So, changes can be made in the color, design, graphics or any other component to create a unique layout. This slide contains the line graph which illustrate the percentage of various devices used by users to open email. It includes the data figures of devices like desktop, mobile and tablets to operate mail of past seven years.
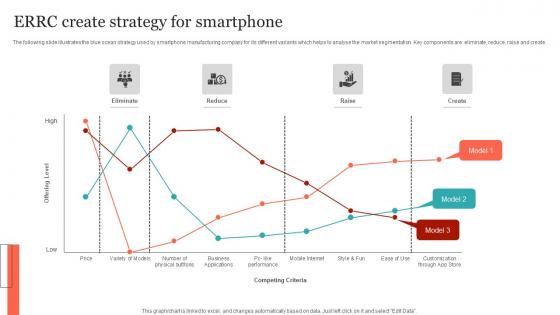
ERRC Create Strategy For Smartphone Background Pdf
The following slide illustrates the blue ocean strategy used by smartphone manufacturing company for its different variants which helps to analyse the market segmentation. Key components are eliminate, reduce, raise and create. Pitch your topic with ease and precision using this ERRC Create Strategy For Smartphone Background Pdf. This layout presents information on Eliminate, Smartphone, Raise. It is also available for immediate download and adjustment. So, changes can be made in the color, design, graphics or any other component to create a unique layout. The following slide illustrates the blue ocean strategy used by smartphone manufacturing company for its different variants which helps to analyse the market segmentation. Key components are eliminate, reduce, raise and create.
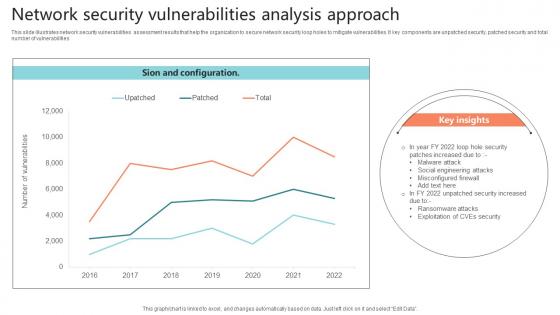
Network Security Vulnerabilities Analysis Approach Sample Pdf
This slide illustrates network security vulnerabilities assessment results that help the organization to secure network security loop holes to mitigate vulnerabilities. It key components are unpatched security, patched security and total number of vulnerabilities.Showcasing this set of slides titled Network Security Vulnerabilities Analysis Approach Sample Pdf The topics addressed in these templates are Misconfigured Firewall, Malware Attack, Social Engineering Attacks All the content presented in this PPT design is completely editable. Download it and make adjustments in color, background, font etc. as per your unique business setting. This slide illustrates network security vulnerabilities assessment results that help the organization to secure network security loop holes to mitigate vulnerabilities. It key components are unpatched security, patched security and total number of vulnerabilities
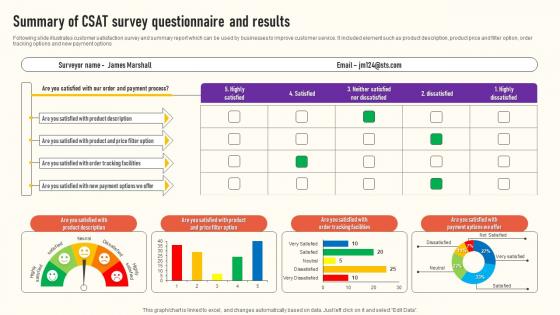
Summary Of CSAT Survey Questionnaire And Results Survey Ss
Following slide illustrates customer satisfaction survey and summary report which can be used by businesses to improve customer service. It included element such as product description, product price and filter option, order tracking options and new payment options Showcasing this set of slides titled Summary Of CSAT Survey Questionnaire And Results Survey Ss The topics addressed in these templates are Satisfied, Neither Satisfied, Dissatisfied All the content presented in this PPT design is completely editable. Download it and make adjustments in color, background, font etc. as per your unique business setting. Following slide illustrates customer satisfaction survey and summary report which can be used by businesses to improve customer service. It included element such as product description, product price and filter option, order tracking options and new payment options
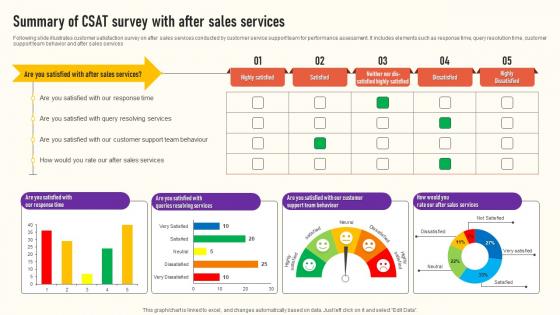
Summary Of CSAT Survey With After Sales Services Survey Ss
Following slide illustrates customer satisfaction survey on after sales services conducted by customer service support team for performance assessment. It includes elements such as response time, query resolution time, customer support team behavior and after sales services Pitch your topic with ease and precision using this Summary Of CSAT Survey With After Sales Services Survey Ss This layout presents information on Highly Satisfied, Dissatisfied, Highly Dissatisfied It is also available for immediate download and adjustment. So, changes can be made in the color, design, graphics or any other component to create a unique layout. Following slide illustrates customer satisfaction survey on after sales services conducted by customer service support team for performance assessment. It includes elements such as response time, query resolution time, customer support team behavior and after sales services
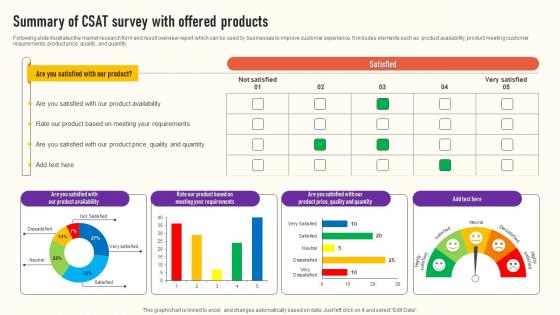
Summary Of CSAT Survey With Offered Products Survey Ss
Following slide illustrates the market research form and result overview report which can be used by businesses to improve customer experience. It includes elements such as product availability, product meeting customer requirements, product price, quality, and quantity Showcasing this set of slides titled Summary Of CSAT Survey With Offered Products Survey Ss The topics addressed in these templates are Product Availability, Satisfied, Quality And Quantity All the content presented in this PPT design is completely editable. Download it and make adjustments in color, background, font etc. as per your unique business setting. Following slide illustrates the market research form and result overview report which can be used by businesses to improve customer experience. It includes elements such as product availability, product meeting customer requirements, product price, quality, and quantity
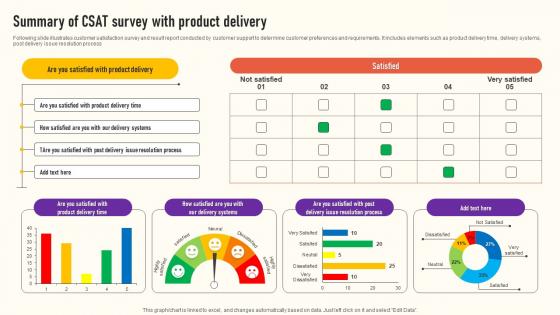
Summary Of CSAT Survey With Product Delivery Survey Ss
Following slide illustrates customer satisfaction survey and result report conducted by customer support to determine customer preferences and requirements. It includes elements such as product delivery time, delivery systems, post delivery issue resolution process Pitch your topic with ease and precision using this Summary Of CSAT Survey With Product Delivery Survey Ss This layout presents information on Delivery Systems, Resolution Process, Satisfied It is also available for immediate download and adjustment. So, changes can be made in the color, design, graphics or any other component to create a unique layout. Following slide illustrates customer satisfaction survey and result report conducted by customer support to determine customer preferences and requirements. It includes elements such as product delivery time, delivery systems, post delivery issue resolution process
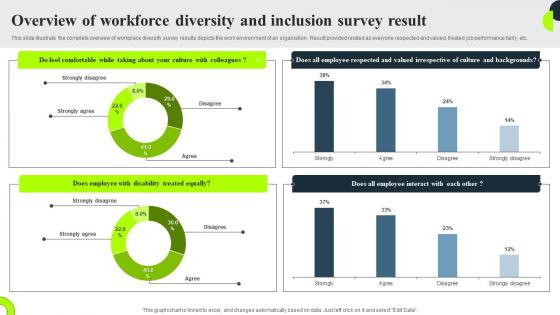
Overview Of Workforce Diversity And Inclusion Survey Result Survey Ss
This slide illustrate the complete overview of workplace diversity survey results depicts the work environment of an organistion . Result provided related as everyone respected and valued, treated job performance fairly, etc. Showcasing this set of slides titled Overview Of Workforce Diversity And Inclusion Survey Result Survey Ss The topics addressed in these templates are Comfortable, Disability Treated Equally, Valued Irrespective All the content presented in this PPT design is completely editable. Download it and make adjustments in color, background, font etc. as per your unique business setting. This slide illustrate the complete overview of workplace diversity survey results depicts the work environment of an organistion . Result provided related as everyone respected and valued, treated job performance fairly, etc.
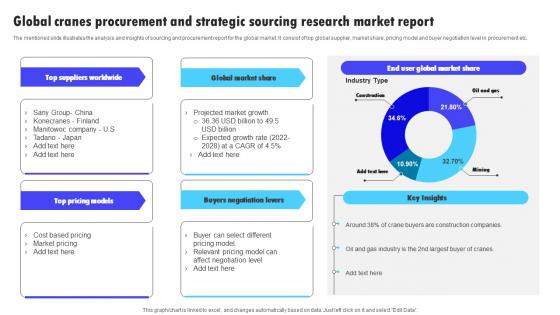
Global Cranes Procurement And Strategic Sourcing Research Market Report Inspiration Pdf
The mentioned slide illustrates the analysis and insights of sourcing and procurement report for the global market. It consist of top global supplier, market share, pricing model and buyer negotiation level in procurement etc. Showcasing this set of slides titled Global Cranes Procurement And Strategic Sourcing Research Market Report Inspiration Pdf. The topics addressed in these templates are Top Global Supplier, Market Share, Pricing Model. All the content presented in this PPT design is completely editable. Download it and make adjustments in color, background, font etc. as per your unique business setting. The mentioned slide illustrates the analysis and insights of sourcing and procurement report for the global market. It consist of top global supplier, market share, pricing model and buyer negotiation level in procurement etc.
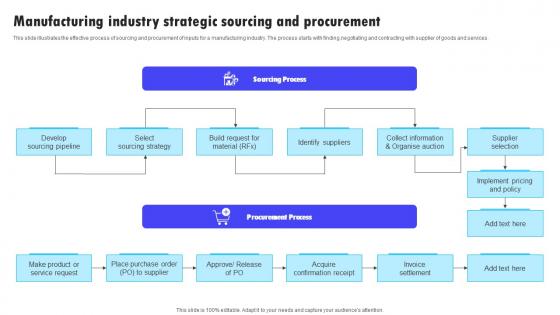
Manufacturing Industry Strategic Sourcing And Procurement Microsoft Pdf
This slide illustrates the effective process of sourcing and procurement of inputs for a manufacturing industry. The process starts with finding,negotiating and contracting with supplier of goods and services. Pitch your topic with ease and precision using this Manufacturing Industry Strategic Sourcing And Procurement Microsoft Pdf. This layout presents information on Sourcing Process, Procurement Process, Invoice Settlement. It is also available for immediate download and adjustment. So, changes can be made in the color, design, graphics or any other component to create a unique layout. This slide illustrates the effective process of sourcing and procurement of inputs for a manufacturing industry. The process starts with finding,negotiating and contracting with supplier of goods and services.
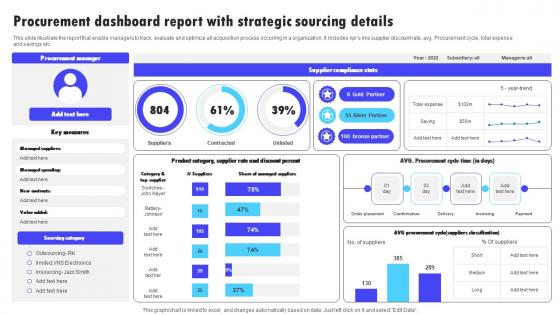
Procurement Dashboard Report With Strategic Sourcing Details Information Pdf
This slide illustrate the report that enable managers to track, evaluate and optimize all acquisition process occurring in a organization. It includes kpis like supplier discount rate, avg. Procurement cycle, total expense and savings etc. Pitch your topic with ease and precision using this Procurement Dashboard Report With Strategic Sourcing Details Information Pdf. This layout presents information on Supplier Compliance Stats, Procurement Manager, Sourcing Category. It is also available for immediate download and adjustment. So, changes can be made in the color, design, graphics or any other component to create a unique layout. This slide illustrate the report that enable managers to track, evaluate and optimize all acquisition process occurring in a organization. It includes kpis like supplier discount rate, avg. Procurement cycle, total expense and savings etc.
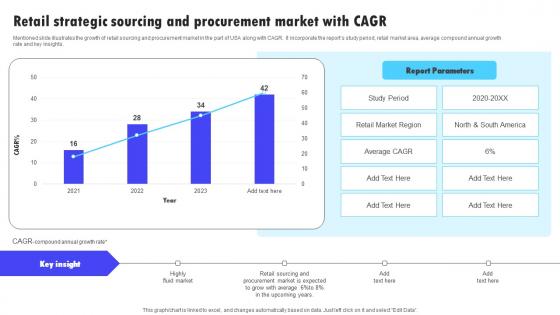
Retail Strategic Sourcing And Procurement Market With Cagr Infographics Pdf
Mentioned slide illustrates the growth of retail sourcing and procurement market in the part of USA along with CAGR. It incorporate the reports study period, retail market area, average compound annual growth rate and key insights. Showcasing this set of slides titled Retail Strategic Sourcing And Procurement Market With Cagr Infographics Pdf. The topics addressed in these templates are Reports Study Period, Retail Market Area, Average Compound0. All the content presented in this PPT design is completely editable. Download it and make adjustments in color, background, font etc. as per your unique business setting. Mentioned slide illustrates the growth of retail sourcing and procurement market in the part of USA along with CAGR. It incorporate the reports study period, retail market area, average compound annual growth rate and key insights.
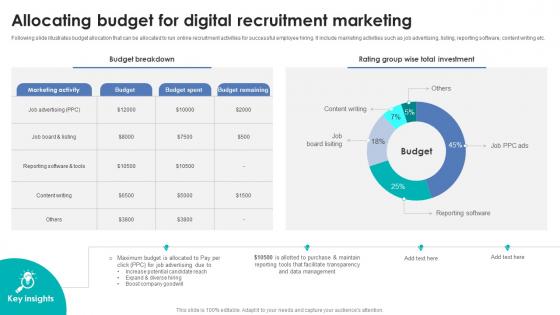
Integrating Automation For Effective Business Allocating Budget For Digital Recruitment Marketing
Following slide illustrates budget allocation that can be allocated to run online recruitment activities for successful employee hiring. It include marketing activities such as job advertising, listing, reporting software, content writing etc. Want to ace your presentation in front of a live audience Our Integrating Automation For Effective Business Allocating Budget For Digital Recruitment Marketing can help you do that by engaging all the users towards you. Slidegeeks experts have put their efforts and expertise into creating these impeccable powerpoint presentations so that you can communicate your ideas clearly. Moreover, all the templates are customizable, and easy-to-edit and downloadable. Use these for both personal and commercial use. Following slide illustrates budget allocation that can be allocated to run online recruitment activities for successful employee hiring. It include marketing activities such as job advertising, listing, reporting software, content writing etc.
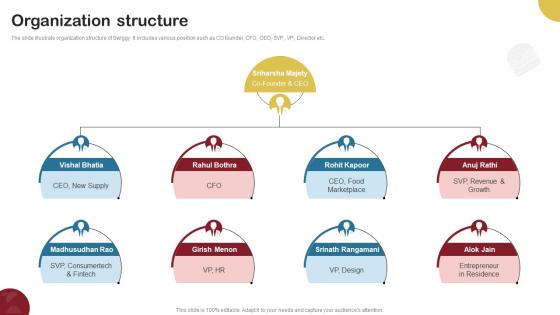
Organization Structure Food Delivery Company Profile CP SS V
The slide illustrate organization structure of Swiggy. It includes various position such as CO founder, CFO, CEO, SVP, VP, Director etc. The Organization Structure Food Delivery Company Profile CP SS V is a compilation of the most recent design trends as a series of slides. It is suitable for any subject or industry presentation, containing attractive visuals and photo spots for businesses to clearly express their messages. This template contains a variety of slides for the user to input data, such as structures to contrast two elements, bullet points, and slides for written information. Slidegeeks is prepared to create an impression. The slide illustrate organization structure of Swiggy. It includes various position such as CO founder, CFO, CEO, SVP, VP, Director etc.
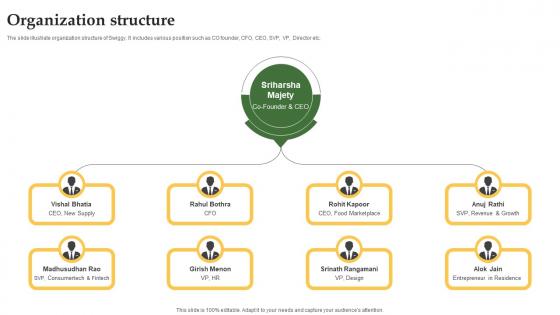
Organization Structure Grocery Delivery Company Profile CP SS V
The slide illustrate organization structure of Swiggy. It includes various position such as CO founder, CFO, CEO, SVP, VP, Director etc. The Organization Structure Grocery Delivery Company Profile CP SS V is a compilation of the most recent design trends as a series of slides. It is suitable for any subject or industry presentation, containing attractive visuals and photo spots for businesses to clearly express their messages. This template contains a variety of slides for the user to input data, such as structures to contrast two elements, bullet points, and slides for written information. Slidegeeks is prepared to create an impression. The slide illustrate organization structure of Swiggy. It includes various position such as CO founder, CFO, CEO, SVP, VP, Director etc.

Product Analytics Dashboard To Track Engagement Driving Business Success Integrating Product
This slide illustrates a dashboard to monitor customer engagement on company website by leveraging product analytics tools aimed at making necessary improvements. It covers insights regarding active monthly users, new users, total completed purchases, screen views, average duration of session, etc. There are so many reasons you need a Product Analytics Dashboard To Track Engagement Driving Business Success Integrating Product. The first reason is you can not spend time making everything from scratch, Thus, Slidegeeks has made presentation templates for you too. You can easily download these templates from our website easily. This slide illustrates a dashboard to monitor customer engagement on company website by leveraging product analytics tools aimed at making necessary improvements. It covers insights regarding active monthly users, new users, total completed purchases, screen views, average duration of session, etc.
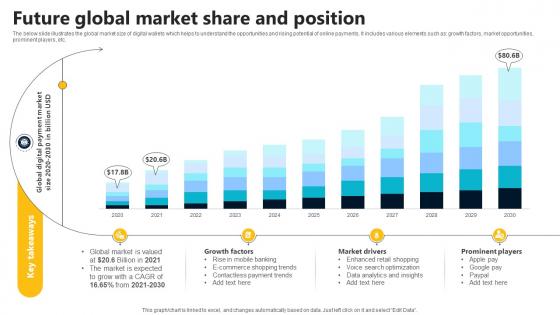
Future Global Market Share And Position In Depth Guide To Digital Wallets Fin SS V
The below slide illustrates the global market size of digital wallets which helps to understand the opportunities and rising potential of online payments. It includes various elements such as growth factors, market opportunities, prominent players, etc. This modern and well-arranged Future Global Market Share And Position In Depth Guide To Digital Wallets Fin SS V provides lots of creative possibilities. It is very simple to customize and edit with the Powerpoint Software. Just drag and drop your pictures into the shapes. All facets of this template can be edited with Powerpoint, no extra software is necessary. Add your own material, put your images in the places assigned for them, adjust the colors, and then you can show your slides to the world, with an animated slide included. The below slide illustrates the global market size of digital wallets which helps to understand the opportunities and rising potential of online payments. It includes various elements such as growth factors, market opportunities, prominent players, etc.
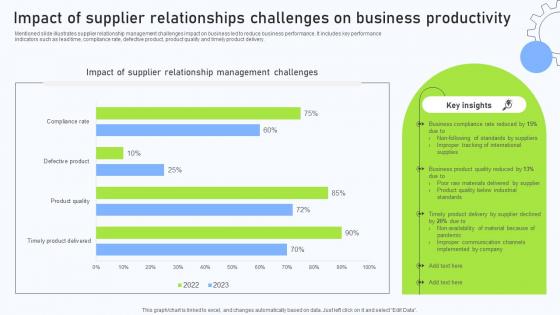
Relationship Management Automation Software Impact Of Supplier Relationships Challenges
Mentioned slide illustrates supplier relationship management challenges impact on business led to reduce business performance. It includes key performance indicators such as lead time, compliance rate, defective product, product quality and timely product delivery. Slidegeeks is one of the best resources for PowerPoint templates. You can download easily and regulate Relationship Management Automation Software Impact Of Supplier Relationships Challenges for your personal presentations from our wonderful collection. A few clicks is all it takes to discover and get the most relevant and appropriate templates. Use our Templates to add a unique zing and appeal to your presentation and meetings. All the slides are easy to edit and you can use them even for advertisement purposes. Mentioned slide illustrates supplier relationship management challenges impact on business led to reduce business performance. It includes key performance indicators such as lead time, compliance rate, defective product, product quality and timely product delivery.

Digital Approach To Client Digital Banking Dashboard Showcasing Transaction
This slide showcases dashboard which illustrates performance of digital wallet and payment cards used for online banking. It provides information regarding network volume, debit and credit card performance, cards weekly transaction volume, value and network value. This modern and well-arranged Digital Approach To Client Digital Banking Dashboard Showcasing Transaction provides lots of creative possibilities. It is very simple to customize and edit with the Powerpoint Software. Just drag and drop your pictures into the shapes. All facets of this template can be edited with Powerpoint, no extra software is necessary. Add your own material, put your images in the places assigned for them, adjust the colors, and then you can show your slides to the world, with an animated slide included. This slide showcases dashboard which illustrates performance of digital wallet and payment cards used for online banking. It provides information regarding network volume, debit and credit card performance, cards weekly transaction volume, value and network value.

Product Analytics Dashboard To Track Engagement Product Analytics Implementation Data Analytics V
This slide illustrates a dashboard to monitor customer engagement on company website by leveraging product analytics tools aimed at making necessary improvements. It covers insights regarding active monthly users, new users, total completed purchases, screen views, average duration of session, etc Want to ace your presentation in front of a live audience Our Product Analytics Dashboard To Track Engagement Product Analytics Implementation Data Analytics V can help you do that by engaging all the users towards you. Slidegeeks experts have put their efforts and expertise into creating these impeccable powerpoint presentations so that you can communicate your ideas clearly. Moreover, all the templates are customizable, and easy-to-edit and downloadable. Use these for both personal and commercial use. This slide illustrates a dashboard to monitor customer engagement on company website by leveraging product analytics tools aimed at making necessary improvements. It covers insights regarding active monthly users, new users, total completed purchases, screen views, average duration of session, etc
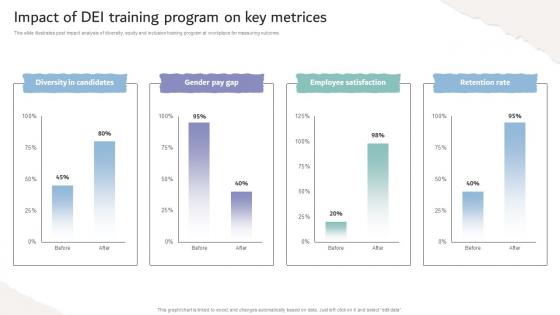
Inclusive Workplace Training Program Impact Of Dei Training Program On Key Metrices DTE SS V
This slide illustrates post impact analysis of diversity, equity and inclusion training program at workplace for measuring outcome. Formulating a presentation can take up a lot of effort and time, so the content and message should always be the primary focus. The visuals of the PowerPoint can enhance the presenters message, so our Inclusive Workplace Training Program Impact Of Dei Training Program On Key Metrices DTE SS V was created to help save time. Instead of worrying about the design, the presenter can concentrate on the message while our designers work on creating the ideal templates for whatever situation is needed. Slidegeeks has experts for everything from amazing designs to valuable content, we have put everything into Inclusive Workplace Training Program Impact Of Dei Training Program On Key Metrices DTE SS V. This slide illustrates post impact analysis of diversity, equity and inclusion training program at workplace for measuring outcome.
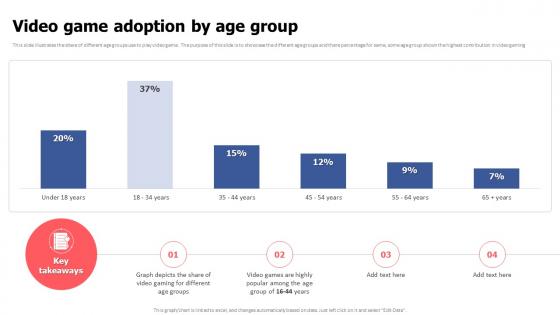
Video Game Adoption By Age Group Video Game Financing Pitch Deck
This slide illustrates the share of different age groups use to play video game. The purpose of this slide is to showcase the different age groups and there percentage for same, some age group shown the highest contribution in video gaming. The best PPT templates are a great way to save time, energy, and resources. Slidegeeks have 100 percent editable powerpoint slides making them incredibly versatile. With these quality presentation templates, you can create a captivating and memorable presentation by combining visually appealing slides and effectively communicating your message. Download Video Game Adoption By Age Group Video Game Financing Pitch Deck from Slidegeeks and deliver a wonderful presentation. This slide illustrates the share of different age groups use to play video game. The purpose of this slide is to showcase the different age groups and there percentage for same, some age group shown the highest contribution in video gaming.
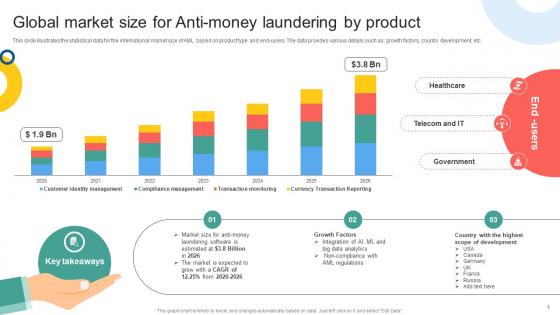
Global Market Size For Anti Money Laundering Mapping Out The Anti Money Fin SS V
This slide illustrates the statistical data for the international market size of AML based on product type and end-users. The data provides various details such as growth factors, country development, etc. Explore a selection of the finest Global Market Size For Anti Money Laundering Mapping Out The Anti Money Fin SS V here. With a plethora of professionally designed and pre-made slide templates, you can quickly and easily find the right one for your upcoming presentation. You can use our Global Market Size For Anti Money Laundering Mapping Out The Anti Money Fin SS V to effectively convey your message to a wider audience. Slidegeeks has done a lot of research before preparing these presentation templates. The content can be personalized and the slides are highly editable. Grab templates today from Slidegeeks. This slide illustrates the statistical data for the international market size of AML based on product type and end-users. The data provides various details such as growth factors, country development, etc.
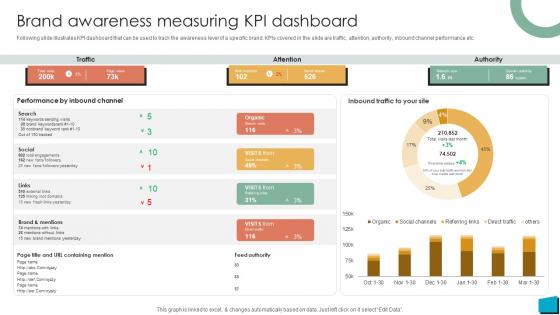
Brand Authority Brand Awareness Measuring KPI Dashboard Strategy SS V
Following slide illustrates KPI dashboard that can be used to track the awareness level of a specific brand. KPIs covered in the slide are traffic, attention, authority, inbound channel performance etc. Do you have to make sure that everyone on your team knows about any specific topic I yes, then you should give Brand Authority Brand Awareness Measuring KPI Dashboard Strategy SS V a try. Our experts have put a lot of knowledge and effort into creating this impeccable Brand Authority Brand Awareness Measuring KPI Dashboard Strategy SS V. You can use this template for your upcoming presentations, as the slides are perfect to represent even the tiniest detail. You can download these templates from the Slidegeeks website and these are easy to edit. So grab these today Following slide illustrates KPI dashboard that can be used to track the awareness level of a specific brand. KPIs covered in the slide are traffic, attention, authority, inbound channel performance etc.
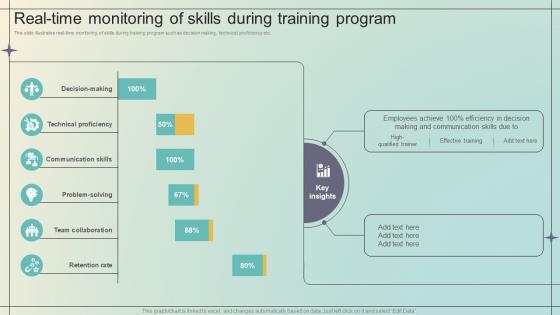
Immersive Training For Practical Real Time Monitoring Of Skills During Training Program DTE SS V
This slide illustrates real-time monitoring of skills during training program such as decision making, technical proficiency etc. This modern and well-arranged Immersive Training For Practical Real Time Monitoring Of Skills During Training Program DTE SS V provides lots of creative possibilities. It is very simple to customize and edit with the Powerpoint Software. Just drag and drop your pictures into the shapes. All facets of this template can be edited with Powerpoint, no extra software is necessary. Add your own material, put your images in the places assigned for them, adjust the colors, and then you can show your slides to the world, with an animated slide included. This slide illustrates real-time monitoring of skills during training program such as decision making, technical proficiency etc.

Video Game Adoption By Age Group Cloud Game Development Fundraising Pitch Deck
This slide illustrates the share of different age groups use to play video game. The purpose of this slide is to showcase the different age groups and there percentage for same, some age group shown the highest contribution in video gaming. The best PPT templates are a great way to save time, energy, and resources. Slidegeeks have 100 percent editable powerpoint slides making them incredibly versatile. With these quality presentation templates, you can create a captivating and memorable presentation by combining visually appealing slides and effectively communicating your message. Download Video Game Adoption By Age Group Cloud Game Development Fundraising Pitch Deck from Slidegeeks and deliver a wonderful presentation. This slide illustrates the share of different age groups use to play video game. The purpose of this slide is to showcase the different age groups and there percentage for same, some age group shown the highest contribution in video gaming.
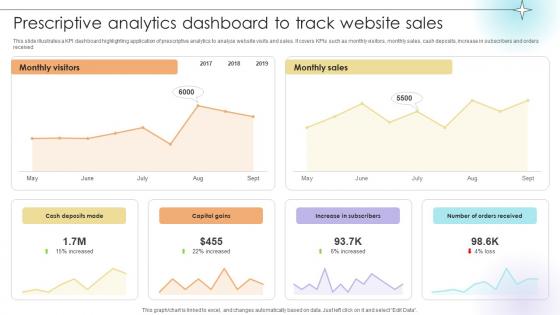
Prescriptive Analytics Dashboard To Track Website Sales Data Analytics SS V
This slide illustrates a KPI dashboard highlighting application of prescriptive analytics to analyze website visits and sales. It covers KPIs such as monthly visitors, monthly sales, cash deposits, increase in subscribers and orders received.This modern and well-arranged Prescriptive Analytics Dashboard To Track Website Sales Data Analytics SS V provides lots of creative possibilities. It is very simple to customize and edit with the Powerpoint Software. Just drag and drop your pictures into the shapes. All facets of this template can be edited with Powerpoint, no extra software is necessary. Add your own material, put your images in the places assigned for them, adjust the colors, and then you can show your slides to the world, with an animated slide included. This slide illustrates a KPI dashboard highlighting application of prescriptive analytics to analyze website visits and sales. It covers KPIs such as monthly visitors, monthly sales, cash deposits, increase in subscribers and orders received.
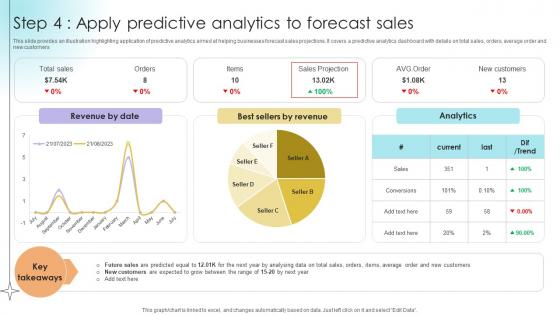
Step 4 Apply Predictive Analytics To Forecast Sales Data Analytics SS V
This slide provides an illustration highlighting application of predictive analytics aimed at helping businesses forecast sales projections. It covers a predictive analytics dashboard with details on total sales, orders, average order and new customers.Coming up with a presentation necessitates that the majority of the effort goes into the content and the message you intend to convey. The visuals of a PowerPoint presentation can only be effective if it supplements and supports the story that is being told. Keeping this in mind our experts created Step 4 Apply Predictive Analytics To Forecast Sales Data Analytics SS V to reduce the time that goes into designing the presentation. This way, you can concentrate on the message while our designers take care of providing you with the right template for the situation. This slide provides an illustration highlighting application of predictive analytics aimed at helping businesses forecast sales projections. It covers a predictive analytics dashboard with details on total sales, orders, average order and new customers.
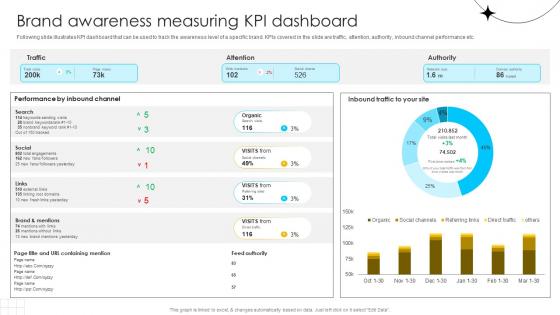
Brand Influence Brand Awareness Measuring KPI Dashboard Strategy SS V
Following slide illustrates KPI dashboard that can be used to track the awareness level of a specific brand. KPIs covered in the slide are traffic, attention, authority, inbound channel performance etc. Do you have to make sure that everyone on your team knows about any specific topic I yes, then you should give Brand Influence Brand Awareness Measuring KPI Dashboard Strategy SS V a try. Our experts have put a lot of knowledge and effort into creating this impeccable Brand Influence Brand Awareness Measuring KPI Dashboard Strategy SS V. You can use this template for your upcoming presentations, as the slides are perfect to represent even the tiniest detail. You can download these templates from the Slidegeeks website and these are easy to edit. So grab these today Following slide illustrates KPI dashboard that can be used to track the awareness level of a specific brand. KPIs covered in the slide are traffic, attention, authority, inbound channel performance etc.
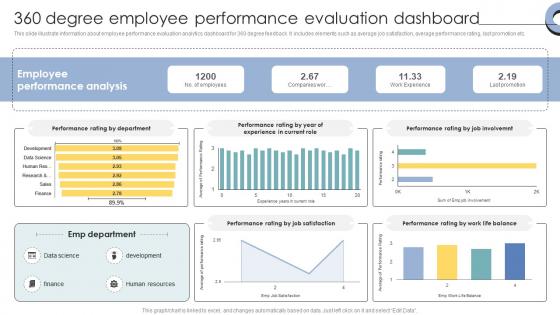
Skill Enhancement Performance 360 Degree Employee Performance Evaluation Dashboard
This slide illustrate information about employee performance evaluation analytics dashboard for 360 degree feedback. It includes elements such as average job satisfaction, average performance rating, last promotion etc. If your project calls for a presentation, then Slidegeeks is your go-to partner because we have professionally designed, easy-to-edit templates that are perfect for any presentation. After downloading, you can easily edit Skill Enhancement Performance 360 Degree Employee Performance Evaluation Dashboard and make the changes accordingly. You can rearrange slides or fill them with different images. Check out all the handy templates This slide illustrate information about employee performance evaluation analytics dashboard for 360 degree feedback. It includes elements such as average job satisfaction, average performance rating, last promotion etc.
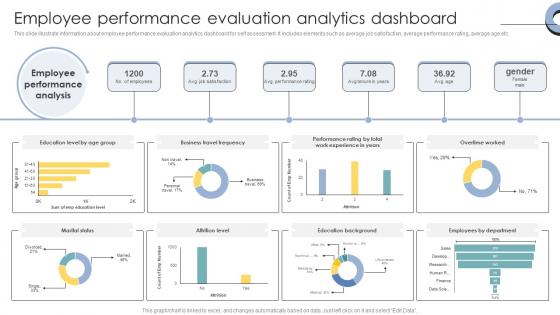
Skill Enhancement Performance Employee Performance Evaluation Analytics Dashboard
This slide illustrate information about employee performance evaluation analytics dashboard for self assessment. It includes elements such as average job satisfaction, average performance rating, average age etc. Presenting this PowerPoint presentation, titled Skill Enhancement Performance Employee Performance Evaluation Analytics Dashboard, with topics curated by our researchers after extensive research. This editable presentation is available for immediate download and provides attractive features when used. Download now and captivate your audience. Presenting this Skill Enhancement Performance Employee Performance Evaluation Analytics Dashboard. Our researchers have carefully researched and created these slides with all aspects taken into consideration. This is a completely customizable Skill Enhancement Performance Employee Performance Evaluation Analytics Dashboard that is available for immediate downloading. Download now and make an impact on your audience. Highlight the attractive features available with our PPTs. This slide illustrate information about employee performance evaluation analytics dashboard for self assessment. It includes elements such as average job satisfaction, average performance rating, average age etc.
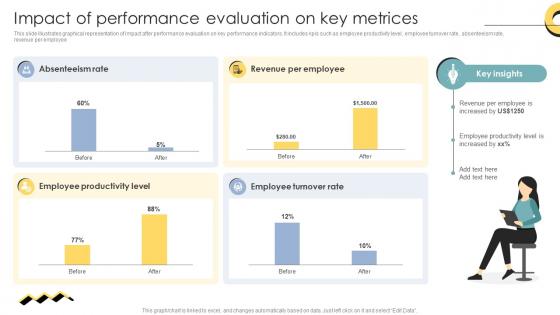
Skill Enhancement Performance Impact Of Performance Evaluation On Key Metrices
This slide illustrates graphical representation of impact after performance evaluation on key performance indicators. It includes kpis such as employee productivity level, employee turnover rate, absenteeism rate, revenue per employee. Do you have to make sure that everyone on your team knows about any specific topic I yes, then you should give Skill Enhancement Performance Impact Of Performance Evaluation On Key Metrices a try. Our experts have put a lot of knowledge and effort into creating this impeccable Skill Enhancement Performance Impact Of Performance Evaluation On Key Metrices. You can use this template for your upcoming presentations, as the slides are perfect to represent even the tiniest detail. You can download these templates from the Slidegeeks website and these are easy to edit. So grab these today This slide illustrates graphical representation of impact after performance evaluation on key performance indicators. It includes kpis such as employee productivity level, employee turnover rate, absenteeism rate, revenue per employee.

Workforce Competency Enhancement Impact Of Cloud Training On Organization Performance DTE SS V
This slide illustrate impact of cloud training on organization performance such as decrease in project delays, high conversion rate etc. Formulating a presentation can take up a lot of effort and time, so the content and message should always be the primary focus. The visuals of the PowerPoint can enhance the presenters message, so our Workforce Competency Enhancement Impact Of Cloud Training On Organization Performance DTE SS V was created to help save time. Instead of worrying about the design, the presenter can concentrate on the message while our designers work on creating the ideal templates for whatever situation is needed. Slidegeeks has experts for everything from amazing designs to valuable content, we have put everything into Workforce Competency Enhancement Impact Of Cloud Training On Organization Performance DTE SS V This slide illustrate impact of cloud training on organization performance such as decrease in project delays, high conversion rate etc.
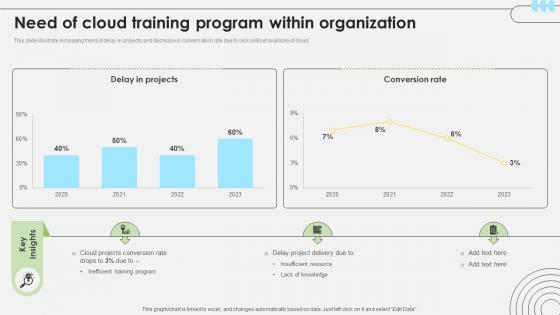
Workforce Competency Enhancement Need Of Cloud Training Program Within Organization DTE SS V
This slide illustrate increasing trend of delay in projects and decrease in conversation rate due to lack skillset available of cloud. The Workforce Competency Enhancement Need Of Cloud Training Program Within Organization DTE SS V is a compilation of the most recent design trends as a series of slides. It is suitable for any subject or industry presentation, containing attractive visuals and photo spots for businesses to clearly express their messages. This template contains a variety of slides for the user to input data, such as structures to contrast two elements, bullet points, and slides for written information. Slidegeeks is prepared to create an impression. This slide illustrate increasing trend of delay in projects and decrease in conversation rate due to lack skillset available of cloud.
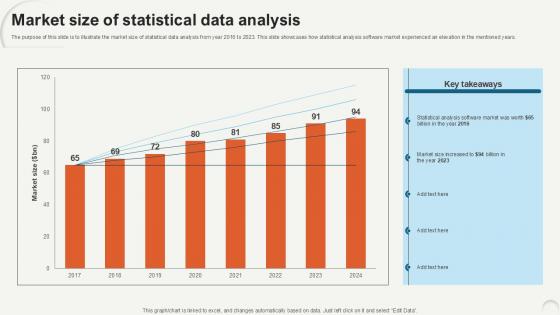
Market Size Of Statistical Data Analytics For Informed Decision Ppt Template
The purpose of this slide is to illustrate the market size of statistical data analysis from year 2016 to 2023. This slide showcases how statistical analysis software market experienced an elevation in the mentioned years. Explore a selection of the finest Market Size Of Statistical Data Analytics For Informed Decision Ppt Template here. With a plethora of professionally designed and pre-made slide templates, you can quickly and easily find the right one for your upcoming presentation. You can use our Market Size Of Statistical Data Analytics For Informed Decision Ppt Template to effectively convey your message to a wider audience. Slidegeeks has done a lot of research before preparing these presentation templates. The content can be personalized and the slides are highly editable. Grab templates today from Slidegeeks. The purpose of this slide is to illustrate the market size of statistical data analysis from year 2016 to 2023. This slide showcases how statistical analysis software market experienced an elevation in the mentioned years.
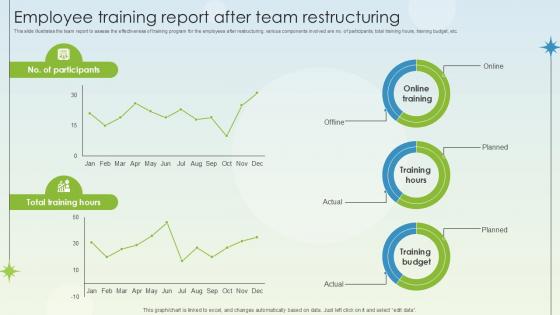
Employee Training Report After Team Restructuring Business Growth Ppt Slides
This slide illustrates the team report to assess the effectiveness of training program for the employees after restructuring. various components involved are no. of participants, total training hours, training budget, etc. Want to ace your presentation in front of a live audience Our Employee Training Report After Team Restructuring Business Growth Ppt Slides can help you do that by engaging all the users towards you. Slidegeeks experts have put their efforts and expertise into creating these impeccable powerpoint presentations so that you can communicate your ideas clearly. Moreover, all the templates are customizable, and easy-to-edit and downloadable. Use these for both personal and commercial use. This slide illustrates the team report to assess the effectiveness of training program for the employees after restructuring. various components involved are no. of participants, total training hours, training budget, etc.
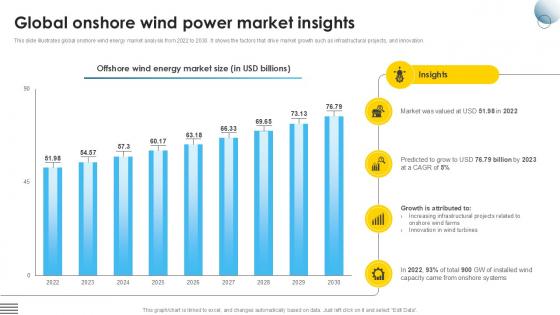
Global Onshore Wind Power Market Global Wind Power Market PPT Slide IR SS V
This slide illustrates global onshore wind energy market analysis from 2022 to 2030. It shows the factors that drive market growth such as infrastructural projects, and innovation. Do you have an important presentation coming up Are you looking for something that will make your presentation stand out from the rest Look no further than Global Onshore Wind Power Market Global Wind Power Market PPT Slide IR SS V. With our professional designs, you can trust that your presentation will pop and make delivering it a smooth process. And with Slidegeeks, you can trust that your presentation will be unique and memorable. So why wait Grab Global Onshore Wind Power Market Global Wind Power Market PPT Slide IR SS V today and make your presentation stand out from the rest This slide illustrates global onshore wind energy market analysis from 2022 to 2030. It shows the factors that drive market growth such as infrastructural projects, and innovation.
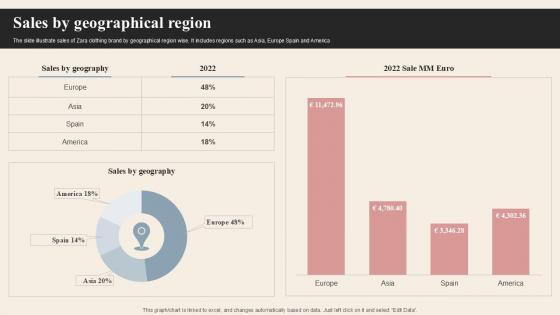
Sales By Geographical Region Branded Clothing Company Profile PPT Example CP SS V
The slide illustrate sales of Zara clothing brand by geographical region wise. It includes regions such as Asia, Europe Spain and America. Here you can discover an assortment of the finest PowerPoint and Google Slides templates. With these templates, you can create presentations for a variety of purposes while simultaneously providing your audience with an eye-catching visual experience. Download Sales By Geographical Region Branded Clothing Company Profile PPT Example CP SS V to deliver an impeccable presentation. These templates will make your job of preparing presentations much quicker, yet still, maintain a high level of quality. Slidegeeks has experienced researchers who prepare these templates and write high-quality content for you. Later on, you can personalize the content by editing the Sales By Geographical Region Branded Clothing Company Profile PPT Example CP SS V. The slide illustrate sales of Zara clothing brand by geographical region wise. It includes regions such as Asia, Europe Spain and America.
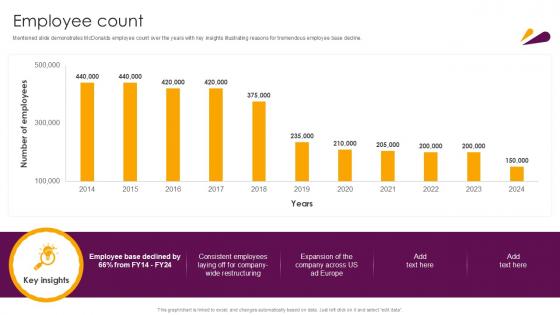
Employee Count Food And Beverages Company Profile Ppt Example CP SS V
Mentioned slide demonstrates McDonalds employee count over the years with key insights illustrating reasons for tremendous employee base decline. Are you in need of a template that can accommodate all of your creative concepts This one is crafted professionally and can be altered to fit any style. Use it with Google Slides or PowerPoint. Include striking photographs, symbols, depictions, and other visuals. Fill, move around, or remove text boxes as desired. Test out color palettes and font mixtures. Edit and save your work, or work with colleagues. Download Employee Count Food And Beverages Company Profile Ppt Example CP SS V and observe how to make your presentation outstanding. Give an impeccable presentation to your group and make your presentation unforgettable. Mentioned slide demonstrates McDonalds employee count over the years with key insights illustrating reasons for tremendous employee base decline.
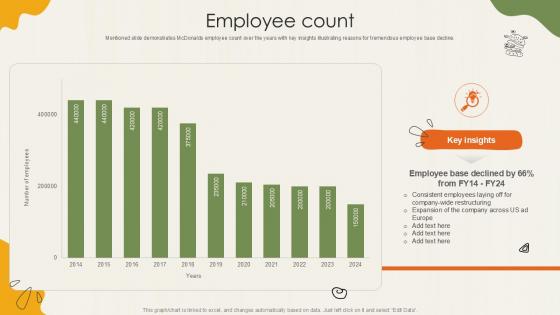
Employee Count Food Retailer Company Profile Ppt Slide CP SS V
Mentioned slide demonstrates McDonalds employee count over the years with key insights illustrating reasons for tremendous employee base decline. Present like a pro with Employee Count Food Retailer Company Profile Ppt Slide CP SS V Create beautiful presentations together with your team, using our easy-to-use presentation slides. Share your ideas in real-time and make changes on the fly by downloading our templates. So whether you are in the office, on the go, or in a remote location, you can stay in sync with your team and present your ideas with confidence. With Slidegeeks presentation got a whole lot easier. Grab these presentations today. Mentioned slide demonstrates McDonalds employee count over the years with key insights illustrating reasons for tremendous employee base decline.

Impact Of Marketing On Patient Conversion Rate Implementation Of Online Ppt Sample
This slide illustrates the positive impact of marketing strategies on the hospitals conversion rate. It includes a conversion report for 5 years 2019 2023 highlighting the increase in the rate The Impact Of Marketing On Patient Conversion Rate Implementation Of Online Ppt Sample is a compilation of the most recent design trends as a series of slides. It is suitable for any subject or industry presentation, containing attractive visuals and photo spots for businesses to clearly express their messages. This template contains a variety of slides for the user to input data, such as structures to contrast two elements, bullet points, and slides for written information. Slidegeeks is prepared to create an impression. This slide illustrates the positive impact of marketing strategies on the hospitals conversion rate. It includes a conversion report for 5 years 2019 2023 highlighting the increase in the rate
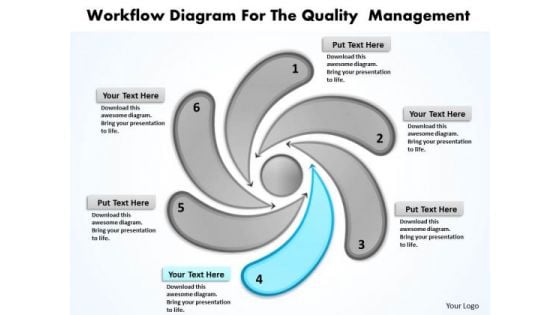
Business Analysis Diagrams Workflow For The Quality Management PowerPoint Slides
We present our business analysis diagrams workflow for the quality management PowerPoint Slides.Use our Advertising PowerPoint Templates because you have the right arrows in your quiver. Present our Business PowerPoint Templates because your ideas too are pinpointedly focused on you goals. Download and present our Marketing PowerPoint Templates because The marketplace is the merger of your dreams and your ability. Download and present our Finance PowerPoint Templates because Our Template designs are State of the Art. Use our Shapes PowerPoint Templates because with the help of our Slides you can Illustrate these thoughts with this slide.Use these PowerPoint slides for presentations relating to Action, Analysis, Attitude, Business, Chart, Classroom, Concept, Conceptual, Conference, Connection, Corporate, Design, Diagram, Direction, Element, Financial, Formula, Future, Management, Market, Marketing, Mind, Mind Map, Organization, Organize, Plan, Process, Product, Relation, Render, Solutions, Strategy, Success, Successful, Target, Text. The prominent colors used in the PowerPoint template are Blue, Gray, Black. PowerPoint presentation experts tell us our business analysis diagrams workflow for the quality management PowerPoint Slides will impress their bosses and teams. Professionals tell us our Chart PowerPoint templates and PPT Slides are Pleasant. People tell us our business analysis diagrams workflow for the quality management PowerPoint Slides are Breathtaking. We assure you our Conceptual PowerPoint templates and PPT Slides are Splendid. PowerPoint presentation experts tell us our business analysis diagrams workflow for the quality management PowerPoint Slides are visually appealing. Professionals tell us our Concept PowerPoint templates and PPT Slides are Romantic. Our Business Analysis Diagrams Workflow For The Quality Management PowerPoint Slides make great allies. They uphold your faith in them.

Business Process Workflow Diagram Examples Templates 2010 PowerPoint
We present our business process workflow diagram examples templates 2010 PowerPoint.Download our Advertising PowerPoint Templates because It will let you Set new benchmarks with our PowerPoint Templates and Slides. They will keep your prospects well above par. Download and present our Arrows PowerPoint Templates because Our PowerPoint Templates and Slides are topically designed to provide an attractive backdrop to any subject. Present our Shapes PowerPoint Templates because our PowerPoint Templates and Slides will give your ideas the shape. Use our Process and Flows PowerPoint Templates because It will get your audience in sync. Use our Business PowerPoint Templates because You have belief amd faith in your futuristic plans. Chalk them out for your team with our PowerPoint Templates and Slides.Use these PowerPoint slides for presentations relating to Arrow, business, button, chart, circle, cycle, define, deploy, develop, diagram, eps10, flow, graphic, illustration, improvement, integrate, lifecycle, line, measure, ongoing, optimize, pattern, process, relationship, role, round, shape, text, transparency, vector, wave, wheel. The prominent colors used in the PowerPoint template are Green, Gray, Black. The feedback we get is that our business process workflow diagram examples templates 2010 PowerPoint effectively help you save your valuable time. The feedback we get is that our button PowerPoint templates and PPT Slides are topically designed to provide an attractive backdrop to any subject. Professionals tell us our business process workflow diagram examples templates 2010 PowerPoint will make you look like a winner. Professionals tell us our cycle PowerPoint templates and PPT Slides are second to none. Presenters tell us our business process workflow diagram examples templates 2010 PowerPoint are readymade to fit into any presentation structure. You can be sure our chart PowerPoint templates and PPT Slides effectively help you save your valuable time. Our Business Process Workflow Diagram Examples Templates 2010 PowerPoint are never a drag. The audience will be always attentive.
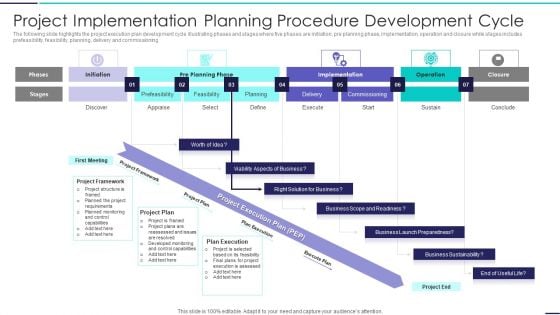
Project Implementation Planning Procedure Development Cycle Pictures PDF
The following slide highlights the project execution plan development cycle illustrating phases and stages where five phases are initiation, pre planning phase, implementation, operation and closure while stages includes prefeasibility, feasibility, planning, delivery and commissioning Showcasing this set of slides titled Project Implementation Planning Procedure Development Cycle Pictures PDF. The topics addressed in these templates are Project Framework, Planning, Implementation. All the content presented in this PPT design is completely editable. Download it and make adjustments in color, background, font etc. as per your unique business setting.

Marry Christmas Theme PowerPoint Templates Ppt Backgrounds For Slides 0413
We present our Marry Christmas Theme PowerPoint Templates PPT Backgrounds For Slides 0413.Download our Christmas PowerPoint Templates because It will mark the footprints of your journey. Illustrate how they will lead you to your desired destination. Present our Festival PowerPoint Templates because Our PowerPoint Templates and Slides will let your words and thoughts hit bullseye everytime. Use our Holidays PowerPoint Templates because Our PowerPoint Templates and Slides will let you Leave a lasting impression to your audiences. They possess an inherent longstanding recall factor. Use our Shapes PowerPoint Templates because Your success is our commitment. Our PowerPoint Templates and Slides will ensure you reach your goal. Download our Signs PowerPoint Templates because Our PowerPoint Templates and Slides are designed to help you succeed. They have all the ingredients you need.Use these PowerPoint slides for presentations relating to Merry christmas theme, christmas, festival, holidays, shapes, signs. The prominent colors used in the PowerPoint template are Orange, Yellow, White. Our Marry Christmas Theme PowerPoint Templates Ppt Backgrounds For Slides 0413 are destined to meet your standards. They conform to your exacting demands.
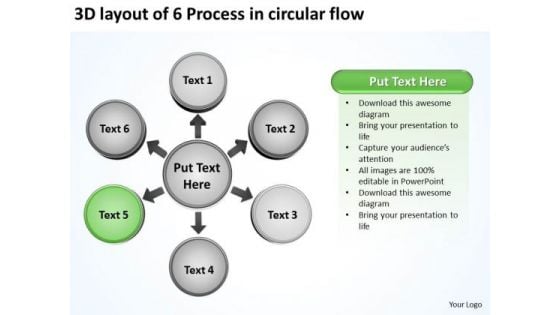
3d Layout Of 6 Process In Circular Flow Ppt Chart PowerPoint Templates
We present our 3d layout of 6 process in circular flow ppt Chart PowerPoint templates.Download and present our Circle Charts PowerPoint Templates because educate your staff on the means to provide the required support for speedy recovery. Use our Process and Flows PowerPoint Templates because our PowerPoint templates designed for your ideas to sell. Download and present our Success PowerPoint Templates because your quest has taken you well onto the path of success. Download and present our Business PowerPoint Templates because The foundation of the structure of your business is resilient and dependable. Convey this confidence to your colleagues and assure them of a great and enduring future. Present our Marketing PowerPoint Templates because educate your staff on the means to provide the required support for speedy recovery.Use these PowerPoint slides for presentations relating to Access, arrow, background, blue, bright, business, chart,circle, color, colorful, concept,conceptual, connection, corporate,creative, cycle, design, different, element,empty, flower, form, frame, graphic,green, group, idea, illustration, match,message, order, part, piece, place,process, red, shape, solution, special,speech, strategy, symbol. The prominent colors used in the PowerPoint template are Green dark , Gray, Black. The feedback we get is that our 3d layout of 6 process in circular flow ppt Chart PowerPoint templates are Amazing. The feedback we get is that our background PowerPoint templates and PPT Slides are Fashionable. Presenters tell us our 3d layout of 6 process in circular flow ppt Chart PowerPoint templates are Upbeat. The feedback we get is that our blue PowerPoint templates and PPT Slides are Stylish. PowerPoint presentation experts tell us our 3d layout of 6 process in circular flow ppt Chart PowerPoint templates are readymade to fit into any presentation structure. Customers tell us our background PowerPoint templates and PPT Slides are Clever. Collect feedback with our 3d Layout Of 6 Process In Circular Flow Ppt Chart PowerPoint Templates. Download without worries with our money back guaranteee.


 Continue with Email

 Home
Home


