Slider Scale

Business Revenue Bar Graph With Business Operational Expenditure Details Summary PDF
This slide represents business revenue bar graph with OPEX details which can be referred by companies to earn more revenue by controlling expenditures. It also provides information about marketing and sales, research and development, administration, total revenue, etc. Pitch your topic with ease and precision using this Business Revenue Bar Graph With Business Operational Expenditure Details Summary PDF. This layout presents information on Cost Of Marketing, Sales, Highest Amount. It is also available for immediate download and adjustment. So, changes can be made in the color, design, graphics or any other component to create a unique layout.
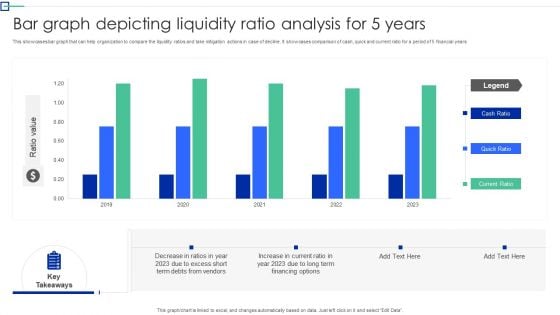
Bar Graph Depicting Liquidity Ratio Analysis For 5 Years Graphics PDF
This showcases bar graph that can help organization to compare the liquidity ratios and take mitigation actions in case of decline. It showcases comparison of cash, quick and current ratio for a period of 5 financial years. Showcasing this set of slides titled Bar Graph Depicting Liquidity Ratio Analysis For 5 Years Graphics PDF. The topics addressed in these templates are Organization To Compare, The Liquidity Ratios, Mitigation Action Decline. All the content presented in this PPT design is completely editable. Download it and make adjustments in color, background, font etc. as per your unique business setting.
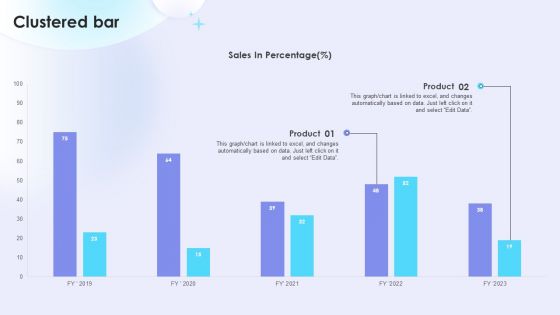
Dual Branding Campaign To Boost Sales Of Product Or Services Clustered Bar Mockup PDF
This Dual Branding Campaign To Boost Sales Of Product Or Services Clustered Bar Mockup PDF is perfect for any presentation, be it in front of clients or colleagues. It is a versatile and stylish solution for organizing your meetings. TheDual Branding Campaign To Boost Sales Of Product Or Services Clustered Bar Mockup PDF features a modern design for your presentation meetings. The adjustable and customizable slides provide unlimited possibilities for acing up your presentation. Slidegeeks has done all the homework before launching the product for you. So, do not wait, grab the presentation templates today
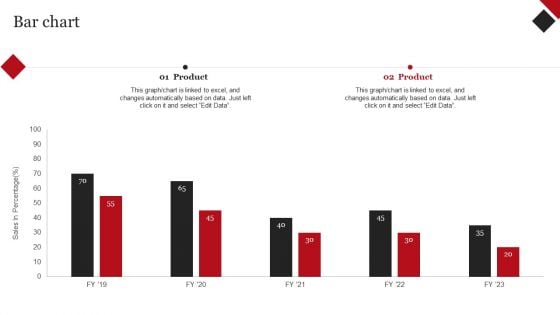
Coca Cola Emotional Marketing Strategy Bar Chart Ppt Professional Picture PDF
This Coca Cola Emotional Marketing Strategy Bar Chart Ppt Professional Picture PDF is perfect for any presentation, be it in front of clients or colleagues. It is a versatile and stylish solution for organizing your meetings. The Coca Cola Emotional Marketing Strategy Bar Chart Ppt Professional Picture PDF features a modern design for your presentation meetings. The adjustable and customizable slides provide unlimited possibilities for acing up your presentation. Slidegeeks has done all the homework before launching the product for you. So, dont wait, grab the presentation templates today
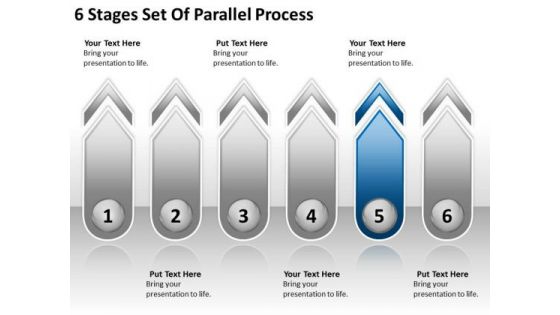
6 Stages Set Of Parallel Process Bar Business Plan Template PowerPoint Templates
We present our 6 stages set of parallel process bar business plan template PowerPoint templates.Present our Advertising PowerPoint Templates because It can Leverage your style with our PowerPoint Templates and Slides. Charm your audience with your ability. Present our Arrows PowerPoint Templates because our PowerPoint Templates and Slides will give your ideas the shape. Present our Business PowerPoint Templates because Our PowerPoint Templates and Slides will Embellish your thoughts. They will help you illustrate the brilliance of your ideas. Download our Shapes PowerPoint Templates because You can Create a matrix with our PowerPoint Templates and Slides. Feel the strength of your ideas click into place. Present our Process and Flows PowerPoint Templates because you can Break through with our PowerPoint Templates and Slides. Bring down the mental barriers of your audience.Use these PowerPoint slides for presentations relating to Arrow, Arrow Button, Arrow Vector, Art, Business, Button, Chart, Clip, communication, Decoration, Diagram, Direction, Drop, Element, Empty, Finance, Flow, Graph, Graphic, Illustration, Isometric, marketing, Presentation, Process, Shape, Sign, success, Step, Symbol, Template, Text, Vector. The prominent colors used in the PowerPoint template are Blue, White, Gray. Presenters tell us our 6 stages set of parallel process bar business plan template PowerPoint templates are effectively colour coded to prioritise your plans They automatically highlight the sequence of events you desire. Customers tell us our Button PowerPoint templates and PPT Slides provide you with a vast range of viable options. Select the appropriate ones and just fill in your text. The feedback we get is that our 6 stages set of parallel process bar business plan template PowerPoint templates are effectively colour coded to prioritise your plans They automatically highlight the sequence of events you desire. The feedback we get is that our Vector PowerPoint templates and PPT Slides are second to none. Presenters tell us our 6 stages set of parallel process bar business plan template PowerPoint templates are designed by professionals We assure you our Button PowerPoint templates and PPT Slides are specially created by a professional team with vast experience. They diligently strive to come up with the right vehicle for your brilliant Ideas. Reengineer your vision with our 6 Stages Set Of Parallel Process Bar Business Plan Template PowerPoint Templates. Download without worries with our money back guaranteee.
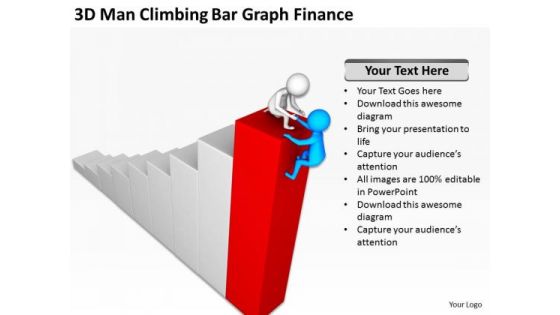
Successful Business People 3d Men Climbing Bar Graph Finance PowerPoint Templates
We present our successful business people 3d men climbing bar graph finance PowerPoint templates.Use our People PowerPoint Templates because Our PowerPoint Templates and Slides have the Brilliant backdrops. Guaranteed to illuminate the minds of your audience. Download our Finance PowerPoint Templates because You should Bet on your luck with our PowerPoint Templates and Slides. Be assured that you will hit the jackpot. Use our Business PowerPoint Templates because Our PowerPoint Templates and Slides will generate and maintain the level of interest you desire. They will create the impression you want to imprint on your audience. Use our Success PowerPoint Templates because You should Bet on your luck with our PowerPoint Templates and Slides. Be assured that you will hit the jackpot. Present our Shapes PowerPoint Templates because Our PowerPoint Templates and Slides ensures Effective communication. They help you put across your views with precision and clarity.Use these PowerPoint slides for presentations relating to 3d, abstract, accuracy, accurate, achieved, achievement, aim, arrow, background,best, black, business, center, chance, character, circle, competition, concept,conceptual, dart, dartboard, game, goal, human, icon, illustration, isolated, luck,marketing, men, people, perfect, perfection, performance, person, red, shot,solution, sport, strategy, success, successful, symbol, target, white, win, winner. The prominent colors used in the PowerPoint template are Red, Blue, White. We assure you our successful business people 3d men climbing bar graph finance PowerPoint templates effectively help you save your valuable time. You can be sure our achievement PowerPoint templates and PPT Slides are the best it can get when it comes to presenting. Use our successful business people 3d men climbing bar graph finance PowerPoint templates are effectively colour coded to prioritise your plans They automatically highlight the sequence of events you desire. We assure you our achieved PowerPoint templates and PPT Slides are the best it can get when it comes to presenting. Use our successful business people 3d men climbing bar graph finance PowerPoint templates will make you look like a winner. Professionals tell us our achievement PowerPoint templates and PPT Slides provide you with a vast range of viable options. Select the appropriate ones and just fill in your text. Our Successful Business People 3d Men Climbing Bar Graph Finance PowerPoint Templates will fall in line with your thoughts. They will convey the essence accurately.
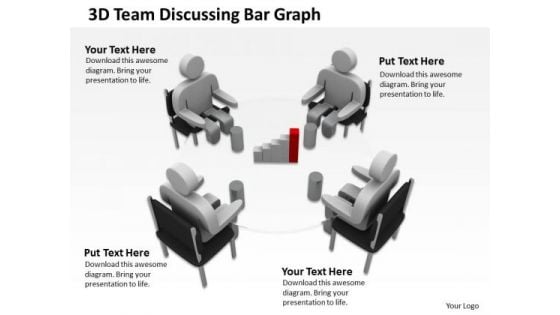
How To Draw Business Process Diagram 3d Team Discussing Bar Graph PowerPoint Templates
We present our how to draw business process diagram 3d team discussing bar graph PowerPoint templates.Download and present our Business PowerPoint Templates because It will get your audience in sync. Download and present our People PowerPoint Templates because You can Be the puppeteer with our PowerPoint Templates and Slides as your strings. Lead your team through the steps of your script. Use our Finance PowerPoint Templates because Our PowerPoint Templates and Slides are created by a hardworking bunch of busybees. Always flitting around with solutions gauranteed to please. Download and present our Symbol PowerPoint Templates because Our PowerPoint Templates and Slides will provide you a launch platform. Give a lift off to your ideas and send them into orbit. Download and present our Success PowerPoint Templates because You have gained great respect for your brilliant ideas. Use our PowerPoint Templates and Slides to strengthen and enhance your reputation.Use these PowerPoint slides for presentations relating to 3d, art, boardroom, budget, business, ceo, character, communication, concept, conference, corporate, council, discussion, economy, executive, finance, gold, graph, growth, icon, idea, idiom, illustration, isolated, lecture, manage, management, market, meet, metaphor, money, office, over, percentage, planning, presentation, projection, prospectus, report, study, summit, symbol, talk, team, white. The prominent colors used in the PowerPoint template are Red, Gray, Black. The feedback we get is that our how to draw business process diagram 3d team discussing bar graph PowerPoint templates are designed by a team of presentation professionals. Customers tell us our character PowerPoint templates and PPT Slides will impress their bosses and teams. The feedback we get is that our how to draw business process diagram 3d team discussing bar graph PowerPoint templates are designed by professionals Professionals tell us our business PowerPoint templates and PPT Slides are readymade to fit into any presentation structure. Presenters tell us our how to draw business process diagram 3d team discussing bar graph PowerPoint templates will make you look like a winner. You can be sure our ceo PowerPoint templates and PPT Slides provide you with a vast range of viable options. Select the appropriate ones and just fill in your text. Our How To Draw Business Process Diagram 3d Team Discussing Bar Graph PowerPoint Templates help you think on your feet. They provide you with ready answers.
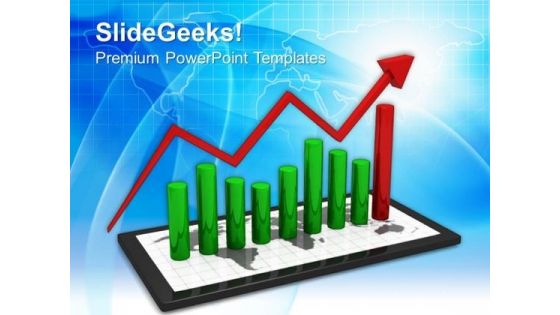
Tablet With Bar Graph Success PowerPoint Templates And PowerPoint Themes 1112
We present our Tablet With Bar Graph Success PowerPoint Templates And PowerPoint Themes 1112.Use our Business PowerPoint Templates because,Marketing Strategy Business Template:- Maximising sales of your product is the intended destination. Use our Marketing PowerPoint Templates because, The vision of being the market leader is clear to you. Use our Finance PowerPoint Templates because, Like your thoughts arrows are inherently precise and true. Use our Abstract PowerPoint Templates because,Explain the process by which you intend to right it. Use our Success PowerPoint Templates because, Expound on how you plan to gain their confidence and assure them of continued and consistent excellence in quality of service.Use these PowerPoint slides for presentations relating to Tablets with a bar graph Business Finance Marketing Abstract Success. The prominent colors used in the PowerPoint template are Red, Green, Black Establish control with our Tablet With Bar Graph Success PowerPoint Templates And PowerPoint Themes 1112. Let your thoughts take the reins.
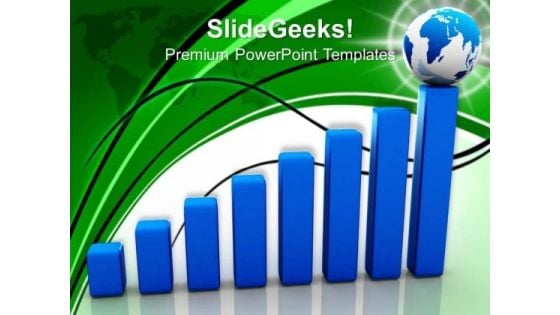
Bar Graph With Globe On Top Global Business PowerPoint Templates And PowerPoint Themes 1112
We present our Bar Graph With Globe On Top Global Business PowerPoint Templates And PowerPoint Themes 1112.Use our Finance PowerPoint Templates because, Hence this diagram has the unique ability to drive home your ideas and show how they mesh to gaurantee sucess. Use our Future PowerPoint Templates because,Explain the process by which you intend to right it. Use our Business PowerPoint Templates because, Outline your targets to your team. Use our Success PowerPoint Templates because,Show them how you can save the day. Use our Globe PowerPoint Templates because, Place them where they need to be.Use these PowerPoint slides for presentations relating to Bar graph with globe on top, finance, future, business, success, globe. The prominent colors used in the PowerPoint template are Blue, White, Black Win genuine accolades with our Bar Graph With Globe On Top Global Business PowerPoint Templates And PowerPoint Themes 1112. Dont waste time struggling with PowerPoint. Let us do it for you.

Wine Lounge Business Plan Choosing An Ideal Business Location For Wine Bar BP SS V
This slide portrays an ideal business location for a wine bar that minimizes the risk of failure. It covers gathering and analyzing data in order to select the optimal location in terms of feasibility, economy, and future sustainability. Get a simple yet stunning designed Wine Lounge Business Plan Choosing An Ideal Business Location For Wine Bar BP SS V. It is the best one to establish the tone in your meetings. It is an excellent way to make your presentations highly effective. So, download this PPT today from Slidegeeks and see the positive impacts. Our easy-to-edit Wine Lounge Business Plan Choosing An Ideal Business Location For Wine Bar BP SS V can be your go-to option for all upcoming conferences and meetings. So, what are you waiting for Grab this template today. This slide portrays an ideal business location for a wine bar that minimizes the risk of failure. It covers gathering and analyzing data in order to select the optimal location in terms of feasibility, economy, and future sustainability.

Wine Lounge Business Plan Detailed Porters Five Forces Analysis For Wine Bar BP SS V
The slide highlights porters five forces model and its implications in the US wine bar. The five forces include rivalry among competitors, bargaining power of buyers and suppliers, and the threat of new entrants and substitutes. Find highly impressive Wine Lounge Business Plan Detailed Porters Five Forces Analysis For Wine Bar BP SS V on Slidegeeks to deliver a meaningful presentation. You can save an ample amount of time using these presentation templates. No need to worry to prepare everything from scratch because Slidegeeks experts have already done a huge research and work for you. You need to download Wine Lounge Business Plan Detailed Porters Five Forces Analysis For Wine Bar BP SS V for your upcoming presentation. All the presentation templates are 100 percent editable and you can change the color and personalize the content accordingly. Download now The slide highlights porters five forces model and its implications in the US wine bar. The five forces include rivalry among competitors, bargaining power of buyers and suppliers, and the threat of new entrants and substitutes.
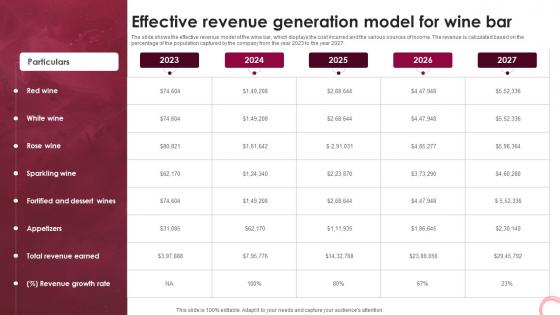
Wine Lounge Business Plan Effective Revenue Generation Model For Wine Bar BP SS V
The slide shows the effective revenue model of the wine bar, which displays the cost incurred and the various sources of income. The revenue is calculated based on the percentage of the population captured by the company from the year 2023 to the year 2027. Crafting an eye-catching presentation has never been more straightforward. Let your presentation shine with this tasteful yet straightforward Wine Lounge Business Plan Effective Revenue Generation Model For Wine Bar BP SS V template. It offers a minimalistic and classy look that is great for making a statement. The colors have been employed intelligently to add a bit of playfulness while still remaining professional. Construct the ideal Wine Lounge Business Plan Effective Revenue Generation Model For Wine Bar BP SS V that effortlessly grabs the attention of your audience Begin now and be certain to wow your customers The slide shows the effective revenue model of the wine bar, which displays the cost incurred and the various sources of income. The revenue is calculated based on the percentage of the population captured by the company from the year 2023 to the year 2027.
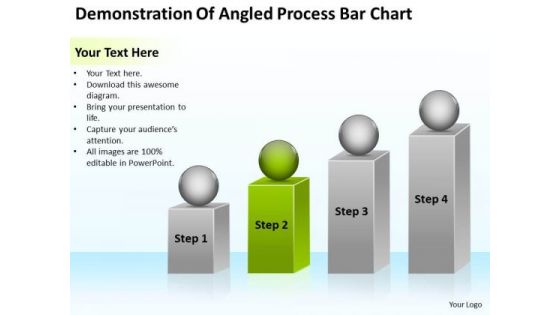
Demonstration Of Angled Process Bar Chart Ppt Make Business Plan PowerPoint Templates
We present our demonstration of angled process bar chart ppt make business plan PowerPoint templates.Present our Marketing PowerPoint Templates because Our PowerPoint Templates and Slides provide you with a vast range of viable options. Select the appropriate ones and just fill in your text. Present our Construction PowerPoint Templates because Our PowerPoint Templates and Slides are like the strings of a tennis racquet. Well strung to help you serve aces. Use our Spheres PowerPoint Templates because You can Score a slam dunk with our PowerPoint Templates and Slides. Watch your audience hang onto your every word. Present our Boxes PowerPoint Templates because It will let you Set new benchmarks with our PowerPoint Templates and Slides. They will keep your prospects well above par. Present our Business PowerPoint Templates because Our PowerPoint Templates and Slides will let you Leave a lasting impression to your audiences. They possess an inherent longstanding recall factor.Use these PowerPoint slides for presentations relating to 3d, human, cube, isolated, activity, achievement, business, success, decisions, teamwork, partnership, stack, occupation, people, building, shape, team, box, illustration, figure, creativity, togetherness, games, aspirations, group, growth, text, picking, progress, working, silhouette, puzzle, construction, concepts, structure, cartoon, ideas. The prominent colors used in the PowerPoint template are Green, White, Gray. Claim your prize with our Demonstration Of Angled Process Bar Chart Ppt Make Business Plan PowerPoint Templates. You will come out on top.
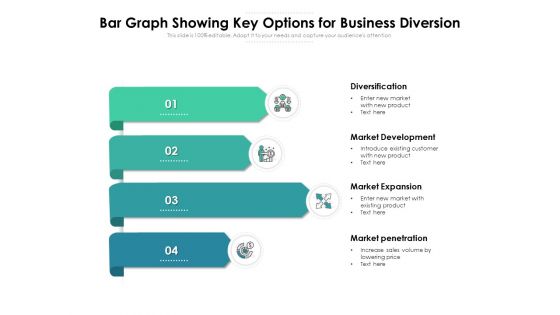
Bar Graph Showing Key Options For Business Diversion Ppt PowerPoint Presentation Professional Graphics PDF
Presenting this set of slides with name bar graph showing key options for business diversion ppt powerpoint presentation professional graphics pdf. This is a four stage process. The stages in this process are diversification, market development, market expansion, market penetration, enter new market with new product. This is a completely editable PowerPoint presentation and is available for immediate download. Download now and impress your audience.

Bar Graph Showing Revenues Generated By Sales Department Ppt Portfolio Graphics Example PDF
This graph or chart is linked to excel, and changes automatically based on data. Just left click on it and select edit data. Showcasing this set of slides titled bar graph showing revenues generated by sales department ppt portfolio graphics example pdf. The topics addressed in these templates are yearly sales revenues, sales team, profits. All the content presented in this PPT design is completely editable. Download it and make adjustments in color, background, font etc. as per your unique business setting.
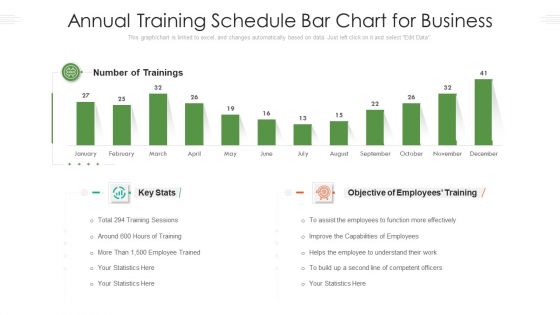
Annual Training Schedule Bar Chart For Business Ppt PowerPoint Presentation File Infographics PDF
This graph chart is linked to excel, and changes automatically based on data. Just left click on it and select Edit Data. Showcasing this set of slides titled annual training schedule bar chart for business ppt powerpoint presentation file infographics pdf. The topics addressed in these templates are trainings, employees, competent officers. All the content presented in this PPT design is completely editable. Download it and make adjustments in color, background, font etc. as per your unique business setting.
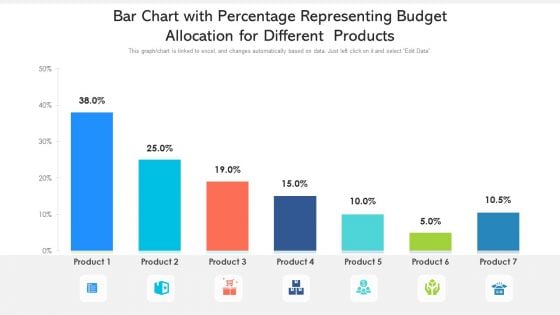
Bar Chart With Percentage Representing Budget Allocation For Different Products Ppt PowerPoint Presentation File Samples PDF
Showcasing this set of slides titled bar chart with percentage representing budget allocation for different products ppt powerpoint presentation file samples pdf. The topics addressed in these templates arebar chart with percentage representing budget allocation for different products. All the content presented in this PPT design is completely editable. Download it and make adjustments in color, background, font etc. as per your unique business setting.
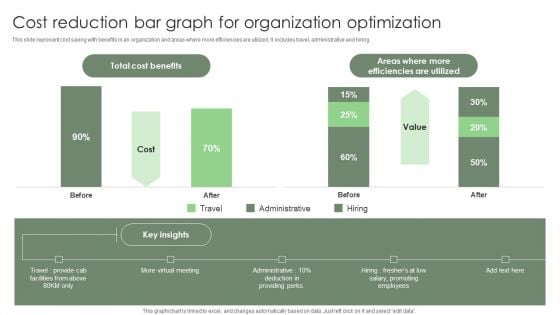
Cost Reduction Bar Graph For Organization Optimization Ppt Inspiration Vector PDF
This slide represent cost saving with benefits in an organization and areas where more efficiencies are utilized. It includes travel, administrative and hiring. Pitch your topic with ease and precision using this Cost Reduction Bar Graph For Organization Optimization Ppt Inspiration Vector PDF. This layout presents information on Total Cost Benefits, Promoting Employees, Providing Perks. It is also available for immediate download and adjustment. So, changes can be made in the color, design, graphics or any other component to create a unique layout.
Bar Graph Representing Accomplishment Metrics For Customer Service Team Icons PDF
This slide shows the graphical representation of success metrics that helps to measure the customer service team which includes customer lifetime value, customer churn, net promoter score, revenues churn, customer experience score, customer renewals, etc. Showcasing this set of slides titled bar graph representing accomplishment metrics for customer service team icons pdf. The topics addressed in these templates are importance level, least important. All the content presented in this PPT design is completely editable. Download it and make adjustments in color, background, font etc. as per your unique business setting.
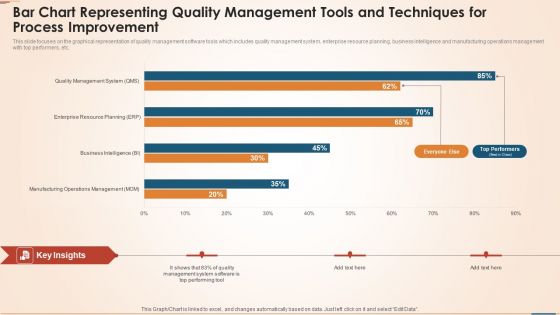
Bar Chart Representing Quality Management Tools And Techniques For Process Improvement Download PDF
This slide focuses on the graphical representation of quality management software tools which includes quality management system, enterprise resource planning, business intelligence and manufacturing operations management with top performers, etc. Showcasing this set of slides titled bar chart representing quality management tools and techniques for process improvement download pdf. The topics addressed in these templates are manufacturing operations management, business intelligence, enterprise resource planning, quality management system. All the content presented in this PPT design is completely editable. Download it and make adjustments in color, background, font etc. as per your unique business setting.
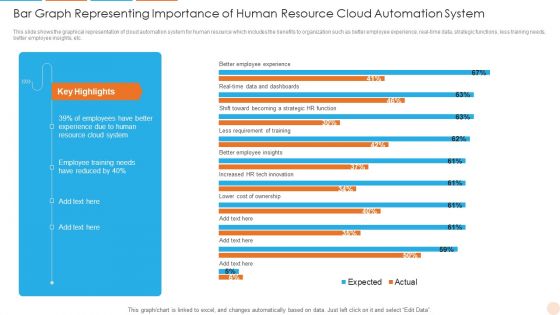
Bar Graph Representing Importance Of Human Resource Cloud Automation System Background PDF
This slide shows the graphical representation of cloud automation system for human resource which includes the benefits to organization such as better employee experience, real time data, strategic functions, less training needs, better employee insights, etc. Showcasing this set of slides titled Bar Graph Representing Importance Of Human Resource Cloud Automation System Background PDF. The topics addressed in these templates are System, Resource, Reduced. All the content presented in this PPT design is completely editable. Download it and make adjustments in color, background, font etc. as per your unique business setting.
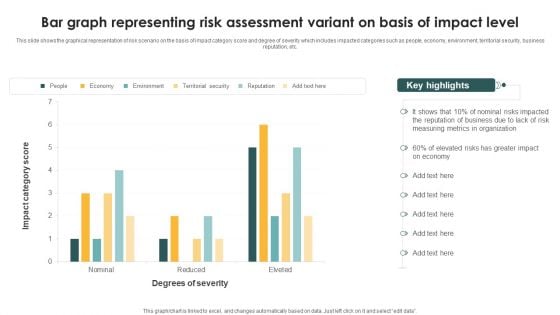
Bar Graph Representing Risk Assessment Variant On Basis Of Impact Level Topics PDF
This slide shows the graphical representation of risk scenario on the basis of impact category score and degree of severity which includes impacted categories such as people, economy, environment, territorial security, business reputation, etc. Showcasing this set of slides titled Bar Graph Representing Risk Assessment Variant On Basis Of Impact Level Topics PDF. The topics addressed in these templates are Measuring Metrics, Organization, Greater Impact. All the content presented in this PPT design is completely editable. Download it and make adjustments in color, background, font etc. as per your unique business setting.
Multiple Projects Progress Tracking Report Tracking Report With Bar Graph Information PDF
This slide shows the status report of various projects in order to help the project manager to track their performance. It includes project names, no.of tasks, start and end date, days taken for completion, progress and remaining percentage of projects.Showcasing this set of slides titled Multiple Projects Progress Tracking Report Tracking Report With Bar Graph Information PDF. The topics addressed in these templates are Multiple Projects, Progress Tracking, Report Tracking Report. All the content presented in this PPT design is completely editable. Download it and make adjustments in color, background, font etc. as per your unique business setting.
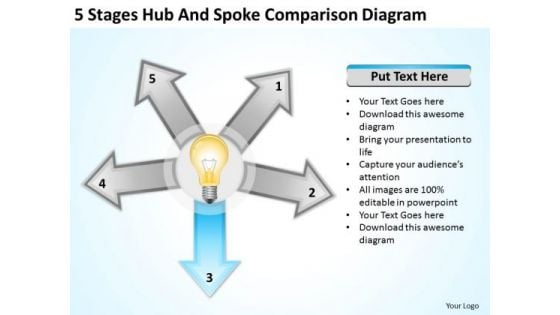
5 Stages Hub And Spoke Comparison Diagram Business Plan For Bar PowerPoint Templates
We present our 5 stages hub and spoke comparison diagram business plan for bar PowerPoint templates.Download our Technology PowerPoint Templates because Our PowerPoint Templates and Slides are created by a hardworking bunch of busybees. Always flitting around with solutions gauranteed to please. Present our Business PowerPoint Templates because Your audience will believe you are the cats whiskers. Download our Process and Flows PowerPoint Templates because You can Create a matrix with our PowerPoint Templates and Slides. Feel the strength of your ideas click into place. Download and present our Marketing PowerPoint Templates because You can Zap them with our PowerPoint Templates and Slides. See them reel under the impact. Use our Arrows PowerPoint Templates because It is Aesthetically crafted by artistic young minds. Our PowerPoint Templates and Slides are designed to display your dexterity.Use these PowerPoint slides for presentations relating to Experiment, spreadsheet, sociology, line chart, conclusion, pie chart, mathematics, innovation, sociological, business, bulb, concept, arrow, presentation, symbol, diagram, social, discovery, process, analysis, report, marketing, intelligent, creative, visualization, mathematical formula, trends, thinking, summary, infographic, exploration, information, conceptual, quantified, exploratory, business. The prominent colors used in the PowerPoint template are Blue, Yellow, White. Approaching the dais can make you anxious. Experience the calmness our 5 Stages Hub And Spoke Comparison Diagram Business Plan For Bar PowerPoint Templates bring.
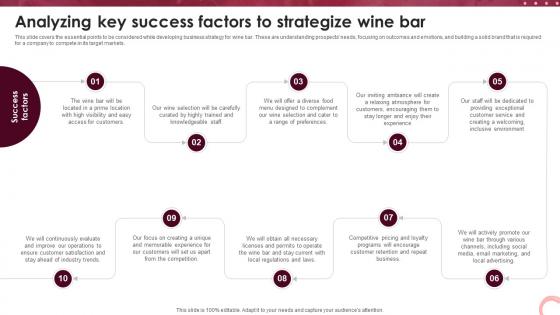
Wine Lounge Business Plan Analyzing Key Success Factors To Strategize Wine Bar BP SS V
This slide covers the essential points to be considered while developing business strategy for wine bar. These are understanding prospects needs, focusing on outcomes and emotions, and building a solid brand that is required for a company to compete in its target markets. Want to ace your presentation in front of a live audience Our Wine Lounge Business Plan Analyzing Key Success Factors To Strategize Wine Bar BP SS V can help you do that by engaging all the users towards you. Slidegeeks experts have put their efforts and expertise into creating these impeccable powerpoint presentations so that you can communicate your ideas clearly. Moreover, all the templates are customizable, and easy-to-edit and downloadable. Use these for both personal and commercial use. This slide covers the essential points to be considered while developing business strategy for wine bar. These are understanding prospects needs, focusing on outcomes and emotions, and building a solid brand that is required for a company to compete in its target markets.
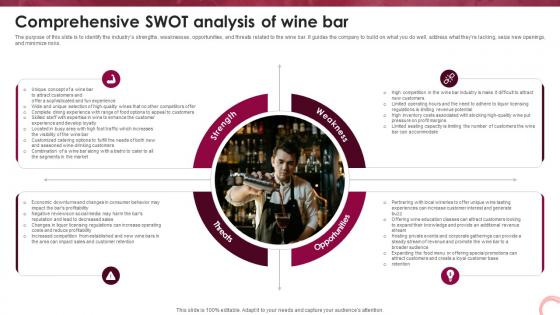
Wine Lounge Business Plan Comprehensive Swot Analysis Of Wine Bar BP SS V
The purpose of this slide is to identify the industrys strengths, weaknesses, opportunities, and threats related to the wine bar. It guides the company to build on what you do well, address what they are lacking, seize new openings, and minimize risks. Slidegeeks is here to make your presentations a breeze with Wine Lounge Business Plan Comprehensive Swot Analysis Of Wine Bar BP SS V With our easy-to-use and customizable templates, you can focus on delivering your ideas rather than worrying about formatting. With a variety of designs to choose from, you are sure to find one that suits your needs. And with animations and unique photos, illustrations, and fonts, you can make your presentation pop. So whether you are giving a sales pitch or presenting to the board, make sure to check out Slidegeeks first The purpose of this slide is to identify the industrys strengths, weaknesses, opportunities, and threats related to the wine bar. It guides the company to build on what you do well, address what they are lacking, seize new openings, and minimize risks.
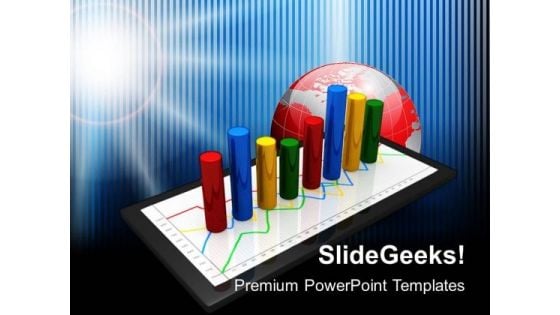
Tablet With Bar Graph Global Business PowerPoint Templates And PowerPoint Themes 1112
We present our Tablet With Bar Graph Global Business PowerPoint Templates And PowerPoint Themes 1112.Use our Business PowerPoint Templates because, You have it all down to a nicety, slice by slice, layer by layer. Use our Cylinders PowerPoint Templates because, Explain thecontribution of each of the elements and how they provide impetus to the next phase. Use our Technology PowerPoint Templates because, They enhance the essence of your viable ideas. Use our Marketing PowerPoint Templates because, Original thinking is the need of the hour. Use our Globe PowerPoint Templates because,But you have an idea of which you are sure.Use these PowerPoint slides for presentations relating to Tablet pc with graph, cylinders, business, technology, marketing, globe . The prominent colors used in the PowerPoint template are Red, Blue navy, Yellow Innovate and succeed with our Tablet With Bar Graph Global Business PowerPoint Templates And PowerPoint Themes 1112. Download without worries with our money back guaranteee.
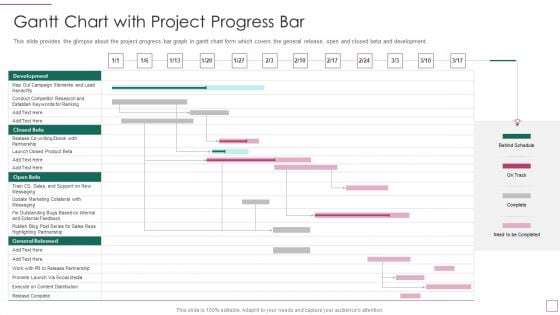
Approach Avoidance Conflict Gantt Chart With Project Progress Bar Topics PDF
This slide provides the glimpse about the project progress bar graph in gantt chart form which covers the general release, open and closed beta and development. Your complex projects can be managed and organized simultaneously using this detailed approach avoidance conflict gantt chart with project progress bar topics pdf template. Track the milestones, tasks, phases, activities, and subtasks to get an updated visual of your project. Share your planning horizon and release plan with this well crafted presentation template. This exemplary template can be used to plot various dependencies to distinguish the tasks in the pipeline and their impact on the schedules and deadlines of the project. Apart from this, you can also share this visual presentation with your team members and stakeholders. It a resourceful tool that can be incorporated into your business structure. Therefore, download and edit it conveniently to add the data and statistics as per your requirement.
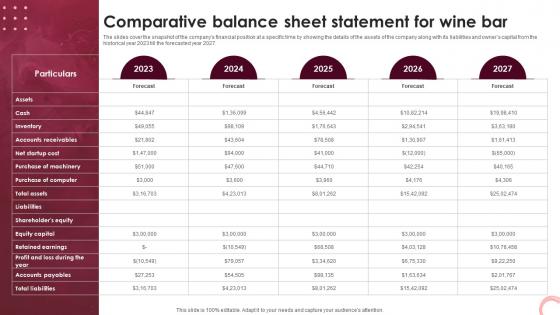
Wine Lounge Business Plan Comparative Balance Sheet Statement For Wine Bar BP SS V
The slides cover the snapshot of the companys financial position at a specific time by showing the details of the assets of the company along with its liabilities and owners capital from the historical year 2023 till the forecasted year 2027. From laying roadmaps to briefing everything in detail, our templates are perfect for you. You can set the stage with your presentation slides. All you have to do is download these easy-to-edit and customizable templates. Wine Lounge Business Plan Comparative Balance Sheet Statement For Wine Bar BP SS V will help you deliver an outstanding performance that everyone would remember and praise you for. Do download this presentation today. The slides cover the snapshot of the companys financial position at a specific time by showing the details of the assets of the company along with its liabilities and owners capital from the historical year 2023 till the forecasted year 2027.
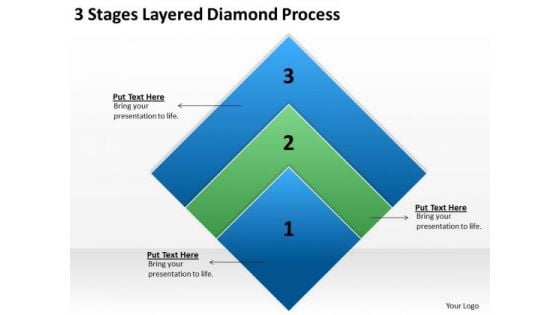
3 Stages Layered Diamond Process Sports Bar Business Plan PowerPoint Templates
We present our 3 stages layered diamond process sports bar business plan PowerPoint templates.Download and present our Marketing PowerPoint Templates because Our PowerPoint Templates and Slides are effectively colour coded to prioritise your plans They automatically highlight the sequence of events you desire. Download our Finance PowerPoint Templates because Our PowerPoint Templates and Slides will weave a web of your great ideas. They are gauranteed to attract even the most critical of your colleagues. Use our Process and Flows PowerPoint Templates because Your audience will believe you are the cats whiskers. Download and present our Shapes PowerPoint Templates because Watching this your Audience will Grab their eyeballs, they wont even blink. Download and present our Business PowerPoint Templates because Your audience will believe you are the cats whiskers.Use these PowerPoint slides for presentations relating to Surface, wallpaper, rough, dirty, plate, stamp, mark, surrounding, history, built, canvas, process, obsolete, paint, level, layer, revival, diamond, illustration, aging, wall, brush, retro, texture, inkblot, art, antique, effect, artistic, vintage, grunge, spot, pattern, construction, structure, rusted, metal, material. The prominent colors used in the PowerPoint template are Green, Blue, Black. Catch the bus with our 3 Stages Layered Diamond Process Sports Bar Business Plan PowerPoint Templates. Climb aboard for a dream ride.
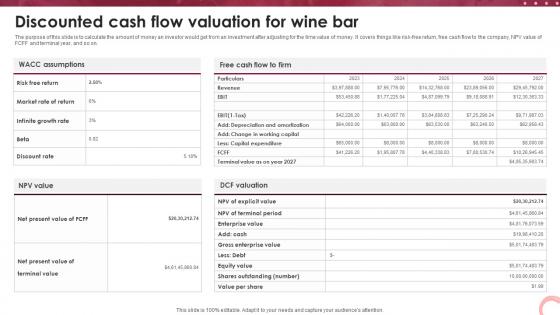
Wine Lounge Business Plan Discounted Cash Flow Valuation For Wine Bar BP SS V
The purpose of this slide is to calculate the amount of money an investor would get from an investment after adjusting for the time value of money. It covers things like risk-free return, free cash flow to the company, NPV value of FCFF and terminal year, and so on. If you are looking for a format to display your unique thoughts, then the professionally designed Wine Lounge Business Plan Discounted Cash Flow Valuation For Wine Bar BP SS V is the one for you. You can use it as a Google Slides template or a PowerPoint template. Incorporate impressive visuals, symbols, images, and other charts. Modify or reorganize the text boxes as you desire. Experiment with shade schemes and font pairings. Alter, share or cooperate with other people on your work. Download Wine Lounge Business Plan Discounted Cash Flow Valuation For Wine Bar BP SS V and find out how to give a successful presentation. Present a perfect display to your team and make your presentation unforgettable. The purpose of this slide is to calculate the amount of money an investor would get from an investment after adjusting for the time value of money. It covers things like risk-free return, free cash flow to the company, NPV value of FCFF and terminal year, and so on.
Four Banners With Idea Generation Bar Graph Gears Icons Powerpoint Templates
This PPT slide has been designed with four banners. This professional template contains concept of idea generation and analysis. Blend your views with this professional slide.
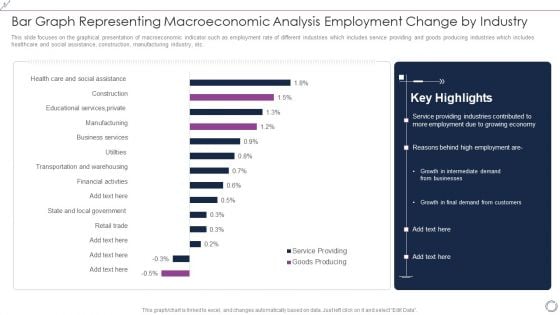
Bar Graph Representing Macroeconomic Analysis Employment Change By Industry Background PDF
This slide focuses on the graphical presentation of macroeconomic indicator such as employment rate of different industries which includes service providing and goods producing industries which includes healthcare and social assistance, construction, manufacturing industry, etc. Pitch your topic with ease and precision using this Bar Graph Representing Macroeconomic Analysis Employment Change By Industry Background PDF. This layout presents information on Goods Producing, Service Providing, Financial, Business. It is also available for immediate download and adjustment. So, changes can be made in the color, design, graphics or any other component to create a unique layout.
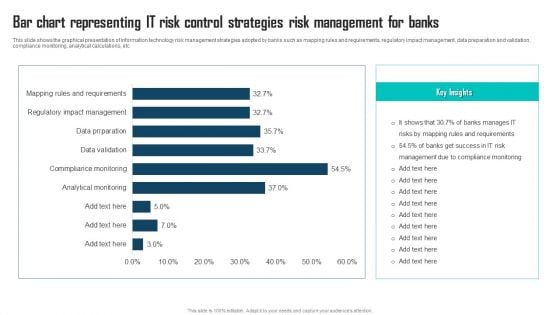
Bar Chart Representing IT Risk Control Strategies Risk Management For Banks Themes PDF
This slide shows the graphical presentation of information technology risk management strategies adopted by banks such as mapping rules and requirements, regulatory impact management, data preparation and validation, compliance monitoring, analytical calculations, etc. Pitch your topic with ease and precision using this Bar Chart Representing IT Risk Control Strategies Risk Management For Banks Themes PDF. This layout presents information on IT Risk Management, Compliance Monitoring, Manages IT Risks. It is also available for immediate download and adjustment. So, changes can be made in the color, design, graphics or any other component to create a unique layout.
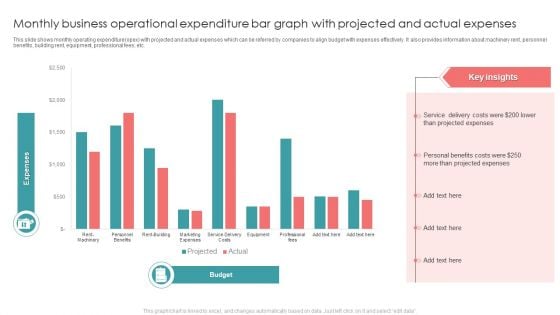
Monthly Business Operational Expenditure Bar Graph With Projected And Actual Expenses Introduction PDF
This slide shows monthly operating expenditure opex with projected and actual expenses which can be referred by companies to align budget with expenses effectively. It also provides information about machinery rent, personnel benefits, building rent, equipment, professional fees, etc. Pitch your topic with ease and precision using this Monthly Business Operational Expenditure Bar Graph With Projected And Actual Expenses Introduction PDF. This layout presents information on Projected Expenses, Costs, Service. It is also available for immediate download and adjustment. So, changes can be made in the color, design, graphics or any other component to create a unique layout.
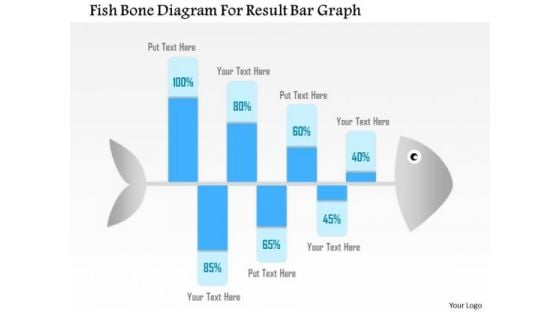
Business Diagram Fish Bone Diagram For Result Bar Graph Presentation Template
Graphic of fish bone has been used to design this Power Point template slide. This PPT slide contains the concept of problem analysis and root cause analysis. Use this PPT slide and display process of root cause analysis for any field. This PPT slide is very well designed for business and production related problem analysis.

Wine Lounge Business Plan Assessing Target Customer Profile For Wine Bar BP SS V
This slide covers an assessment of how the companys products will fit into a particular market and where they will acquire the most traction with customers. It includes wine enthusiasts, business travelers, young professionals, couples, retirees, students, tourists and event planners. There are so many reasons you need a Wine Lounge Business Plan Assessing Target Customer Profile For Wine Bar BP SS V. The first reason is you can not spend time making everything from scratch, Thus, Slidegeeks has made presentation templates for you too. You can easily download these templates from our website easily. This slide covers an assessment of how the companys products will fit into a particular market and where they will acquire the most traction with customers. It includes wine enthusiasts, business travelers, young professionals, couples, retirees, students, tourists and event planners.

Wine Lounge Business Plan Consolidated Statements Of Cash Flows For Wine Bar BP SS V
The slides highlight the company cash flow statement to provide a detailed picture of what happened to a business cash during a specified period. It represents net cash flow from operating, investing, and financing activities from the historical year 2023 till the forecasted the year 2027. Do you have an important presentation coming up Are you looking for something that will make your presentation stand out from the rest Look no further than Wine Lounge Business Plan Consolidated Statements Of Cash Flows For Wine Bar BP SS V. With our professional designs, you can trust that your presentation will pop and make delivering it a smooth process. And with Slidegeeks, you can trust that your presentation will be unique and memorable. So why wait Grab Wine Lounge Business Plan Consolidated Statements Of Cash Flows For Wine Bar BP SS V today and make your presentation stand out from the rest The slides highlight the company cash flow statement to provide a detailed picture of what happened to a business cash during a specified period. It represents net cash flow from operating, investing, and financing activities from the historical year 2023 till the forecasted the year 2027.
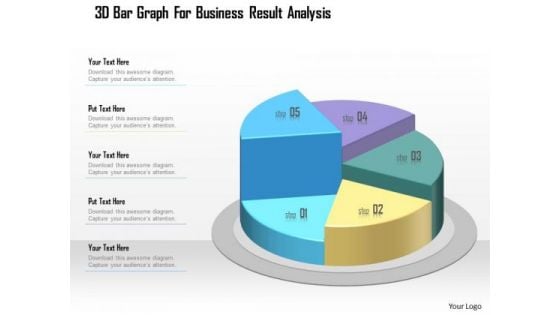
Business Diagram 3d Bar Graph For Business Result Analysis Presentation Template
This business slide displays five staged pie chart. This diagram is a data visualization tool that gives you a simple way to present statistical information. This slide helps your audience examine and interpret the data you present.

Man Standing With Stack Of Us Currency Notes Bundles Ppt Powerpoint Presentation File Slides
This is a man standing with stack of us currency notes bundles ppt powerpoint presentation file slides. This is a three stage process. The stages in this process are stacked bar, pile bar, heap bar.

Stack Of Dollar Currency Banknotes For Financial Success Ppt Powerpoint Presentation Slides Background
This is a stack of dollar currency banknotes for financial success ppt powerpoint presentation slides background. This is a five stage process. The stages in this process are stacked bar, pile bar, heap bar.

Bar Graph Option Market Diversification Strategy Ppt PowerPoint Presentation Complete Deck
Share a great deal of information on the topic by deploying this bar graph option market diversification strategy ppt powerpoint presentation complete deck. Support your ideas and thought process with this prefabricated set. It includes a set of eleven slides, all fully modifiable and editable. Each slide can be restructured and induced with the information and content of your choice. You can add or remove large content boxes as well, to make this PPT slideshow more personalized. Its high-quality graphics and visuals help in presenting a well-coordinated pitch. This PPT template is also a resourceful tool to take visual cues from and implement the best ideas to help your business grow and expand. The main attraction of this well-formulated deck is that everything is editable, giving you the freedom to adjust it to your liking and choice. Changes can be made in the background and theme as well to deliver an outstanding pitch. Therefore, click on the download button now to gain full access to this multifunctional set.
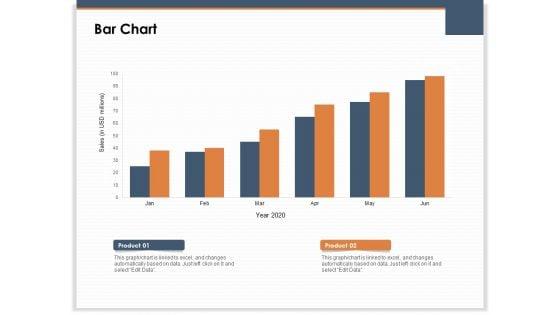
Main Revenues Progress Levers For Each Firm And Sector Bar Chart Ppt PowerPoint Presentation Gallery Skills PDF
Presenting this set of slides with name main revenues progress levers for each firm and sector bar chart ppt powerpoint presentation gallery skills pdf. The topics discussed in these slide is bar chart. This is a completely editable PowerPoint presentation and is available for immediate download. Download now and impress your audience.
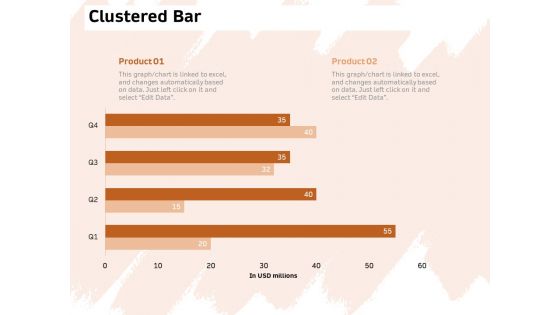
Investor Deck For Capital Generation From Substitute Funding Options Clustered Bar Ppt PowerPoint Presentation Outline Graphics Tutorials PDF
Presenting this set of slides with name investor deck for capital generation from substitute funding options clustered bar ppt powerpoint presentation outline graphics tutorials pdf. The topics discussed in these slide is clustered bar. This is a completely editable PowerPoint presentation and is available for immediate download. Download now and impress your audience.
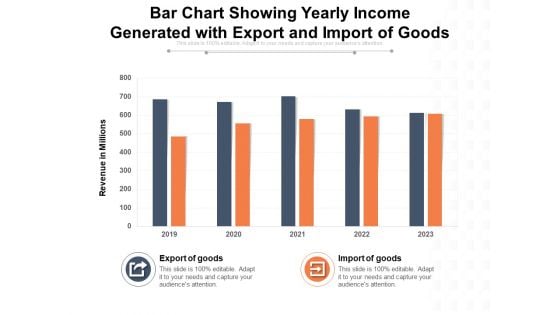
Bar Chart Showing Yearly Income Generated With Export And Import Of Goods Ppt PowerPoint Presentation Gallery Clipart Images PDF
Presenting this set of slides with name bar chart showing yearly income generated with export and import of goods ppt powerpoint presentation gallery clipart images pdf. The topics discussed in these slides are export of goods, import of goods. This is a completely editable PowerPoint presentation and is available for immediate download. Download now and impress your audience.
Bar Chart With Magnifying Glass And Dollar Symbol For Financial Analysis Ppt PowerPoint Presentation File Structure PDF
Presenting this set of slides with name bar chart with magnifying glass and dollar symbol for financial analysis ppt powerpoint presentation file structure pdf. This is a one stage process. The stages in this process is bar chart with magnifying glass and dollar symbol for financial analysis. This is a completely editable PowerPoint presentation and is available for immediate download. Download now and impress your audience.
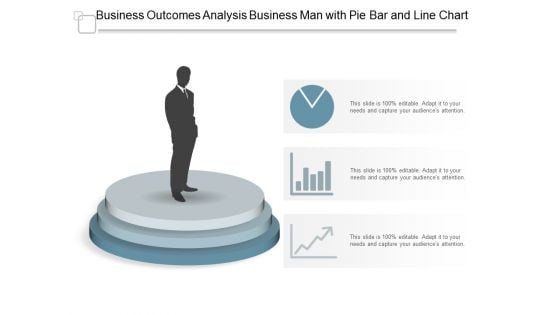
Business Outcomes Analysis Business Man With Pie Bar And Line Chart Ppt PowerPoint Presentation Professional Graphics Download
Presenting this set of slides with name business outcomes analysis business man with pie bar and line chart ppt powerpoint presentation professional graphics download. This is a three stage process. The stages in this process are business outcomes, business results, business output. This is a completely editable PowerPoint presentation and is available for immediate download. Download now and impress your audience.
Histogram Icon Showing Economic Fluctuations Ppt PowerPoint Presentation Slides Samples Cpb
This is a histogram icon showing economic fluctuations ppt powerpoint presentation slides samples cpb. This is a three stage process. The stages in this process are bar chart icon, bar graph icon, data chart icon.
Histogram With Gear Vector Icon Ppt PowerPoint Presentation Professional Slides Cpb
This is a histogram with gear vector icon ppt powerpoint presentation professional slides cpb. This is a three stage process. The stages in this process are bar chart icon, bar graph icon, data chart icon.
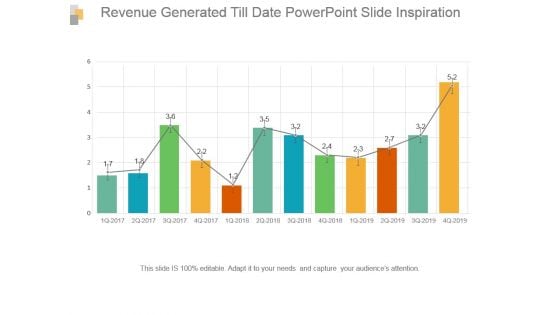
Revenue Generated Till Date Powerpoint Slide Inspiration
This is a revenue generated till date powerpoint slide inspiration. This is a twelve stage process. The stages in this process are bar graph, growth, success, data, analysis.
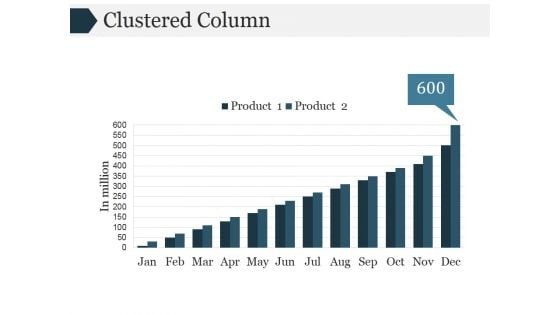
Clustered Column Ppt PowerPoint Presentation Slide Download
This is a clustered column ppt powerpoint presentation slide download. This is a twelve stage process. The stages in this process are bar graph, marketing, strategy, analysis, business.
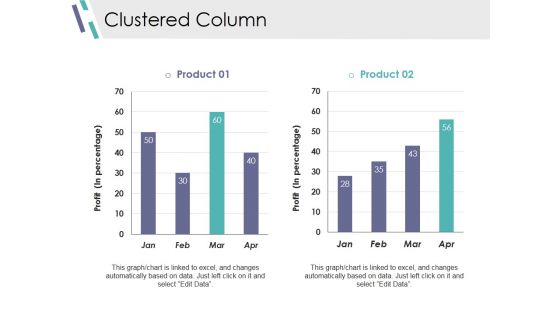
Clustered Column Ppt PowerPoint Presentation Slides Visuals
This is a clustered column ppt powerpoint presentation slides visuals. This is a two stage process. The stages in this process are bar graph, marketing, strategy, finance, planning.
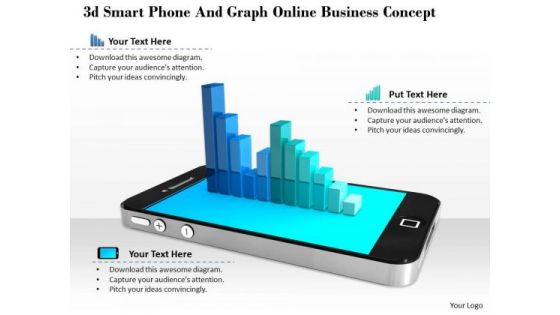
Stock Photo Smartphone Business Graph PowerPoint Slide
This image slide displays smartphone with bar graph. This image slide has been crafted with graphic of smart phone with bar graph on screen on grey shaded background. Use this image slide to express views on technology and business management. Make wonderful presentations using this image slide.

Human Gearhead Industrial PowerPoint Themes And PowerPoint Slides 0511
Microsoft PowerPoint Theme and Slide with human gearhead Set an example with your views. Place the bar with our Human Gearhead Industrial PowerPoint Themes And PowerPoint Slides 0511.
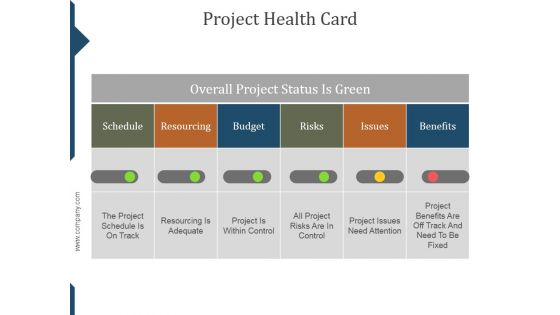
Project Health Card Ppt PowerPoint Presentation Slide Download
This is a project health card ppt powerpoint presentation slide download. This is a four stage process. The stages in this process are column, pie, column, bar.
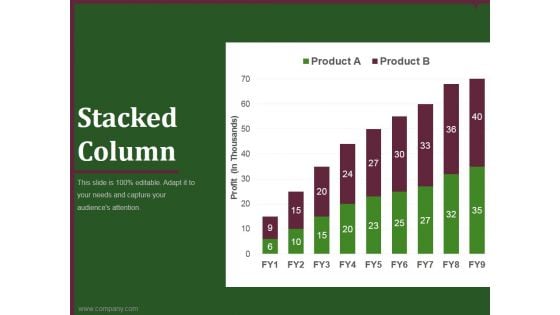
Stacked Column Template 1 Ppt PowerPoint Presentation Slide
This is a stacked column template 1 ppt powerpoint presentation slide. This is a nine stage process. The stages in this process are bar, graph, business, marketing, strategy.
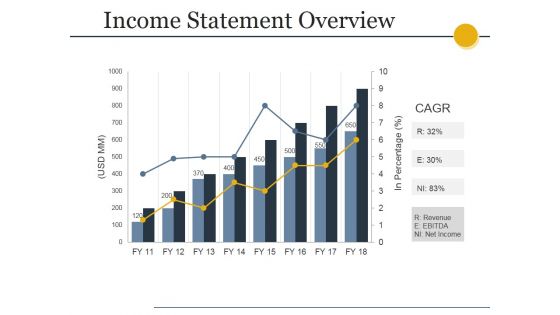
Income Statement Overview Ppt PowerPoint Presentation Professional Slides
This is a income statement overview ppt powerpoint presentation professional slides. This is a eight stage process. The stages in this process are business, marketing, bar, growth, success.
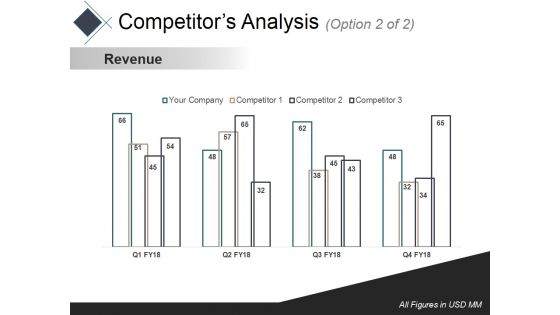
Competitors Analysis 2 Ppt PowerPoint Presentation Slides Gallery
This is a competitors analysis 2 ppt powerpoint presentation slides gallery. This is a four stage process. The stages in this process are revenue, business, marketing, bar, success.
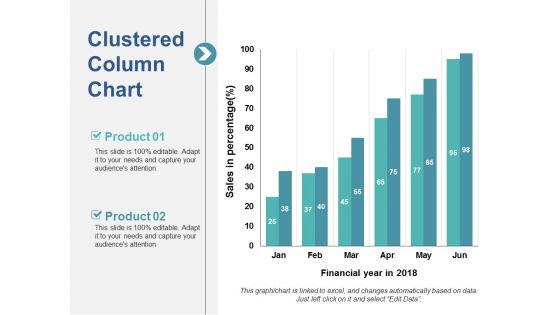
Clustered Column Chart Ppt PowerPoint Presentation Slides Smartart
This is a clustered column chart ppt powerpoint presentation slides smartart. This is a two stage process. The stages in this process are bar, marketing, strategy, planning, finance.
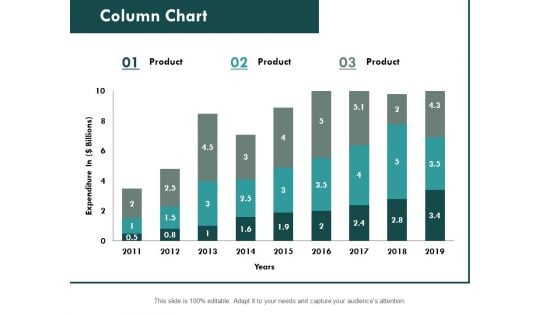
Column Chart Graph Ppt PowerPoint Presentation Slides File Formats
This is a combo chart bar ppt powerpoint presentation slides portfolio. This is a three stage process. The stages in this process are finance, marketing, analysis, investment, million.


 Continue with Email

 Home
Home


