Slider
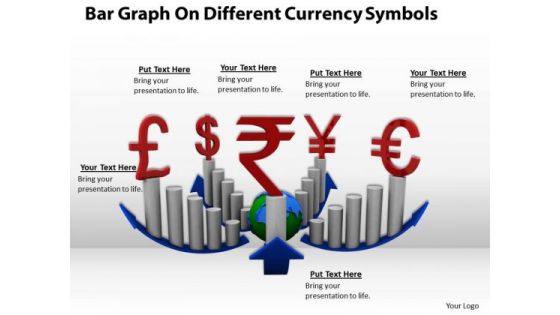
Stock Photo Bar Graph For Currency And Finance PowerPoint Slide
This image slide displays bar graphs with different currency symbols. This image has been designed with graphic of bar graphs, blue colored growth arrow and symbols of different currencies. Use this image slide, in your presentations to express views on finance, growth and achievements. This image slide may also be used to exhibit finance accounts in your presentations. This image slide will enhance the quality of your presentations.
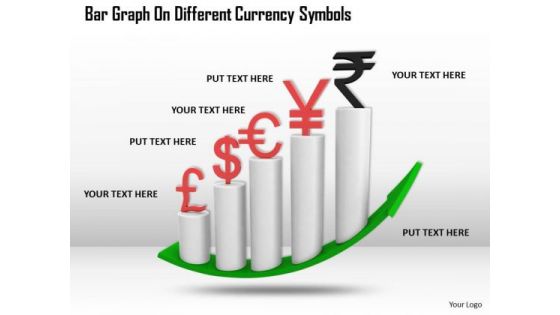
Stock Photo Bar Graph On Different Currency Symbols PowerPoint Slide
This image slide displays bar graph with different currency symbols. This image has been designed with graphic of bar graph, green colored growth arrow and symbols of different currencies. Use this image slide, in your presentations to express views on finance, monetary growth and achievements. This image slide may also be used to exhibit finance accounts in your presentations. This image slide will enhance the quality of your presentations.
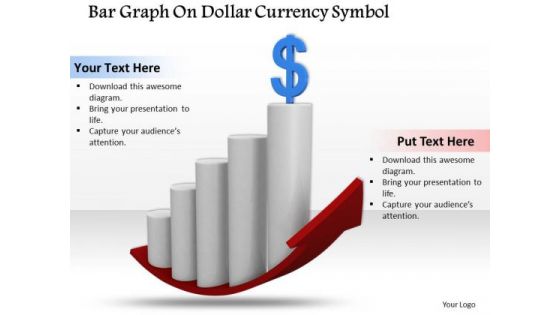
Stock Photo Bar Graph With Dollar Currency Symbol PowerPoint Slide
This image slide displays bar graph with dollar currency symbol. This image has been designed with graphic of bar graph, red colored growth arrow and symbols of dollar currency. Use this image slide, in your presentations to express views on finance, growth and achievements. This image slide may also be used to exhibit finance accounts in your presentations. This image slide will enhance the quality of your presentations.
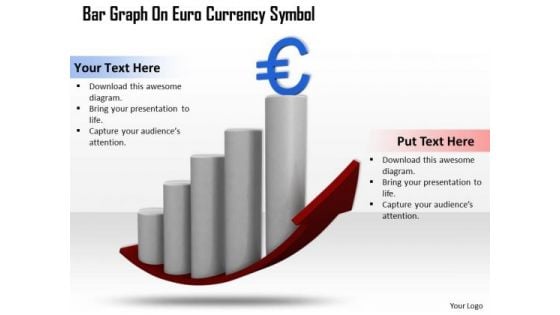
Stock Photo Bar Graph With Euro Currency Symbol PowerPoint Slide
This image slide displays bar graph with euro currency symbol. This image has been designed with graphic of bar graph, red colored growth arrow and symbols of euro currency. Use this image slide, in your presentations to express views on finance, growth and achievements. This image slide may also be used to exhibit finance accounts in your presentations. This image slide will enhance the quality of your presentations.
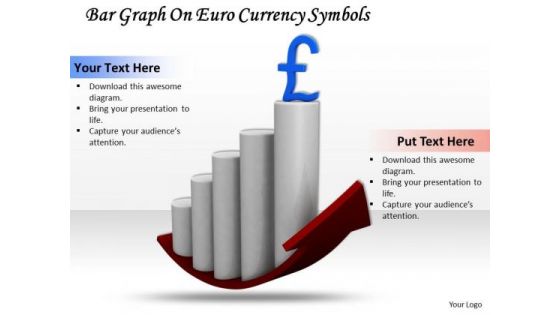
Stock Photo Bar Graph With Pound Currency Symbol PowerPoint Slide
This image slide displays bar graph with pound currency symbol. This image has been designed with graphic of bar graph, red colored growth arrow and symbols of pound currency. Use this image slide, in your presentations to express views on finance, growth and achievements. This image slide may also be used to exhibit finance accounts in your presentations. This image slide will enhance the quality of your presentations.

Stock Photo Bar Graph With Yen Currency Symbol PowerPoint Slide
This image slide displays bar graph with yen currency symbol. This image has been designed with graphic of bar graph, black colored growth arrow and symbols of pound currency. Use this image slide, in your presentations to express views on finance, growth and achievements. This image slide may also be used to exhibit finance accounts in your presentations. This image slide will enhance the quality of your presentations.
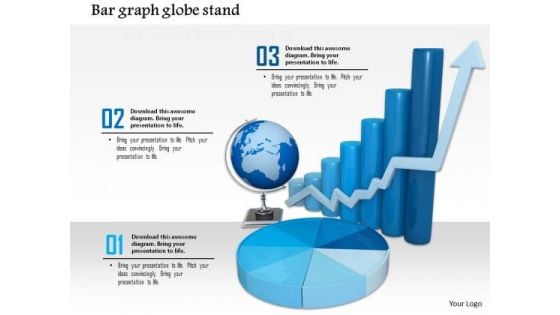
Stock Photo Globe With Bar Graph For Business PowerPoint Slide
This image slide displays globe with bar graph. This image has been designed with graphic of bar graph, pie char, globe and growth arrow. Use this image slide, in your presentations to express views on finance, global growth and success. This image slide may also be used to exhibit any information which requires visual presentation in your presentations. This image slide will enhance the quality of your presentations.
Stock Photo Business Graph With Colorful Bars PowerPoint Slide
This image is designed with business graph with colorful bars. Use this image slide in presentations related to business success, strategy planning etc. This template is innovatively designed to highlight your worthy views.
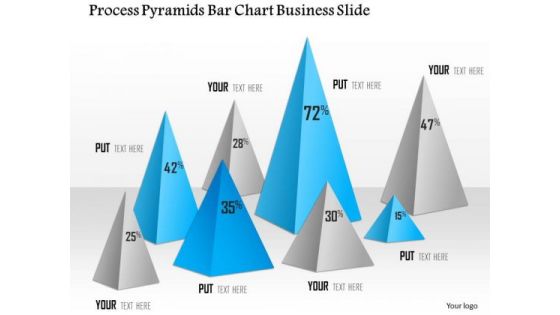
Business Diagram Process Pyramids Bar Chart Business Slide Presentation Template
Graphic of pyramid and bar chart has been used to design this power point template diagram. This PPT diagram contains the concept of business result analysis and process flow. Use this template slide and display result in your presentations.
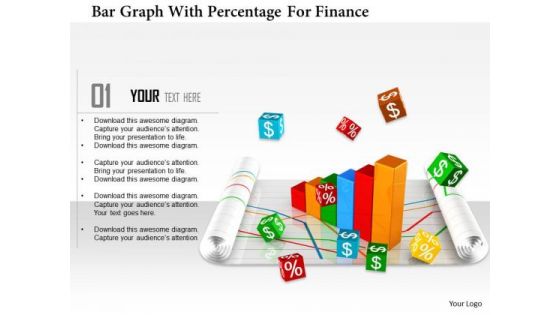
Stock Photo Bar Graph With Percentage For Finance PowerPoint Slide
This Power Point template has been designed with graphic of bar graph and percentage value. This image slide contains the concept of finance and accounting. Use this editable diagram for your business and finance related presentations.
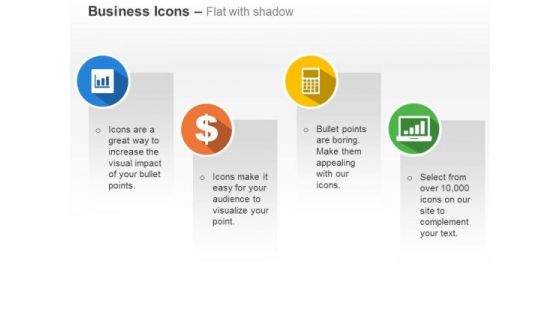
Bar Graph Dollar Calculator Laptop Ppt Slides Graphics
This PPT slide has been designed with icons of bar graph, dollar, calculator and laptop. Use these technical icons for technology related concepts. Use these professional icons to build quality presentation for technology related topics.
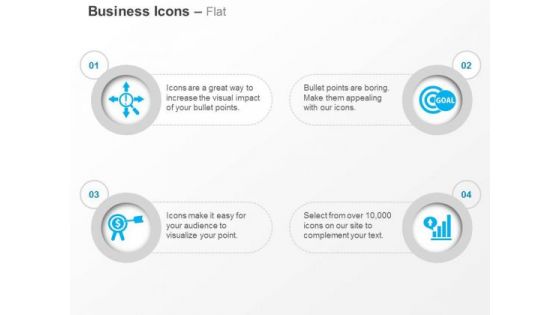
Time Management Target Goal Bar Graph Ppt Slides Graphics
This power point template has been crafted with icons of time management, target, goal and bar graph. This icon slide can be used for business analysis and time planning. Build an innovative presentation with all these professional icons.
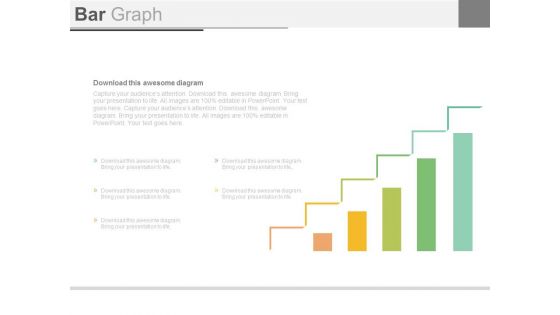
Bar Graph For Business Growth Steps Powerpoint Slides
This PowerPoint template contains design of bar graph with icons. You may download this slide to display strategy steps for business growth. You can easily customize this template to make it more unique as per your need.
Bar Graph For Marketing Research Data Powerpoint Slides
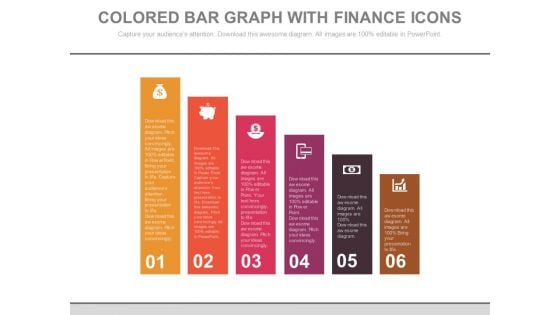
This PowerPoint template has been designed with diagram of bar graph. This PPT slide can be used to prepare presentations for profit growth report and also for financial data analysis. You can download finance PowerPoint template to prepare awesome presentations.
Bar Graph For Marketing Research Process Powerpoint Slides
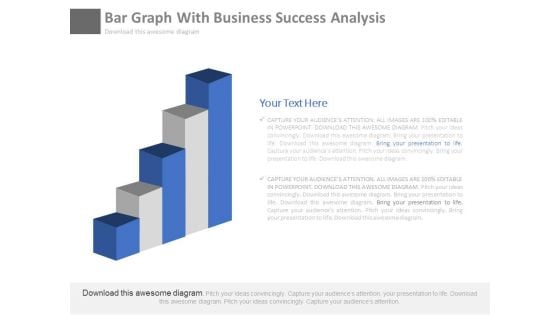
This PowerPoint template has been designed with diagram of bar graph. This PPT slide can be used to prepare presentations for profit growth report and also for financial data analysis. You can download finance PowerPoint template to prepare awesome presentations.
Bar Graph With Line Chart For Analysis Powerpoint Slides
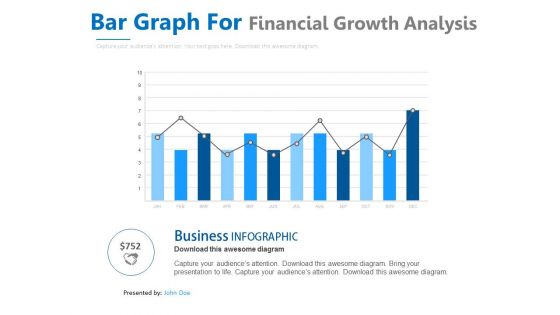
This PowerPoint template contains design of bar graph with line chart. You may download this slide to display strategy steps for business growth. You can easily customize this template to make it more unique as per your need.
Bar Graph With Yearly Statistical Analysis Powerpoint Slides
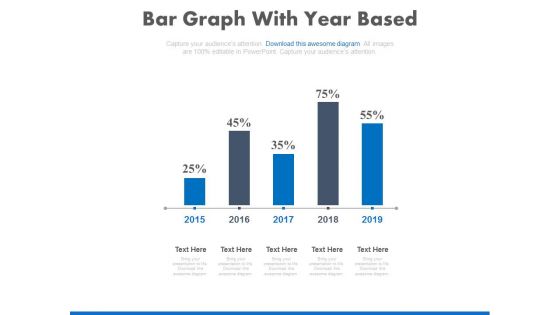
This PowerPoint template contains diagram of bar graph with yearly percentage ratios. You may download this slide to display statistical analysis. You can easily customize this template to make it more unique as per your need.
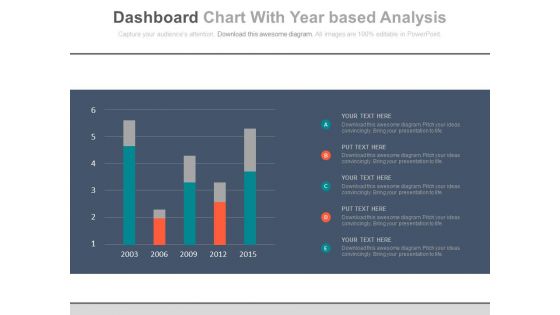
Bar Graph For Year Based Analysis Powerpoint Slides
This PowerPoint template has been designed with year based bar graph. This diagram may be used to display yearly statistical analysis. Use this PPT slide design to make impressive presentations.
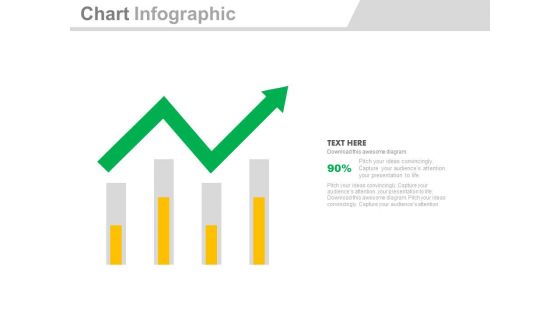
Four Bars With Green Growth Arrow Powerpoint Slides
Four bars with green arrow have been displayed in this business slide. This business diagram helps to exhibit process of business planning. Use this diagram to build an exclusive presentation.
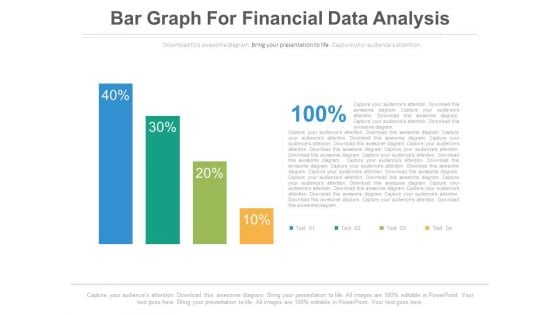
Bar Graph For Profit Growth Analysis Powerpoint Slides
This PowerPoint template has been designed with bar graph with percentage values. This diagram is useful to exhibit profit growth analysis. This diagram slide can be used to make impressive presentations.
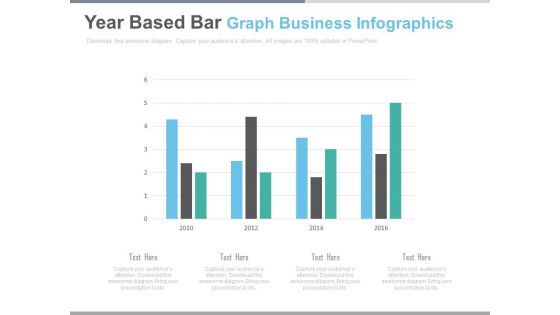
Bar Graph For Yearly Statistical Analysis Powerpoint Slides
This PowerPoint template has been designed with bar graph. This PowerPoint diagram is useful to exhibit yearly statistical analysis. This diagram slide can be used to make impressive presentations.
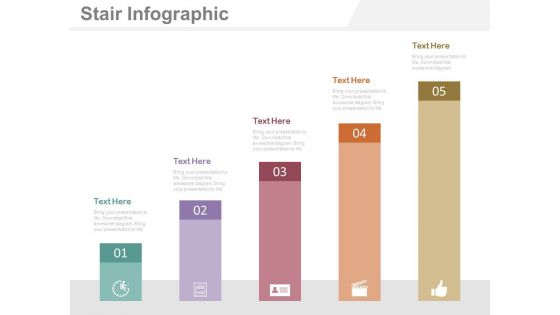
Five Steps Bar Graph For Financial Management Powerpoint Slides
This PowerPoint template has been designed with five steps bar graph and icons. This diagram is useful to exhibit financial management. This diagram slide can be used to make impressive presentations.
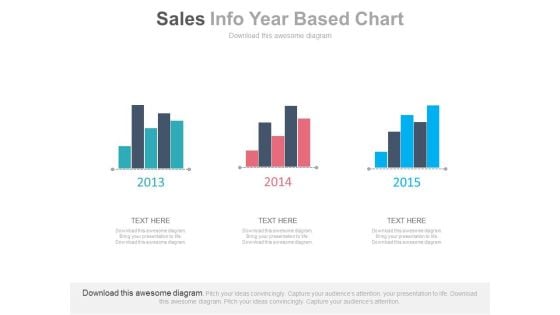
Three Years Sales Data Bar Graph Powerpoint Slides
This PowerPoint template has been designed with bar charts. This business slide may be used to display three years sales data for comparison. Present your views and ideas with this impressive design.
Map Diagram With Bar Graph And Icons Powerpoint Slides
This PowerPoint template displays graphics of map diagram with bar graph and icons. This Map template can be used in business presentations to depict economic analysis. This slide can also be used by school students for educational projects.
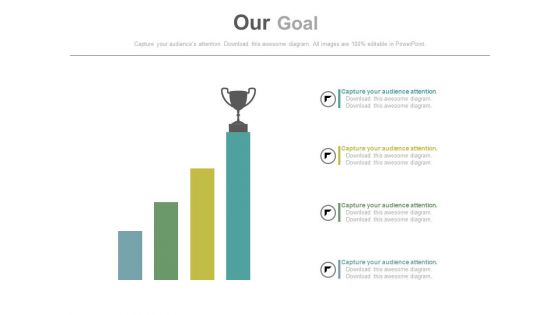
Growth Bar Graph With Trophy On Top Powerpoint Slides
This PowerPoint template has been designed with growth bar graph and trophy onto of it. Download this PPT slide to define and achieve goals with more success. This diagram may be used for goal planning related topics.
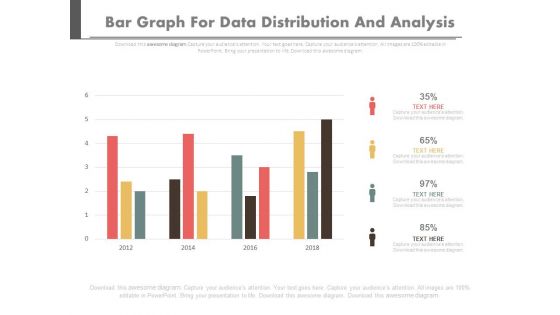
Bar Graph For Data Distribution And Analysis Powerpoint Slides
This PowerPoint template has been designed with bar graph. This PowerPoint diagram is useful for data distribution and analysis This diagram slide can be used to make impressive presentations.
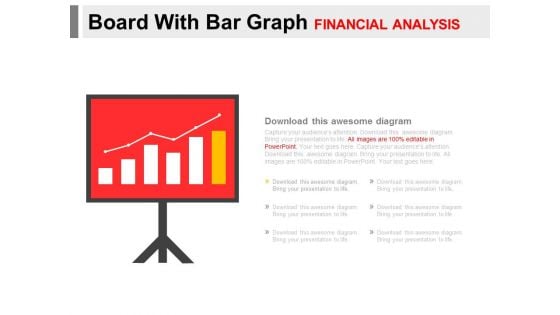
Board With Bar Graph For Financial Analysis Powerpoint Slides
You can download this PowerPoint template to display statistical data and analysis. This PPT slide contains display board with bar graph. Draw an innovative business idea using this professional diagram.
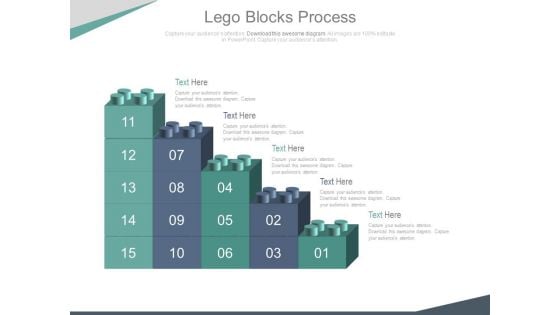
Bar Graph Of Lego Blocks For Data Analysis Powerpoint Slides
This PowerPoint template contains bar graph made of Lego blocks. You may use this slide to display growth process. This diagram provides an effective way of displaying information you can edit text, color, shade and style as per you need.
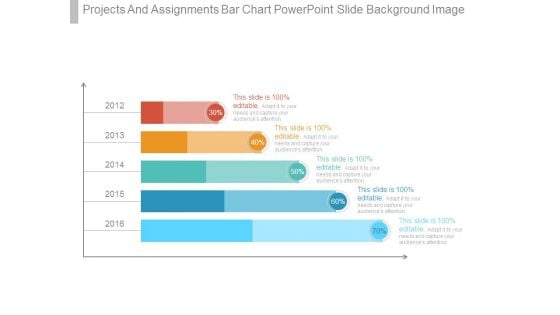
Projects And Assignments Bar Chart Powerpoint Slide Background Image
This is a projects and assignments bar chart powerpoint slide background image. This is a five stage process. The stages in this process are finance, presentation, business, strategy, marketing.

Bars For Digital Marketing Tools Ppt Examples Slides
This is a bars for digital marketing tools ppt examples slides. This is a seven stage process. The stages in this process are advertising, social, email, website, direct mail, seo ppc, events.
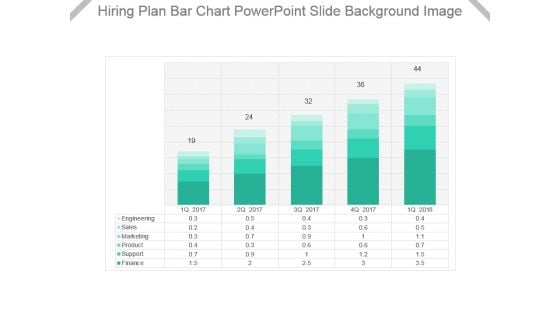
Hiring Plan Bar Chart Powerpoint Slide Background Image
This is a hiring plan bar chart powerpoint slide background image. This is a five stage process. The stages in this process are engineering, sales, marketing, product, support, finance.
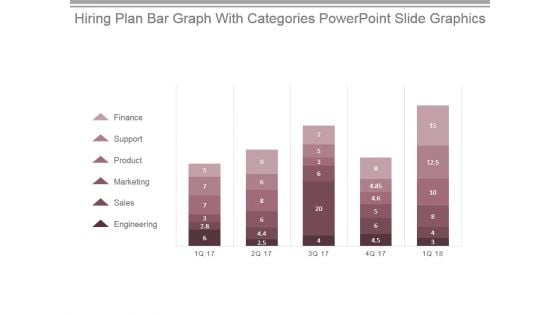
Hiring Plan Bar Graph With Categories Powerpoint Slide Graphics
This is a hiring plan bar graph with categories powerpoint slide graphics. This is a five stage process. The stages in this process are finance, support, product, marketing, sales, engineering.

Stakeholders Fund And Market Analysis Bar Graph Powerpoint Slide Information
This is a stakeholders fund and market analysis bar graph powerpoint slide information. This is a five stage process. The stages in this process are shareholders funds, market capitalization, market capitalization as a percentage of cse market capitalization.
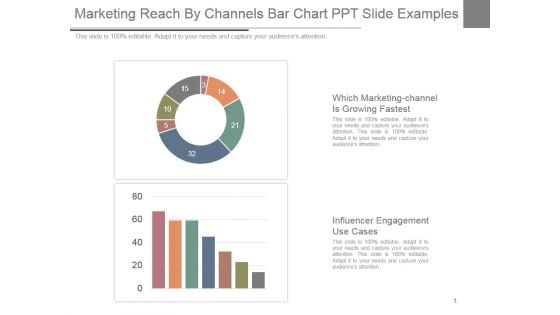
Marketing Reach By Channels Bar Chart Ppt Slide Examples
This is a marketing reach by channels bar chart ppt slide examples. This is a two stage process. The stages in this process are which marketing-channel is growing fastest, influencer engagement use cases.
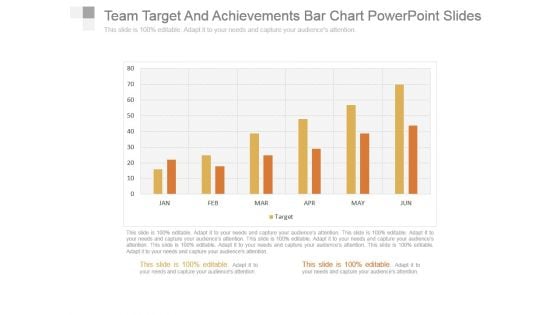
Team Target And Achievements Bar Chart Powerpoint Slides
This is a team target and achievements bar chart powerpoint slides. This is a six stage process. The stages in this process are business, success, graph chart, strategy, marketing.
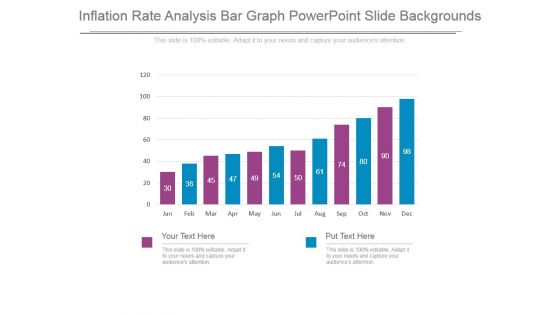
Inflation Rate Analysis Bar Graph Powerpoint Slide Backgrounds
This is a inflation rate analysis bar graph powerpoint slide backgrounds. This is a twelve stage process. The stages in this process are jan, feb, mar, apr, may, jun, jul, aug, sep, oct, nov, dec.
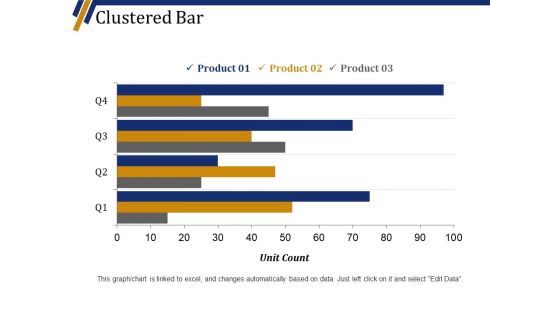
Clustered Bar Ppt PowerPoint Presentation Show Slide Portrait
This is a clustered bar ppt powerpoint presentation show slide portrait. This is a four stage process. The stages in this process are product, unit count, graph, business, marketing.
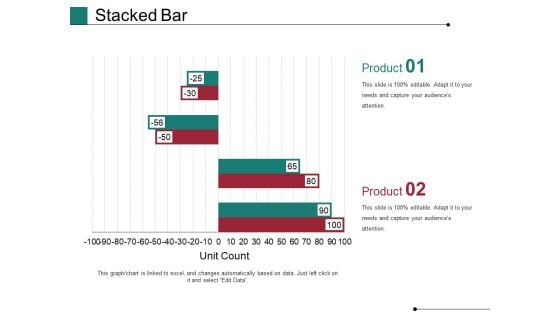
Stacked Bar Template 1 Ppt PowerPoint Presentation Show Slides
This is a stacked bar template 1 ppt powerpoint presentation show slides. This is a two stage process. The stages in this process are Unit Count, Business, Marketing, Graph, Finance.
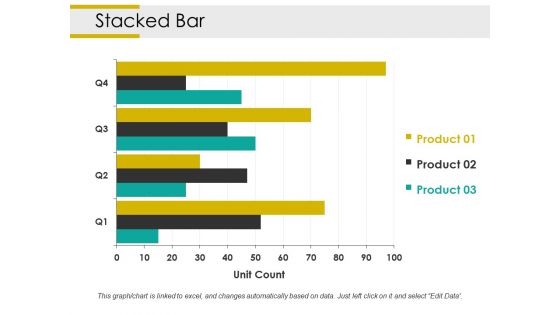
Stacked Bar Ppt PowerPoint Presentation Styles Slide Portrait
This is a stacked bar ppt powerpoint presentation styles slide portrait. This is a three stage process. The stages in this process are unit count, business, marketing, strategy, graph, finance.
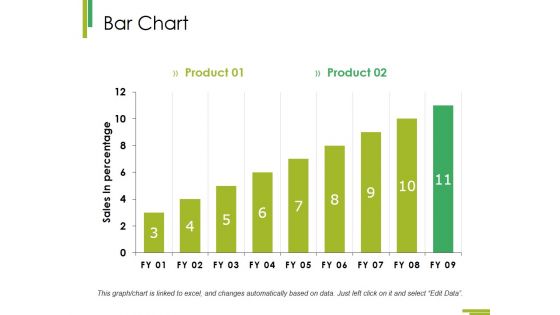
Bar Chart Ppt PowerPoint Presentation Infographic Template Master Slide
This is a bar chart ppt powerpoint presentation infographic template master slide. This is a two stage process. The stages in this process are growth, finance, business, analysis, marketing.
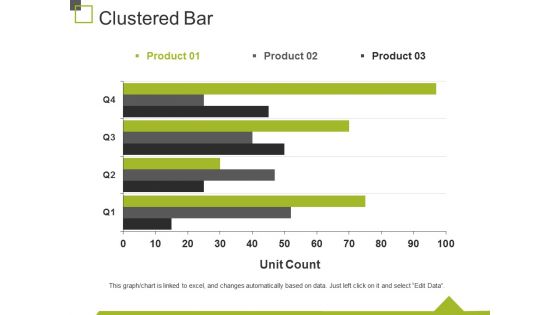
Clustered Bar Ppt PowerPoint Presentation Outline Slide Download
This is a clustered bar ppt powerpoint presentation outline slide download. This is a three stage process. The stages in this process are unit count, finance, marketing, business, graph.
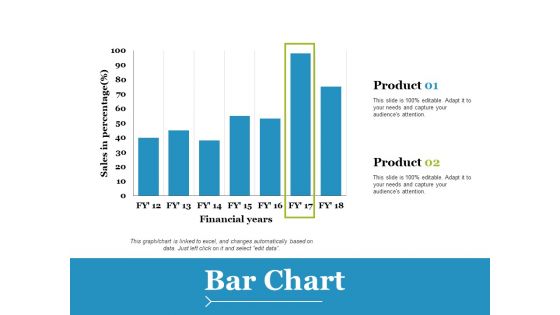
Bar Chart Ppt PowerPoint Presentation Slides Example File
This is a bar chart ppt powerpoint presentation slides example file. This is a two stage process. The stages in this process are product, financial years, sales in percentage.
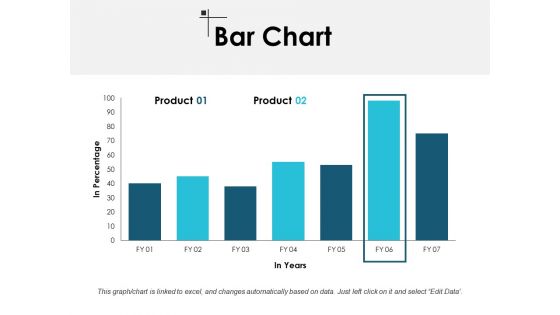
Bar Chart Finance Ppt PowerPoint Presentation Model Master Slide
This is a bar chart finance ppt powerpoint presentation model master slide. This is a two stage process. The stages in this process are finance, marketing, management, investment, analysis.
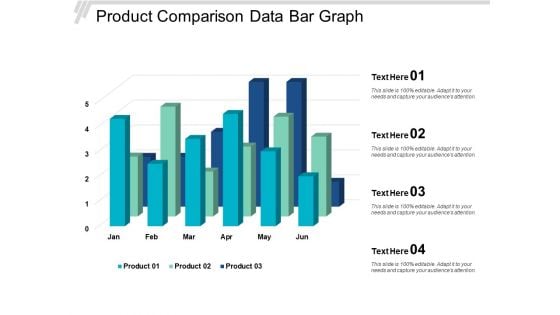
Product Comparison Data Bar Graph Ppt Powerpoint Presentation Slides Show
This is a product comparison data bar graph ppt powerpoint presentation slides show. This is a four stage process. The stages in this process are data presentation, content presentation, information presentation.
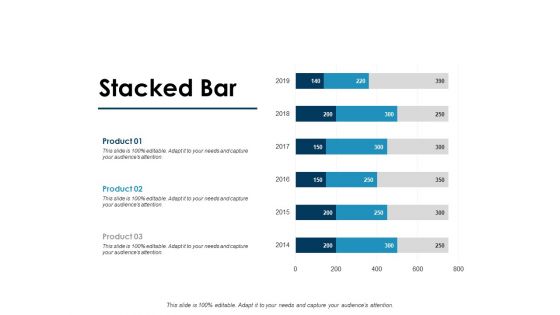
Stacked Bar Graph Ppt PowerPoint Presentation Portfolio Slide Portrait
This is a stacked bar graph ppt powerpoint presentation portfolio slide portrait. This is a three stage process. The stages in this process are finance, marketing, management, investment, analysis.
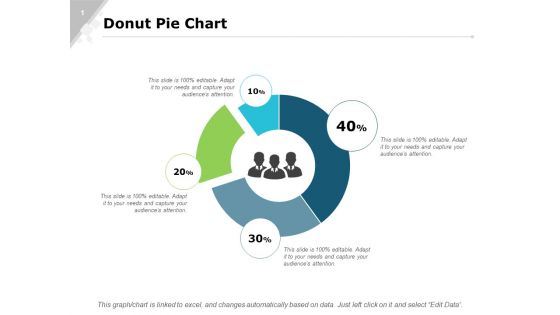
Donut Pie Chart Bar Ppt PowerPoint Presentation Infographics Slide Portrait
This is a donut pie chart bar ppt powerpoint presentation infographics slide portrait. This is a four stage process. The stages in this process are finance, marketing, analysis, investment, million.
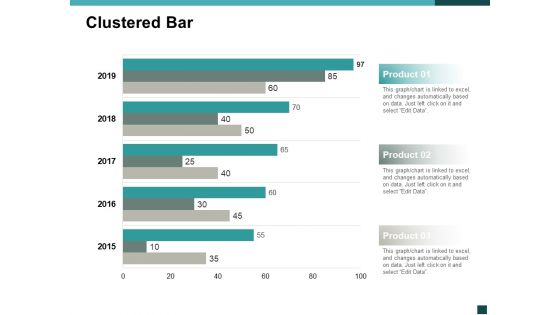
Clustered Bar Finance Ppt Powerpoint Presentation Portfolio Slide Portrait
This is a clustered bar finance ppt powerpoint presentation portfolio slide portrait. This is a three stage process. The stages in this process are finance, marketing, management, investment, analysis.
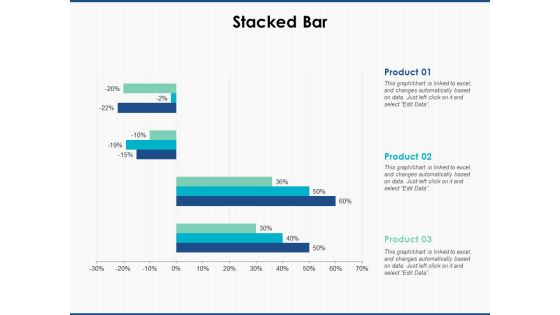
Stacked Bar Slide Planning Ppt PowerPoint Presentation Portfolio Ideas
This is a stacked bar slide planning ppt powerpoint presentation portfolio ideas. The topics discussed in this diagram are marketing, business, management, planning, strategy This is a completely editable PowerPoint presentation, and is available for immediate download.
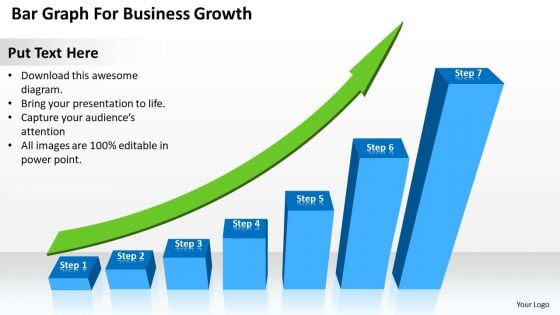
Bar Graph For Business Growth Ppt Plan PowerPoint Slides
Drum up support with our bar graph for business growth ppt plan PowerPoint Slides. They will come in droves to stand by you. Drum it up with our Arrows PowerPoint templates. Your thoughts will raise the tempo. Be the drummer with our Process and Flows PowerPoint templates. Let your thoughts create the beat. Achieve collaboration despite differences. Our Bar Graph For Business Growth Ppt Plan PowerPoint Slides encourage convergence.
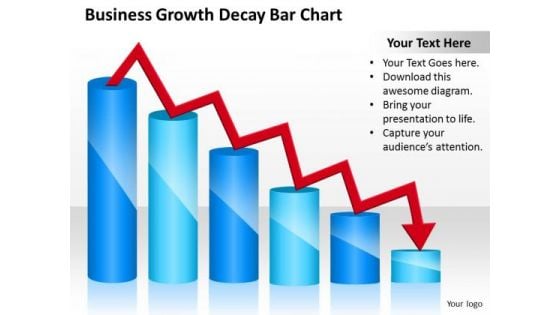
Consulting PowerPoint Template Bar Chart Ppt Templates Backgrounds For Slides
Our consulting PowerPoint template bar chart ppt templates backgrounds for slides heighten concentration. Your audience will be on the edge. Get an edge with our Marketing PowerPoint Templates. They give you advantage plus. Edit your work with our Arrows PowerPoint Templates. They will help you give the final form. Our Consulting PowerPoint Template Bar Chart Ppt Templates Backgrounds For Slides give you more than a fair chance. Add to your ability to succeed.
Employee Productivity Enhancement Plan Icon With Bar Graph Slides PDF
Persuade your audience using this Employee Productivity Enhancement Plan Icon With Bar Graph Slides PDF This PPT design covers three stages, thus making it a great tool to use. It also caters to a variety of topics including Employee Productivity, Enhancement Plan, Bar Graph Download this PPT design now to present a convincing pitch that not only emphasizes the topic but also showcases your presentation skills.

Enterprise Collaboration At Global Scale Ppt PowerPoint Presentation Complete Deck With Slides
This complete deck covers various topics and highlights important concepts. It has PPT slides which cater to your business needs. This complete deck presentation emphasizes enterprise collaboration at global scale ppt powerpoint presentation complete deck with slides and has templates with professional background images and relevant content. This deck consists of total of thirty nine slides. Our designers have created customizable templates, keeping your convenience in mind. You can edit the colour, text and font size with ease. Not just this, you can also add or delete the content if needed. Get access to this fully editable complete presentation by clicking the download button below.
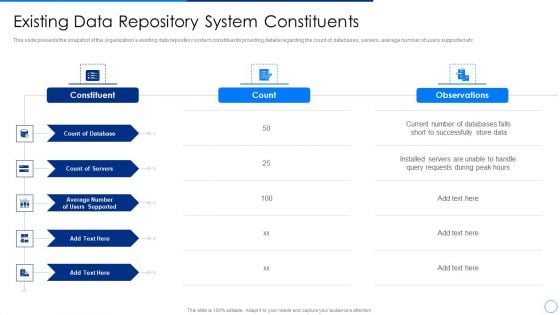
Scale Up Plan For Data Inventory Model Existing Data Repository System Constituents Slides PDF
This slide presents the snapshot of the organizations existing data repository system constituents providing details regarding the count of databases, servers, average number of users supported etc. Deliver and pitch your topic in the best possible manner with this scale up plan for data inventory model existing data repository system constituents slides pdf. Use them to share invaluable insights on count of databases, count of servers and impress your audience. This template can be altered and modified as per your expectations. So, grab it now.
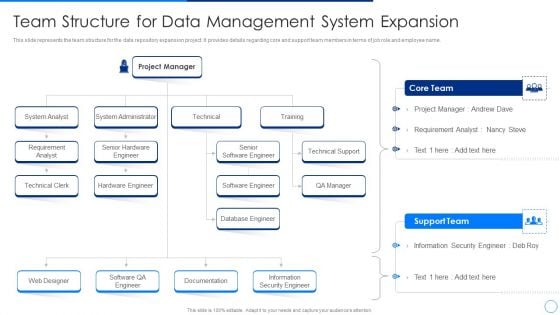
Scale Up Plan For Data Inventory Model Team Structure For Data Management System Expansion Slides PDF
This slide represents the team structure for the data repository expansion project. It provides details regarding core and support team members in terms of job role and employee name. Deliver an awe inspiring pitch with this creative scale up plan for data inventory model team structure for data management system expansion slides pdf bundle. Topics like analyst, technical, web designer, training, system administrator can be discussed with this completely editable template. It is available for immediate download depending on the needs and requirements of the user.

Scaling Cloud Infrastructure How To Review Cloud Architecture Ppt PowerPoint Presentation Complete Deck With Slides
Increase your chances of writing a winning business proposal and grabbing your prospects attention with this well-crafted, innovative Scaling Cloud Infrastructure How To Review Cloud Architecture Ppt PowerPoint Presentation Complete Deck With Slides. This twenty two-slide presentation template comes with in-built content to help you outline a presentation that can serve as an industry benchmark. The complete deck also makes use of an impressive color scheme to create a visual impact and hook the audience. Use this PPT to plan how your business can be the Numero uno in its segment within no time at all. Download now to showcase your brand USP and offerings to engage your client.

Amazon Strategic Growth Initiative On Global Scale Ppt PowerPoint Presentation Complete Deck With Slides
In this Amazon Strategic Growth Initiative On Global Scale Ppt PowerPoint Presentation Complete Deck With Slides, we detail the way one can plan on timelines innovation and making the best of resources. We also present to you the importance of documenting every major strategic move. In this eighty four slide presentation template, we also include umbrella concepts to make sure your authority as a handsome business person is enhanced. As always, the editable and customizable benefit is also provided making you emerge as the business Guru. Download now to establish your superiority in both running a business, and being confident enough to present about it.
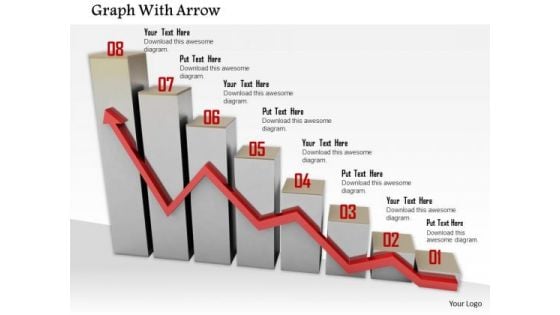
Stock Photo Red Growth Arrow On Bar Graph PowerPoint Slide
Explain the concepts of business growth with this unique image. This image has been designed with red growth arrow on bar graph. Use this image in business and finance related topics
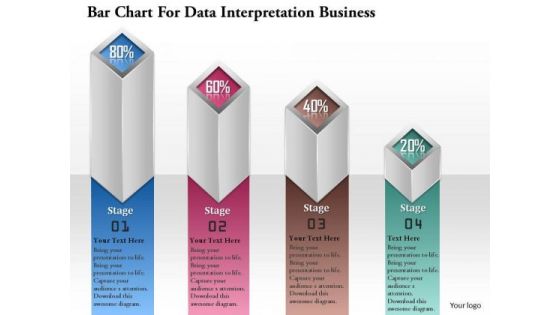
Consulting Slides Bar Chart For Data Interpretation Business Presentation
This pre-designed and appealing bar chart for PowerPoint offer an optimized possibility to illustrate your business strategy. You can use this diagram for data interpretation. This diagram is editable and can be easily adjusted.
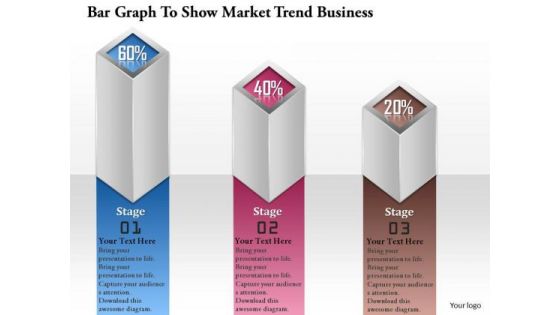
Consulting Slides Bar Graph To Show Market Trend Business Presentation
This bar graph can be very useful in presentations where you need to market trend. This can be used as a visualization tool because the audience can get a better view about what you want to show.
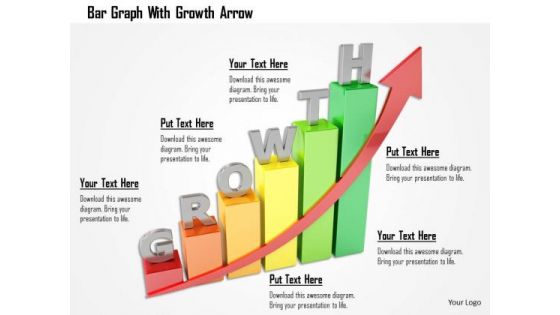
Stock Photo Bar Graph With Growth Arrow PowerPoint Slide
This creative image displays design of Bar Graph with Growth Arrow. This image has been designed to depict business on an Upward Trend. Create an impact with this quality image and make professional presentations.


 Continue with Email

 Home
Home


