Snapshot
Successful Guide For Ecommerce Promotion Dashboard To Track Ecommerce Website Download Pdf
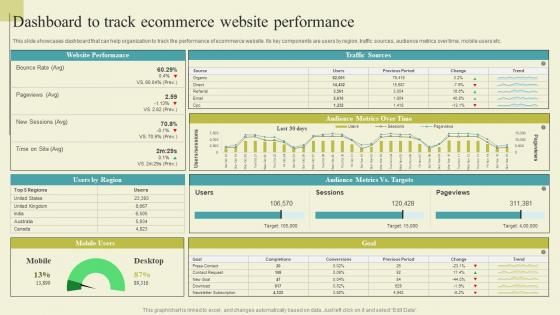
This slide showcases dashboard that can help organization to track the performance of ecommerce website. Its key components are users by region, traffic sources, audience metrics over time, mobile users etc. If you are looking for a format to display your unique thoughts, then the professionally designed Successful Guide For Ecommerce Promotion Dashboard To Track Ecommerce Website Download Pdf is the one for you. You can use it as a Google Slides template or a PowerPoint template. Incorporate impressive visuals, symbols, images, and other charts. Modify or reorganize the text boxes as you desire. Experiment with shade schemes and font pairings. Alter, share or cooperate with other people on your work. Download Successful Guide For Ecommerce Promotion Dashboard To Track Ecommerce Website Download Pdf and find out how to give a successful presentation. Present a perfect display to your team and make your presentation unforgettable. This slide showcases dashboard that can help organization to track the performance of ecommerce website. Its key components are users by region, traffic sources, audience metrics over time, mobile users etc.
Metric Dashboard Showcasing Management And Marketing Strategies For E Commerce Ideas Pdf
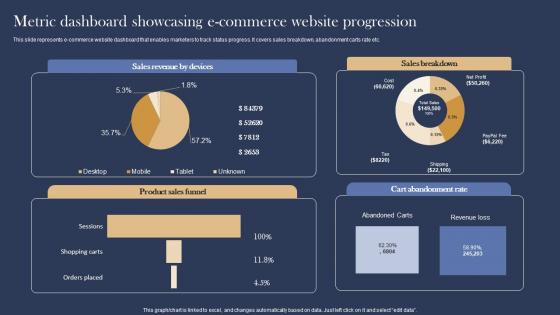
This slide represents e commerce website dashboard that enables marketers to track status progress. It covers sales breakdown, abandonment carts rate etc. Retrieve professionally designed Metric Dashboard Showcasing Management And Marketing Strategies For E Commerce Ideas Pdf to effectively convey your message and captivate your listeners. Save time by selecting pre made slideshows that are appropriate for various topics, from business to educational purposes. These themes come in many different styles, from creative to corporate, and all of them are easily adjustable and can be edited quickly. Access them as PowerPoint templates or as Google Slides themes. You do not have to go on a hunt for the perfect presentation because Slidegeeks got you covered from everywhere. This slide represents e commerce website dashboard that enables marketers to track status progress. It covers sales breakdown, abandonment carts rate etc.
Brand Extension Techniques Metric Dashboard To Track Product Success Strategy SS V
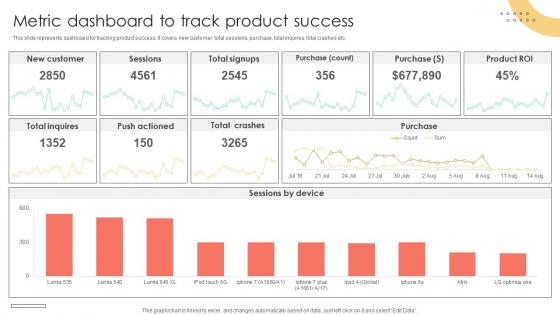
This slide represents dashboard for tracking product success. It covers new customer, total sessions, purchase, total inquires, total crashes etc. Welcome to our selection of the Brand Extension Techniques Metric Dashboard To Track Product Success Strategy SS V. These are designed to help you showcase your creativity and bring your sphere to life. Planning and Innovation are essential for any business that is just starting out. This collection contains the designs that you need for your everyday presentations. All of our PowerPoints are 100Percent editable, so you can customize them to suit your needs. This multi-purpose template can be used in various situations. Grab these presentation templates today. This slide represents dashboard for tracking product success. It covers new customer, total sessions, purchase, total inquires, total crashes etc.
Cybersecurity Risk Assessment Program Dashboard For Tracking Cyber Attack Risk Levels
Explore a selection of the finest Cybersecurity Risk Assessment Program Dashboard For Tracking Cyber Attack Risk Levels here. With a plethora of professionally designed and pre-made slide templates, you can quickly and easily find the right one for your upcoming presentation. You can use our Cybersecurity Risk Assessment Program Dashboard For Tracking Cyber Attack Risk Levels to effectively convey your message to a wider audience. Slidegeeks has done a lot of research before preparing these presentation templates. The content can be personalized and the slides are highly editable. Grab templates today from Slidegeeks. This slide represents Cybersecurity Risk Assessment Program Dashboard to effectively track cyber security risk levels. This will provide a structured approach for organizations to review and mitigate cyber threats. It includes multiple threat agents, attack methods, and preventive controls implemented with detailed insights, and it shows critical metrics including risk scores, the number of infected systems, and detected vulnerabilities.
Customer Behavioral Data And Analytics Marketing Dashboard Template Professional PDF
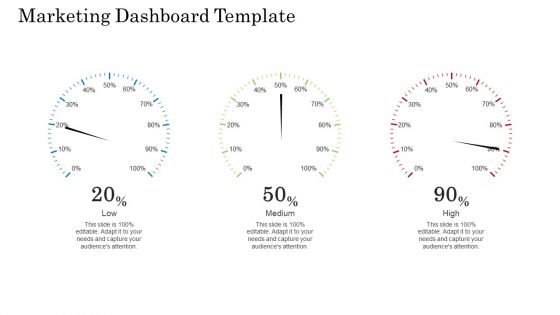
Presenting customer behavioral data and analytics marketing dashboard template professional pdf to provide visual cues and insights. Share and navigate important information on three stages that need your due attention. This template can be used to pitch topics like marketing dashboard template. In addtion, this PPT design contains high resolution images, graphics, etc, that are easily editable and available for immediate download.
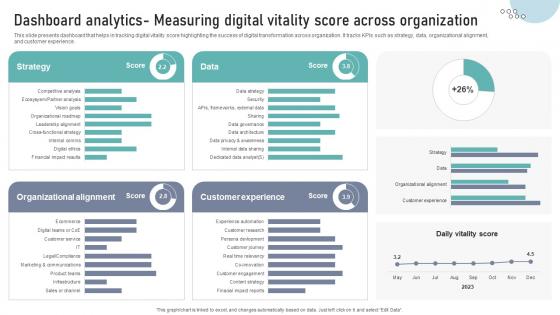
Dashboard Analytics Measuring Digital Vitality Score Across Organization DT SS V
This slide presents dashboard that helps in tracking digital vitality score highlighting the success of digital transformation across organization. It tracks KPIs such as strategy, data, organizational alignment,and customer experience.Make sure to capture your audiences attention in your business displays with our gratis customizable Dashboard Analytics Measuring Digital Vitality Score Across Organization DT SS V. These are great for business strategies, office conferences, capital raising or task suggestions. If you desire to acquire more customers for your tech business and ensure they stay satisfied, create your own sales presentation with these plain slides. This slide presents dashboard that helps in tracking digital vitality score highlighting the success of digital transformation across organization. It tracks KPIs such as strategy, data, organizational alignment,and customer experience.
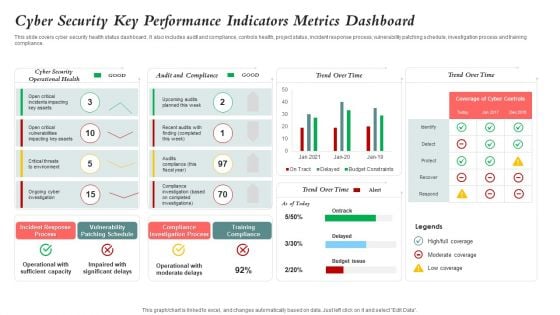
Cyber Security Key Performance Indicators Metrics Dashboard Mockup PDF
This slide covers cyber security health status dashboard . It also includes audit and compliance, controls health, project status, incident response process, vulnerability patching schedule, investigation process and training compliance. Pitch your topic with ease and precision using this Cyber Security Key Performance Indicators Metrics Dashboard Mockup PDF. This layout presents information on Cyber Security, Vulnerability Patching Schedule, Compliance Investigation Process. It is also available for immediate download and adjustment. So, changes can be made in the color, design, graphics or any other component to create a unique layout.
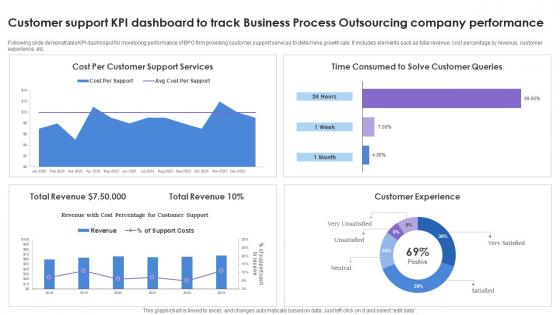
Customer Support KPI Dashboard To Track Business Process Outsourcing Company Performance Rules Pdf Wd
Following slide demonstrates KPI dashboard for monitoring performance of BPO firm providing customer support services to determine growth rate. It includes elements such as total revenue, cost percentage by revenue, customer experience, etc. Showcasing this set of slides titled Customer Support KPI Dashboard To Track Business Process Outsourcing Company Performance Rules Pdf Wd. The topics addressed in these templates are Customer Experience, Total Revenue. All the content presented in this PPT design is completely editable. Download it and make adjustments in color, background, font etc. as per your unique business setting. Following slide demonstrates KPI dashboard for monitoring performance of BPO firm providing customer support services to determine growth rate. It includes elements such as total revenue, cost percentage by revenue, customer experience, etc.
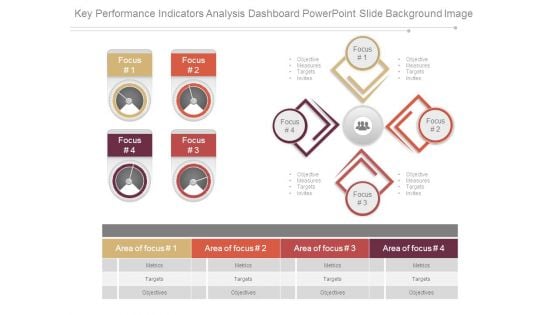
Key Performance Indicators Analysis Dashboard Powerpoint Slide Background Image
This is a key performance indicators analysis dashboard powerpoint slide background image. This is a four stage process. The stages in this process are focus, objective measures targets invites, area of focus, metrics, targets, objectives.
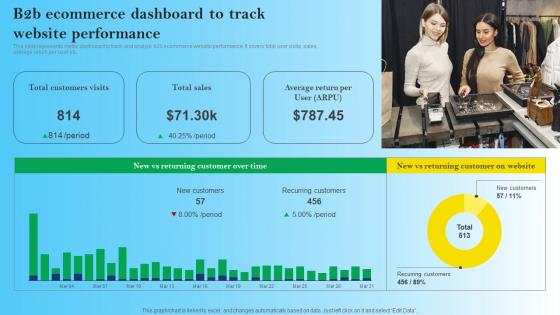
B2B Ecommerce Dashboard To Track Website Performance B2B Digital Commerce Infographics Pdf
This slide represents metric dashboard to track and analyze b2b ecommerce website performance. It covers total user visits, sales, average return per user etc. The B2B Ecommerce Dashboard To Track Website Performance B2B Digital Commerce Infographics Pdf is a compilation of the most recent design trends as a series of slides. It is suitable for any subject or industry presentation, containing attractive visuals and photo spots for businesses to clearly express their messages. This template contains a variety of slides for the user to input data, such as structures to contrast two elements, bullet points, and slides for written information. Slidegeeks is prepared to create an impression. This slide represents metric dashboard to track and analyze b2b ecommerce website performance. It covers total user visits, sales, average return per user etc.
Data Breach Prevention Status Tracking Dashboard Data Fortification Strengthening Defenses
This slide represents the critical cyber security performance indicators for the organization. The key components include application health, encryption status, license consumption, windows defender, etc.Are you in need of a template that can accommodate all of your creative concepts This one is crafted professionally and can be altered to fit any style. Use it with Google Slides or PowerPoint. Include striking photographs, symbols, depictions, and other visuals. Fill, move around, or remove text boxes as desired. Test out color palettes and font mixtures. Edit and save your work, or work with colleagues. Download Data Breach Prevention Status Tracking Dashboard Data Fortification Strengthening Defenses and observe how to make your presentation outstanding. Give an impeccable presentation to your group and make your presentation unforgettable. This slide represents the critical cyber security performance indicators for the organization. The key components include application health, encryption status, license consumption, windows defender, etc.

Key Performance Indicators Template 1 Ppt PowerPoint Presentation Styles Mockup
This is a key performance indicators template 1 ppt powerpoint presentation styles mockup. This is a four stage process. The stages in this process are dashboard, meter, business, marketing, speed.
Data Breach Prevention Status Tracking Dashboard Data Breach Prevention Information Pdf
This slide represents the critical cyber security performance indicators for the organization. The key components include application health, encryption status, license consumption, windows defender, etc. Crafting an eye-catching presentation has never been more straightforward. Let your presentation shine with this tasteful yet straightforward Data Breach Prevention Status Tracking Dashboard Data Breach Prevention Information Pdf template. It offers a minimalistic and classy look that is great for making a statement. The colors have been employed intelligently to add a bit of playfulness while still remaining professional. Construct the ideal Data Breach Prevention Status Tracking Dashboard Data Breach Prevention Information Pdf that effortlessly grabs the attention of your audience Begin now and be certain to wow your customers This slide represents the critical cyber security performance indicators for the organization. The key components include application health, encryption status, license consumption, windows defender, etc.
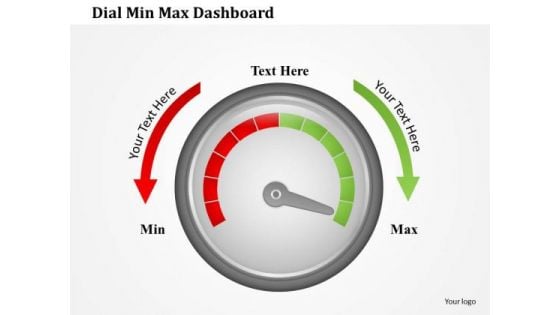
Business Framework Dial Min Max Dashboard PowerPoint Presentation
This professional power point template slide has been crafted with graphic of two funnels. These funnels are used to show any data calculation or process flow. Use this PPT for your business presentation and become a professional presenter.
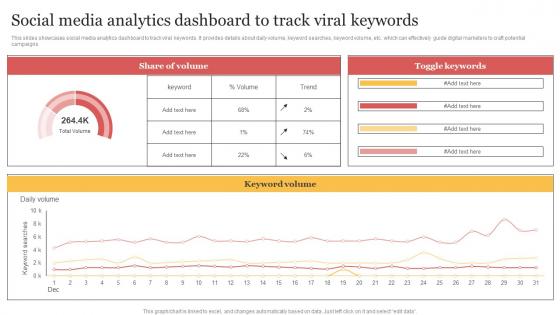
Social Media Analytics Dashboard To Track Viral Keywords Organizing Buzzworthy Social Themes Pdf
This slides showcases social media analytics dashboard to track viral keywords. It provides details about daily volume, keyword searches, keyword volume, etc. which can effectively guide digital marketers to craft potential campaigns. The Social Media Analytics Dashboard To Track Viral Keywords Organizing Buzzworthy Social Themes Pdf is a compilation of the most recent design trends as a series of slides. It is suitable for any subject or industry presentation, containing attractive visuals and photo spots for businesses to clearly express their messages. This template contains a variety of slides for the user to input data, such as structures to contrast two elements, bullet points, and slides for written information. Slidegeeks is prepared to create an impression. This slides showcases social media analytics dashboard to track viral keywords. It provides details about daily volume, keyword searches, keyword volume, etc. which can effectively guide digital marketers to craft potential campaigns.
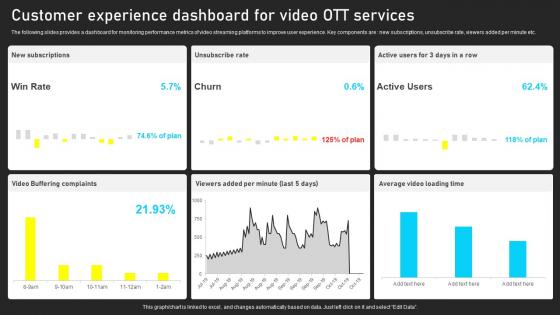
Customer Experience Dashboard For Video OTT Ervices Introduction Pdf
The following slides provides a dashboard for monitoring performance metrics of video streaming platforms to improve user experience. Key components are new subscriptions, unsubscribe rate, viewers added per minute etc. Pitch your topic with ease and precision using this Customer Experience Dashboard For Video OTT Ervices Introduction Pdf. This layout presents information on Customer Experience Dashboard, Video OTT Services. It is also available for immediate download and adjustment. So, changes can be made in the color, design, graphics or any other component to create a unique layout. The following slides provides a dashboard for monitoring performance metrics of video streaming platforms to improve user experience. Key components are new subscriptions, unsubscribe rate, viewers added per minute etc.
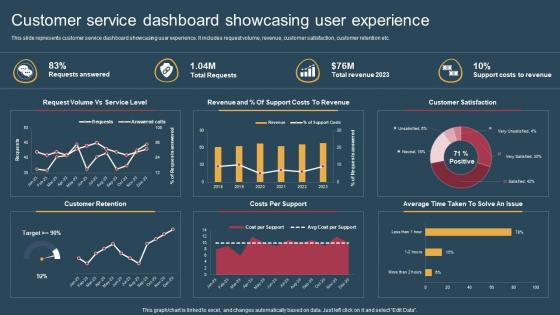
Customer Service Dashboard Conversion Of Customer Support Services Pictures Pdf
This slide represents customer service dashboard showcasing user experience. It includes request volume, revenue, customer satisfaction, customer retention etc. Get a simple yet stunning designed Customer Service Dashboard Conversion Of Customer Support Services Pictures Pdf. It is the best one to establish the tone in your meetings. It is an excellent way to make your presentations highly effective. So, download this PPT today from Slidegeeks and see the positive impacts. Our easy to edit Customer Service Dashboard Conversion Of Customer Support Services Pictures Pdf can be your go to option for all upcoming conferences and meetings. So, what are you waiting for Grab this template today. This slide represents customer service dashboard showcasing user experience. It includes request volume, revenue, customer satisfaction, customer retention etc.
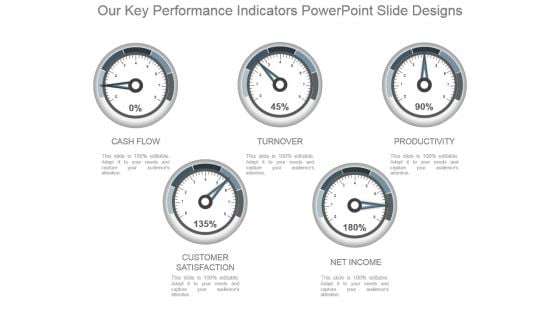
Our Key Performance Indicators Powerpoint Slide Designs
This is a our key performance indicators powerpoint slide designs. This is a five stage process. The stages in this process are cash flow, turnover, productivity, customer satisfaction, net income.
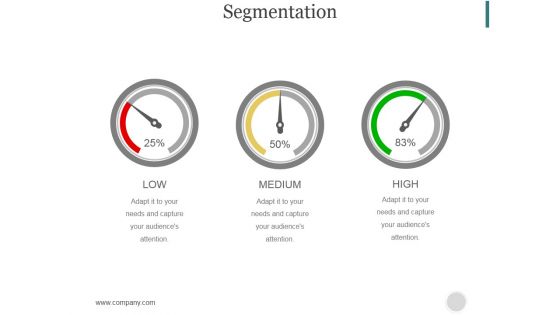
Segmentation Ppt PowerPoint Presentation Portfolio
This is a segmentation ppt powerpoint presentation portfolio. This is a three stage process. The stages in this process are low, medium, high.
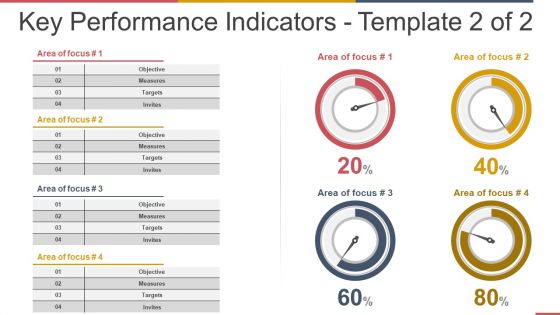
Key Performance Indicators Template 2 Ppt PowerPoint Presentation Ideas Background Images
This is a key performance indicators template 2 ppt powerpoint presentation ideas background images. This is a four stage process. The stages in this process are objective, measures, targets, invites.
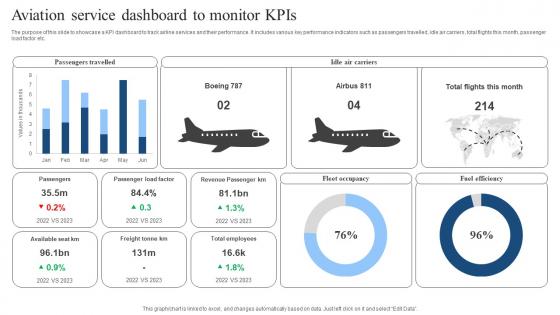
Aviation Service Dashboard To Monitor KPIs Download Pdf
The purpose of this slide to showcase a KPI dashboard to track airline services and their performance. It includes various key performance indicators such as passengers travelled, idle air carriers, total flights this month, passenger load factor etc. Pitch your topic with ease and precision using this Aviation Service Dashboard To Monitor KPIs Download Pdf. This layout presents information on Fleet Occupancy, Fuel Efficiency, Passengers Travelled. It is also available for immediate download and adjustment. So, changes can be made in the color, design, graphics or any other component to create a unique layout. The purpose of this slide to showcase a KPI dashboard to track airline services and their performance. It includes various key performance indicators such as passengers travelled, idle air carriers, total flights this month, passenger load factor etc.
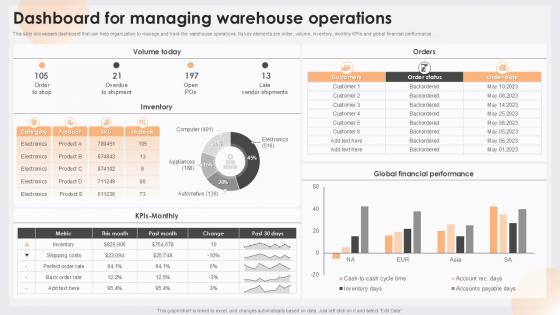
Dashboard For Managing Warehouse Determining Ideal Quantity To Procure Inventor
The best PPT templates are a great way to save time, energy, and resources. Slidegeeks have 100 percent editable powerpoint slides making them incredibly versatile. With these quality presentation templates, you can create a captivating and memorable presentation by combining visually appealing slides and effectively communicating your message. Download Dashboard For Managing Warehouse Determining Ideal Quantity To Procure Inventor from Slidegeeks and deliver a wonderful presentation. This slide depicts a dashboard for managing and tracking warehouse operations. It includes key elements such as order, volume, inventory, monthly KPIs, and global financial performance
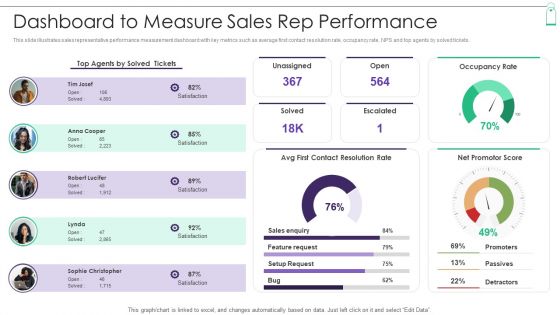
New Product Sales Strategy And Marketing Dashboard To Measure Sales Rep Performance Guidelines PDF
This slide illustrates sales representative performance measurement dashboard with key metrics such as average first contact resolution rate, occupancy rate, NPS and top agents by solved tickets. Deliver an awe inspiring pitch with this creative New Product Sales Strategy And Marketing Dashboard To Measure Sales Rep Performance Guidelines PDF bundle. Topics like Contact Resolution Rate, Contact Resolution Rate, Net Promoter Score can be discussed with this completely editable template. It is available for immediate download depending on the needs and requirements of the user.
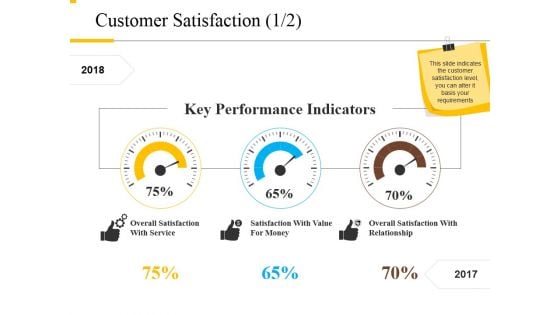
Customer Satisfaction Template 1 Ppt PowerPoint Presentation Infographics Outfit
This is a customer satisfaction template 1 ppt powerpoint presentation infographics outfit. This is a three stage process. The stages in this process are key performance indicators, overall satisfaction with service, satisfaction with value for money.

Customer Satisfaction Template 1 Ppt PowerPoint Presentation Ideas Tips
This is a customer satisfaction template 1 ppt powerpoint presentation ideas tips. This is a three stage process. The stages in this process are key performance indicators, overall satisfaction with service, satisfaction with value for money.
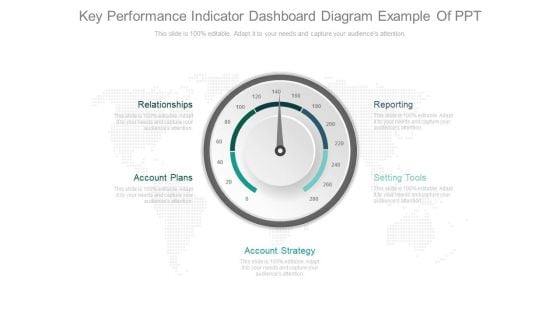
Key Performance Indicator Dashboard Diagram Example Of Ppt
This is a key performance indicator dashboard diagram example of ppt. This is a five stage process. The stages in this process are relationships, account plans, account strategy, setting tools, reporting.
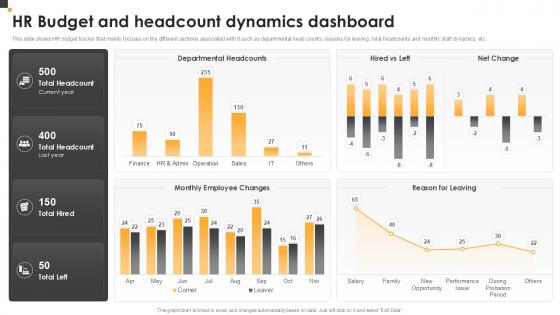
HR Budget And Headcount Dynamics Dashboard HR Budget Planning Ppt Slide
There are so many reasons you need a HR Budget And Headcount Dynamics Dashboard HR Budget Planning Ppt Slide. The first reason is you can not spend time making everything from scratch, Thus, Slidegeeks has made presentation templates for you too. You can easily download these templates from our website easily. This HR Budget Tracker slide provides a comprehensive overview of various key HR metrics, including departmental headcounts, reasons for employee departures, total staff count, and monthly staff dynamics. It is designed to help HR professionals efficiently monitor and manage personnel-related costs, providing valuable insights into workforce changes and trends.
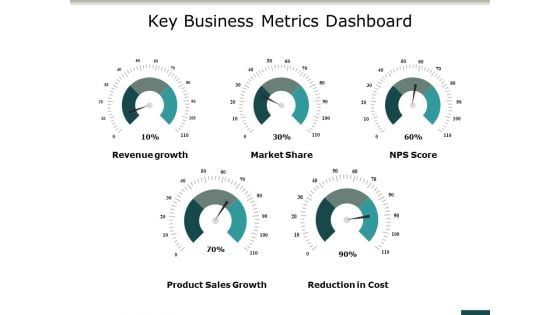
Key Business Metrics Dashboard Ppt PowerPoint Presentation File Objects
This is a key business metrics dashboard ppt powerpoint presentation file objects. This is a five stage process. The stages in this process are business, management, marketing, dashboard.
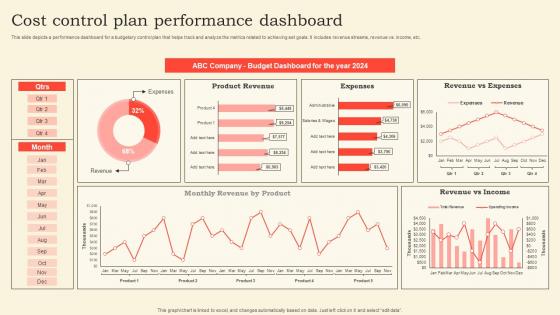
Cost Control Plan Performance Dashboard Pictures Pdf
This slide depicts a performance dashboard for a budgetary control plan that helps track and analyze the metrics related to achieving set goals. It includes revenue streams, revenue vs. income, etc. Pitch your topic with ease and precision using this Cost Control Plan Performance Dashboard Pictures Pdf. This layout presents information on Dashboard, Expenses, Income. It is also available for immediate download and adjustment. So, changes can be made in the color, design, graphics or any other component to create a unique layout. This slide depicts a performance dashboard for a budgetary control plan that helps track and analyze the metrics related to achieving set goals. It includes revenue streams, revenue vs. income, etc.
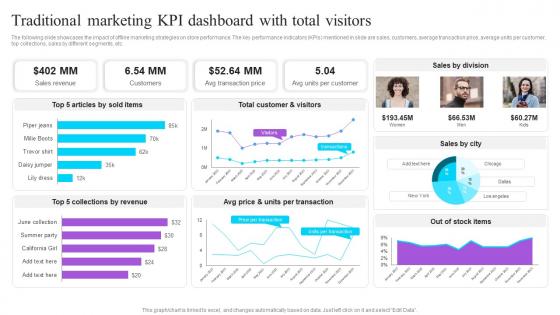
Traditional Marketing KPI Dashboard With Total Visitors Effective GTM Techniques Pictures PDF
The following slide showcases the impact of offline marketing strategies on store performance. The key performance indicators KPIs mentioned in slide are sales, customers, average transaction price, average units per customer, top collections, sales by different segments, etc. Create an editable Traditional Marketing KPI Dashboard With Total Visitors Effective GTM Techniques Pictures PDF that communicates your idea and engages your audience. Whether you are presenting a business or an educational presentation, pre-designed presentation templates help save time. Traditional Marketing KPI Dashboard With Total Visitors Effective GTM Techniques Pictures PDF is highly customizable and very easy to edit, covering many different styles from creative to business presentations. Slidegeeks has creative team members who have crafted amazing templates. So, go and get them without any delay. The following slide showcases the impact of offline marketing strategies on store performance. The key performance indicators KPIs mentioned in slide are sales, customers, average transaction price, average units per customer, top collections, sales by different segments, etc.
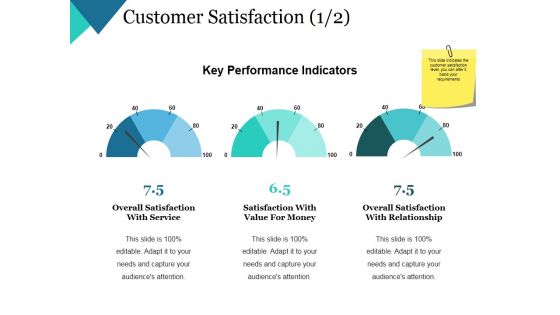
Customer Satisfaction Template 1 Ppt PowerPoint Presentation Pictures Gridlines
This is a customer satisfaction template 1 ppt powerpoint presentation pictures gridlines. This is a three stage process. The stages in this process are key performance indicators, business, management, strategy, dashboard.
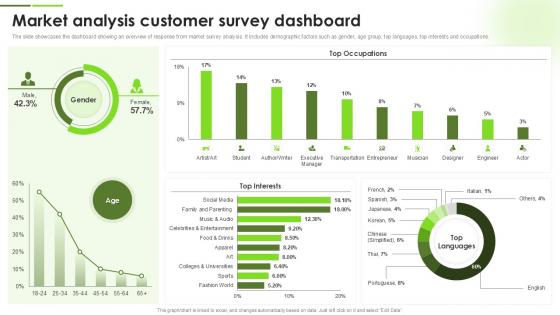
Market Analysis Customer Survey Dashboard
Present like a pro with Market Analysis Customer Survey Dashboard. Create beautiful presentations together with your team, using our easy-to-use presentation slides. Share your ideas in real-time and make changes on the fly by downloading our templates. So whether you are in the office, on the go, or in a remote location, you can stay in sync with your team and present your ideas with confidence. With Slidegeeks presentation got a whole lot easier. Grab these presentations today. This slide represents market survey analysis dashboard, providing a clear overview of responses. It highlights key demographic factors, including gender, age groups, top languages, interests, and occupations, offering valuable insights into the target audience.

ETL Data Integration Monitoring Dashboard Data Integration Strategies For Business
This slide represents the dashboard to track the data integration implementation plan. The purpose of this slide is to showcase the ETL data integration tools, and the components include data sources, checks, last incident, and last check. Are you searching for a ETL Data Integration Monitoring Dashboard Data Integration Strategies For Business that is uncluttered, straightforward, and original Its easy to edit, and you can change the colors to suit your personal or business branding. For a presentation that expresses how much effort you have put in, this template is ideal With all of its features, including tables, diagrams, statistics, and lists, its perfect for a business plan presentation. Make your ideas more appealing with these professional slides. Download ETL Data Integration Monitoring Dashboard Data Integration Strategies For Business from Slidegeeks today. This slide represents the dashboard to track the data integration implementation plan. The purpose of this slide is to showcase the ETL data integration tools, and the components include data sources, checks, last incident, and last check.
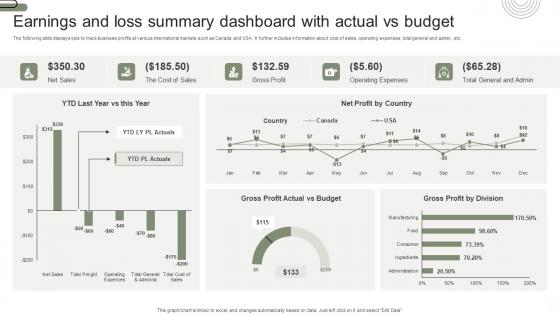
Earnings And Loss Summary Dashboard With Actual Vs Budget Pictures Pdf
The following slide displays kpis to track business profits at various international markets such as Canada and USA. It further includes information about cost of sales, operating expenses, total general and admin, etc. Showcasing this set of slides titled Earnings And Loss Summary Dashboard With Actual Vs Budget Pictures Pdf. The topics addressed in these templates are Earnings And Loss, Summary Dashboard, Actual Vs Budget. All the content presented in this PPT design is completely editable. Download it and make adjustments in color, background, font etc. as per your unique business setting. The following slide displays kpis to track business profits at various international markets such as Canada and USA. It further includes information about cost of sales, operating expenses, total general and admin, etc.
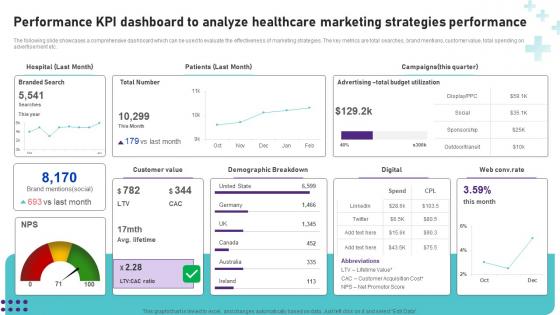
Performance KPI Dashboard To Analyze Healthcare Operational Areas Healthcare Rules PDF
Do you know about Slidesgeeks Performance KPI Dashboard To Analyze Healthcare Operational Areas Healthcare Rules PDF These are perfect for delivering any kind od presentation. Using it, create PowerPoint presentations that communicate your ideas and engage audiences. Save time and effort by using our pre-designed presentation templates that are perfect for a wide range of topic. Our vast selection of designs covers a range of styles, from creative to business, and are all highly customizable and easy to edit. Download as a PowerPoint template or use them as Google Slides themes. The following slide showcases a comprehensive dashboard which can be used to evaluate the effectiveness of marketing strategies. The key metrics are total searches, brand mentions, customer value, total spending on advertisement etc.
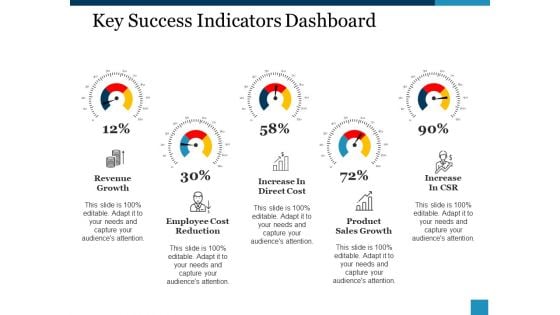
Key Success Indicators Dashboard Ppt PowerPoint Presentation Inspiration Guide
This is a key success indicators dashboard ppt powerpoint presentation inspiration guide. This is a five stage process. The stages in this process are revenue growth, increase in direct cost, increase in csr, employee cost reduction, product, sales growth.

Product Analytics KPI Dashboard For Lead Generation Product Analytics Implementation Data Analytics V
This slide illustrates a dashboard to monitor the lead generation on website page using product analytics aimed at making necessary improvements. It covers insights regarding analysis of lead conversions, event retention rate and page views.Do you have to make sure that everyone on your team knows about any specific topic I yes, then you should give Product Analytics KPI Dashboard For Lead Generation Product Analytics Implementation Data Analytics V a try. Our experts have put a lot of knowledge and effort into creating this impeccable Product Analytics KPI Dashboard For Lead Generation Product Analytics Implementation Data Analytics V. You can use this template for your upcoming presentations, as the slides are perfect to represent even the tiniest detail. You can download these templates from the Slidegeeks website and these are easy to edit. So grab these today This slide illustrates a dashboard to monitor the lead generation on website page using product analytics aimed at making necessary improvements. It covers insights regarding analysis of lead conversions, event retention rate and page views
Companys Data Safety Recognition Security Awareness Tracking Kpis Ideas PDF
This slide covers the key performance for security awareness training including compliance, security culture and incident reduction. This is a companys data safety recognition security awareness tracking kpis ideas pdf template with various stages. Focus and dispense information on three stages using this creative set, that comes with editable features. It contains large content boxes to add your information on topics like compliance, incident reduction, security culture. You can also showcase facts, figures, and other relevant content using this PPT layout. Grab it now.
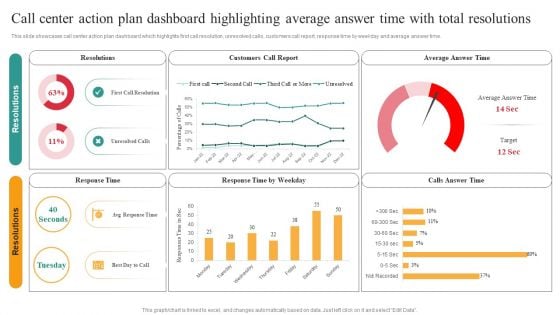
Comprehensive Guide For Enhancing Performance Of Customer Service Center Call Center Action Plan Dashboard Infographics PDF
This slide showcases call center action plan dashboard which highlights first call resolution, unresolved calls, customers call report, response time by weekday and average answer time. Are you in need of a template that can accommodate all of your creative concepts This one is crafted professionally and can be altered to fit any style. Use it with Google Slides or PowerPoint. Include striking photographs, symbols, depictions, and other visuals. Fill, move around, or remove text boxes as desired. Test out color palettes and font mixtures. Edit and save your work, or work with colleagues. Download Comprehensive Guide For Enhancing Performance Of Customer Service Center Call Center Action Plan Dashboard Infographics PDF and observe how to make your presentation outstanding. Give an impeccable presentation to your group and make your presentation unforgettable.
Student Data Tracking Application Dashboard Impact Of IoT Technology On Education IoT SS V
Following slide represents dashboard that provides accurate student data to analyze performance using educational apps. It includes metrics such as grades, attendance, average grades, progress rate, etc. From laying roadmaps to briefing everything in detail, our templates are perfect for you. You can set the stage with your presentation slides. All you have to do is download these easy-to-edit and customizable templates. Student Data Tracking Application Dashboard Impact Of IoT Technology On Education IoT SS V will help you deliver an outstanding performance that everyone would remember and praise you for. Do download this presentation today. Following slide represents dashboard that provides accurate student data to analyze performance using educational apps. It includes metrics such as grades, attendance, average grades, progress rate, etc.

Marketing Growth Strategy KPI Dashboard To Evaluate Sales Performance Strategy SS V
The following slide outlines key performance indicator KPI dashboard to monitor sales performance of company. The key metrics covered in slide are total sales by location, monthly sales trend, average revenue AR by clients, etc. This Marketing Growth Strategy KPI Dashboard To Evaluate Sales Performance Strategy SS V is perfect for any presentation, be it in front of clients or colleagues. It is a versatile and stylish solution for organizing your meetings. The Marketing Growth Strategy KPI Dashboard To Evaluate Sales Performance Strategy SS V features a modern design for your presentation meetings. The adjustable and customizable slides provide unlimited possibilities for acing up your presentation. Slidegeeks has done all the homework before launching the product for you. So, do not wait, grab the presentation templates today The following slide outlines key performance indicator KPI dashboard to monitor sales performance of company. The key metrics covered in slide are total sales by location, monthly sales trend, average revenue AR by clients, etc.
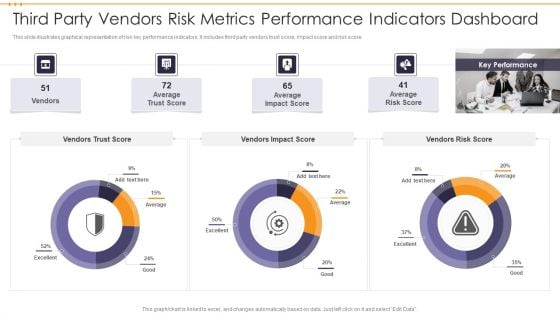
Third Party Vendors Risk Metrics Performance Indicators Dashboard Topics PDF
This slide illustrates graphical representation of risk key performance indicators. It includes third party vendors trust score, impact score and risk score. Pitch your topic with ease and precision using this Third Party Vendors Risk Metrics Performance Indicators Dashboard Topics PDF. This layout presents information on Third Party Vendors Risk Metrics Performance Indicators Dashboard. It is also available for immediate download and adjustment. So, changes can be made in the color, design, graphics or any other component to create a unique layout.
Sustainability Calculation With KPI Effective Rate Metrics By Customer And Offering Ppt PowerPoint Presentation Icon Files PDF
This slide covers effective rate metrics. It shows over year over comparison of effective rate per customer as well as effective rate per offering. Deliver an awe inspiring pitch with this creative sustainability calculation with kpi effective rate metrics by customer and offering ppt powerpoint presentation icon files pdf bundle. Topics like effective rate metrics by customer and offering can be discussed with this completely editable template. It is available for immediate download depending on the needs and requirements of the user.
Supplier Action Plan Tracking And Reporting Dashboard Graphics PDF
This slide covers procurement reporting and analytics dashboard for tracking the effectiveness of new supplier strategy. It include metrics such as spend, transactions, PO, PR and invoice count, invoices information, due dates, spend by payment terms, supplier payment terms, etc. Showcasing this set of slides titled supplier action plan tracking and reporting dashboard graphics pdf. The topics addressed in these templates are supplier action plan tracking and reporting dashboard. All the content presented in this PPT design is completely editable. Download it and make adjustments in color, background, font etc. as per your unique business setting.
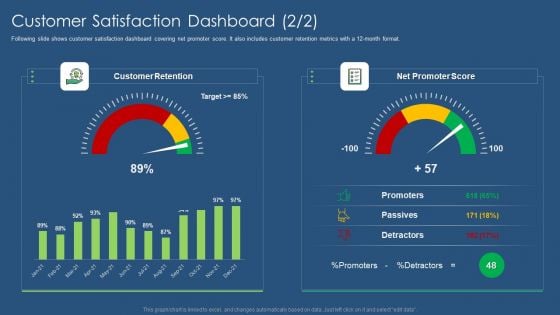
Sustainability Calculation With KPI Customer Satisfaction Dashboard Customer Ppt PowerPoint Presentation Gallery Smartart PDF
Following slide shows customer satisfaction dashboard covering net promoter score. It also includes customer retention metrics with a 12 month format. Deliver and pitch your topic in the best possible manner with this sustainability calculation with kpi customer satisfaction dashboard customer ppt powerpoint presentation gallery smartart pdf. Use them to share invaluable insights on customer satisfaction dashboard and impress your audience. This template can be altered and modified as per your expectations. So, grab it now.
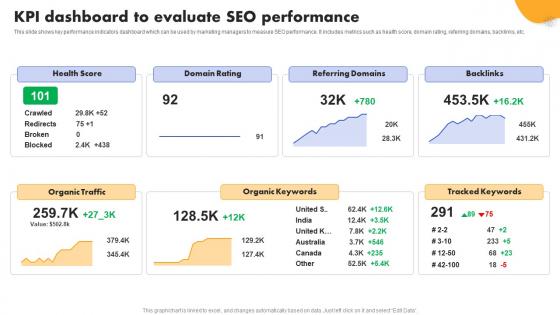
SEO Strategy To Improve KPI Dashboard To Evaluate SEO Performance Strategy SS V
This slide shows key performance indicators dashboard which can be used by marketing managers to measure SEO performance. It includes metrics such as health score, domain rating, referring domains, backlinks, etc. Want to ace your presentation in front of a live audience Our SEO Strategy To Improve KPI Dashboard To Evaluate SEO Performance Strategy SS V can help you do that by engaging all the users towards you. Slidegeeks experts have put their efforts and expertise into creating these impeccable powerpoint presentations so that you can communicate your ideas clearly. Moreover, all the templates are customizable, and easy-to-edit and downloadable. Use these for both personal and commercial use. This slide shows key performance indicators dashboard which can be used by marketing managers to measure SEO performance. It includes metrics such as health score, domain rating, referring domains, backlinks, etc.
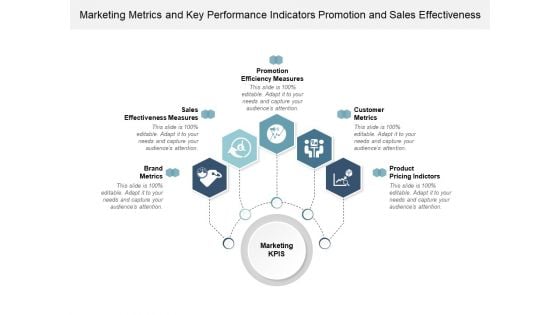
Marketing Metrics And Key Performance Indicators Promotion And Sales Effectiveness Ppt Powerpoint Presentation Infographics Graphics Example
This is a marketing metrics and key performance indicators promotion and sales effectiveness ppt powerpoint presentation infographics graphics example. This is a five stage process. The stages in this process are dashboard, kpi, metrics.
Firewall As A Service Performance Tracking Dashboard Network Security Guidelines Pdf
This slide represents the dashboard to track the performance of Firewall-as-a-Service deployed by different organizations. The purpose of this slide is to showcase the overall performance of FWaaS by demonstrating statistics of monthly threat status, etc. Crafting an eye-catching presentation has never been more straightforward. Let your presentation shine with this tasteful yet straightforward Firewall As A Service Performance Tracking Dashboard Network Security Guidelines Pdf template. It offers a minimalistic and classy look that is great for making a statement. The colors have been employed intelligently to add a bit of playfulness while still remaining professional. Construct the ideal Firewall As A Service Performance Tracking Dashboard Network Security Guidelines Pdf that effortlessly grabs the attention of your audience Begin now and be certain to wow your customers This slide represents the dashboard to track the performance of Firewall-as-a-Service deployed by different organizations. The purpose of this slide is to showcase the overall performance of FWaaS by demonstrating statistics of monthly threat status, etc.
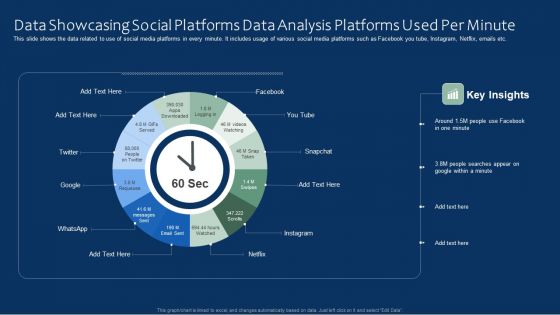
Data Showcasing Social Platforms Data Analysis Platforms Used Per Minute Microsoft PDF
This slide shows the data related to use of social media platforms in every minute. It includes usage of various social media platforms such as Facebook you tube, Instagram, Netflix, emails etc. Persuade your audience using this Data Showcasing Social Platforms Data Analysis Platforms Used Per Minute Microsoft PDF. This PPT design covers one stages, thus making it a great tool to use. It also caters to a variety of topics including Data Showcasing Social Platforms, Data Analysis Platforms. Download this PPT design now to present a convincing pitch that not only emphasizes the topic but also showcases your presentation skills.
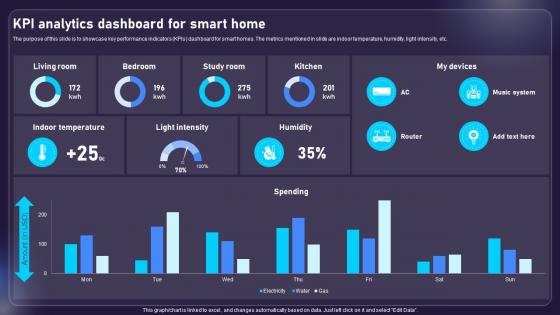
Kpi Analytics Dashboard For Smart Home AIOT Applications For Various Industries IoT SS V
The purpose of this slide is to showcase key performance indicators KPIs dashboard for smart homes. The metrics mentioned in slide are indoor temperature, humidity, light intensity, etc. Slidegeeks has constructed Kpi Analytics Dashboard For Smart Home AIOT Applications For Various Industries IoT SS V after conducting extensive research and examination. These presentation templates are constantly being generated and modified based on user preferences and critiques from editors. Here, you will find the most attractive templates for a range of purposes while taking into account ratings and remarks from users regarding the content. This is an excellent jumping-off point to explore our content and will give new users an insight into our top-notch PowerPoint Templates. The purpose of this slide is to showcase key performance indicators KPIs dashboard for smart homes. The metrics mentioned in slide are indoor temperature, humidity, light intensity, etc.
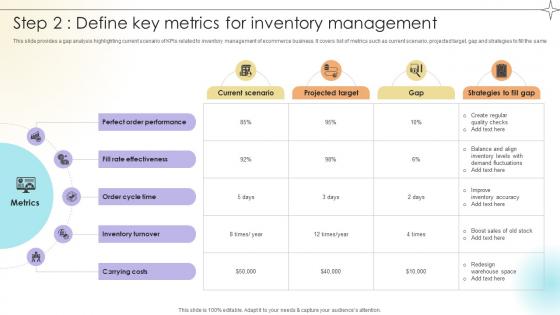
Step 2 Define Key Metrics For Inventory Management Data Analytics SS V
This slide provides a gap analysis highlighting current scenario of KPIs related to inventory management of ecommerce business. It covers list of metrics such as current scenario, projected target, gap and strategies to fill the same.Make sure to capture your audiences attention in your business displays with our gratis customizable Step 2 Define Key Metrics For Inventory Management Data Analytics SS V. These are great for business strategies, office conferences, capital raising or task suggestions. If you desire to acquire more customers for your tech business and ensure they stay satisfied, create your own sales presentation with these plain slides. This slide provides a gap analysis highlighting current scenario of KPIs related to inventory management of ecommerce business. It covers list of metrics such as current scenario, projected target, gap and strategies to fill the same.
Kpi Dashboard For Tracking Enhance Client Engagement With Interactive Advertising Background Pdf
This slide shows KPI dashboard for assessing performance of social media platforms. It provides information about followers, likes, clicks, shares, impressions, engaged users, new followers, etc. The Kpi Dashboard For Tracking Enhance Client Engagement With Interactive Advertising Background Pdf is a compilation of the most recent design trends as a series of slides. It is suitable for any subject or industry presentation, containing attractive visuals and photo spots for businesses to clearly express their messages. This template contains a variety of slides for the user to input data, such as structures to contrast two elements, bullet points, and slides for written information. Slidegeeks is prepared to create an impression. This slide shows KPI dashboard for assessing performance of social media platforms. It provides information about followers, likes, clicks, shares, impressions, engaged users, new followers, etc.
Security Breach Events Tracking Dashboard Data Fortification Strengthening Defenses
This slide represents the dashboard to track data breach attacks. The purpose of this slide is to provide a graphical representation of cyber attacks that occurred in a specific period. It also depicts the overview of different types of attacks.Create an editable Security Breach Events Tracking Dashboard Data Fortification Strengthening Defenses that communicates your idea and engages your audience. Whether you are presenting a business or an educational presentation, pre-designed presentation templates help save time. Security Breach Events Tracking Dashboard Data Fortification Strengthening Defenses is highly customizable and very easy to edit, covering many different styles from creative to business presentations. Slidegeeks has creative team members who have crafted amazing templates. So, go and get them without any delay. This slide represents the dashboard to track data breach attacks. The purpose of this slide is to provide a graphical representation of cyber attacks that occurred in a specific period. It also depicts the overview of different types of attacks.
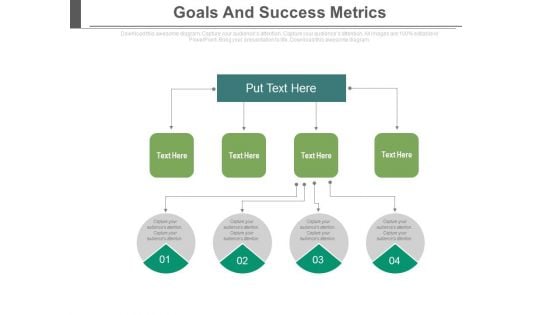
Goals And Success Metrics Ppt Slides
This is a goals and success metrics ppt slides. This is a four stage process. The stages in this process are process and flows, success, business.

Customer Service Percentage Report Powerpoint Slide Deck Template
This is a customer service percentage report powerpoint slide deck template. This is a three stage process. The stages in this process are detractors, passives, promoters.
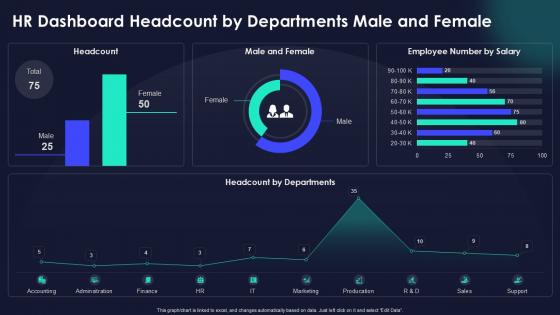
HR Dashboard Headcount By Departments Male And Female
There are so many reasons you need a HR Dashboard Headcount By Departments Male And Female. The first reason is you can not spend time making everything from scratch, Thus, Slidegeeks has made presentation templates for you too. You can easily download these templates from our website easily. Our HR Dashboard, which breaks down headcount by department and gender, helps businesses manage and optimize their workforce more effectively. By offering clear insights into male and female distribution across different departments, it enables organizations to identify potential gaps and make data-driven decisions that can reduce unnecessary expenditure.
New Hires Data Tracker Dashboard Workforce Procurement And Aptitude Evaluation Ppt Presentation
This slide shows dashboard including date related to new hires for recruitment. It include data related to new hires per month, new hires for various departments and by sources, etc. Are you searching for a New Hires Data Tracker Dashboard Workforce Procurement And Aptitude Evaluation Ppt Presentation that is uncluttered, straightforward, and original Its easy to edit, and you can change the colors to suit your personal or business branding. For a presentation that expresses how much effort you have put in, this template is ideal With all of its features, including tables, diagrams, statistics, and lists, its perfect for a business plan presentation. Make your ideas more appealing with these professional slides. Download New Hires Data Tracker Dashboard Workforce Procurement And Aptitude Evaluation Ppt Presentation from Slidegeeks today. This slide shows dashboard including date related to new hires for recruitment. It include data related to new hires per month, new hires for various departments and by sources, etc.

KPI Dashboard For Monitoring Warehouse Operations Strategic Plan For Enhancing Inspiration Pdf
Mentioned slide illustrates warehouse operations dashboard with key performance indicators KPIs. KPIs included are operating cost, order rate, total shipment by country and on-time shipment. Retrieve professionally designed KPI Dashboard For Monitoring Warehouse Operations Strategic Plan For Enhancing Inspiration Pdf to effectively convey your message and captivate your listeners. Save time by selecting pre-made slideshows that are appropriate for various topics, from business to educational purposes. These themes come in many different styles, from creative to corporate, and all of them are easily adjustable and can be edited quickly. Access them as PowerPoint templates or as Google Slides themes. You do not have to go on a hunt for the perfect presentation because Slidegeeks got you covered from everywhere. Mentioned slide illustrates warehouse operations dashboard with key performance indicators KPIs. KPIs included are operating cost, order rate, total shipment by country and on-time shipment.
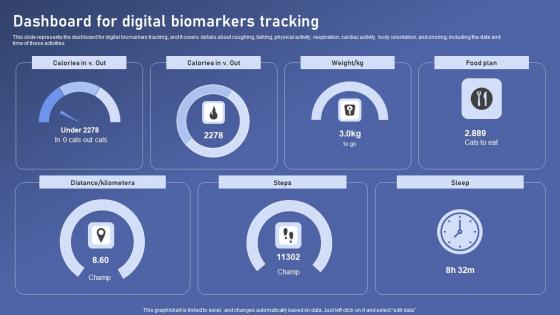
Dashboard For Digital Biomarkers Biomedical Data Science And Health Informatics Slides Pdf
This slide represents the dashboard for digital biomarkers tracking, and it covers details about coughing, talking, physical activity, respiration, cardiac activity, body orientation, and snoring, including the date and time of these activities Make sure to capture your audiences attention in your business displays with our gratis customizable Dashboard For Digital Biomarkers Biomedical Data Science And Health Informatics Slides Pdf. These are great for business strategies, office conferences, capital raising or task suggestions. If you desire to acquire more customers for your tech business and ensure they stay satisfied, create your own sales presentation with these plain slides. This slide represents the dashboard for digital biomarkers tracking, and it covers details about coughing, talking, physical activity, respiration, cardiac activity, body orientation, and snoring, including the date and time of these activities
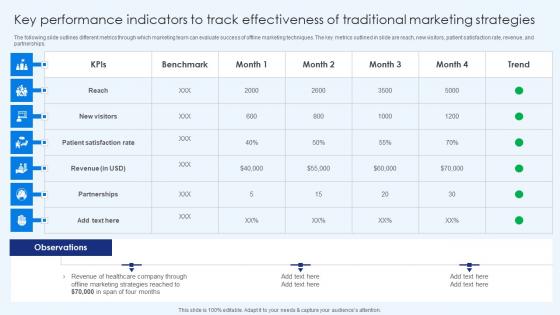
Key Performance Indicators To Track Effectivenes Healthcare Promotion Infographics Pdf
The following slide outlines different metrics through which marketing team can evaluate success of offline marketing techniques. The key metrics outlined in slide are reach, new visitors, patient satisfaction rate, revenue, and partnerships. The Key Performance Indicators To Track Effectivenes Healthcare Promotion Infographics Pdf is a compilation of the most recent design trends as a series of slides. It is suitable for any subject or industry presentation, containing attractive visuals and photo spots for businesses to clearly express their messages. This template contains a variety of slides for the user to input data, such as structures to contrast two elements, bullet points, and slides for written information. Slidegeeks is prepared to create an impression. The following slide outlines different metrics through which marketing team can evaluate success of offline marketing techniques. The key metrics outlined in slide are reach, new visitors, patient satisfaction rate, revenue, and partnerships.


 Continue with Email

 Home
Home


