Solution Architect
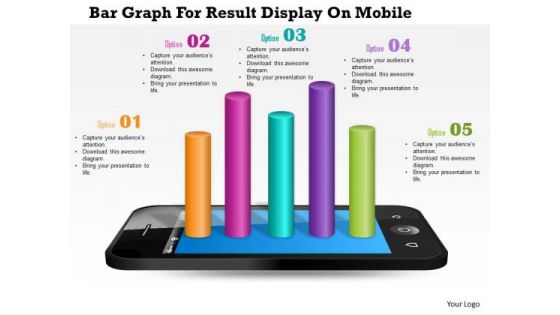
Business Diagram Bar Graph For Result Display On Mobile Presentation Template
This Power Point template has been designed with graphic of bar graph on mobile phone. This business diagram can be used to make business reports. Download this Power Point slide to build quality presentation for your viewers.
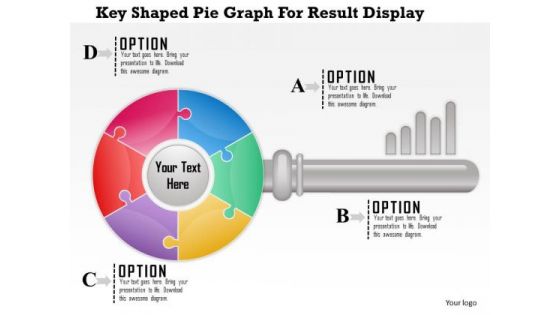
Business Diagram Key Shaped Pie Graph For Result Display Presentation Template
Key shaped pie graph has been used to design this business diagram. This slide has key graphic with abcd options. Use this amazing slide to present a business plan. Download this slide to impress your viewers.
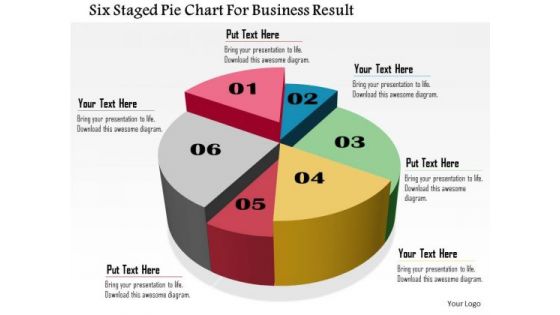
Business Daigram Six Staged Pie Chart For Business Result Presentation Templets
Six staged pie chart is used to design this business slide. Download this diagram to make business and financial reports. Use our above diagram to express information in a visual way.
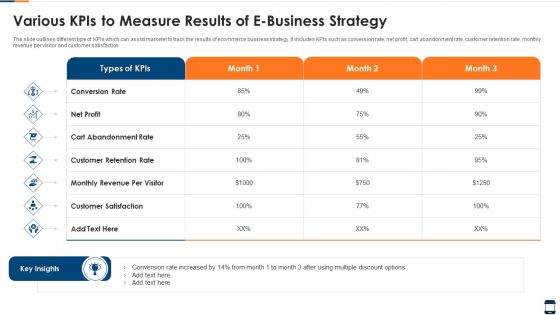
Various Kpis To Measure Results Of E Business Strategy Elements PDF
The slide outlines different type of KPIs which can assist marketer to track the results of ecommerce business strategy. It includes KPIs such as conversion rate, net profit, cart abandonment rate, customer retention rate, monthly revenue per visitor and customer satisfaction. Pitch your topic with ease and precision using this various kpis to measure results of e business strategy elements pdf. This layout presents information on various kpis to measure results of e business strategy. It is also available for immediate download and adjustment. So, changes can be made in the color, design, graphics or any other component to create a unique layout.
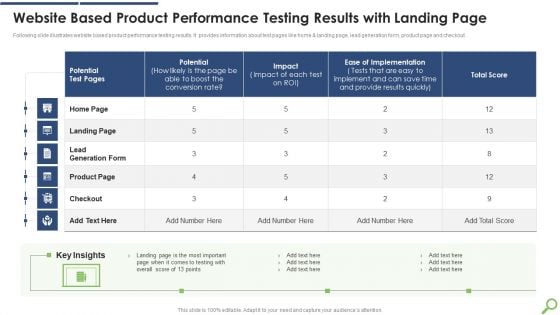
Website Based Product Performance Testing Results With Landing Page Mockup PDF
Following slide illustrates website based product performance testing results. It provides information about test pages like home and landing page, lead generation form, product page and checkout. Pitch your topic with ease and precision using this Website Based Product Performance Testing Results With Landing Page Mockup PDF This layout presents information on Provide Results, Potential Test, Ease Of Implementation It is also available for immediate download and adjustment. So, changes can be made in the color, design, graphics or any other component to create a unique layout.
Business Performance Review Report Highlighting Results Of Marketing Campaign Icons PDF
The following slide highlights a quarterly business review QBR report which can be used by the manager to review marketing campaign results. The QBR report covers information about strategic objectives, KPIs, target and result in various quarters. Pitch your topic with ease and precision using this Business Performance Review Report Highlighting Results Of Marketing Campaign Icons PDF. This layout presents information on Strategic Objectives, Engage Community, Increase Revenue. It is also available for immediate download and adjustment. So, changes can be made in the color, design, graphics or any other component to create a unique layout.
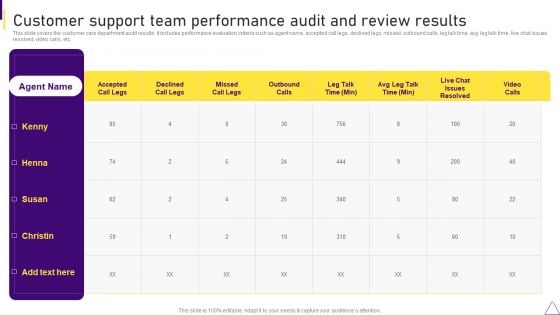
Consumer Journey Mapping Techniques Customer Support Team Performance Audit And Review Results Professional PDF
This slide covers the customer care department audit results. It includes performance evaluation criteria such as agent name, accepted call legs, declined legs, missed, outbound calls, leg talk time, avg leg talk time, live chat issues resolved, video calls, etc. Showcasing this set of slides titled Consumer Journey Mapping Techniques Customer Support Team Performance Audit And Review Results Professional PDF. The topics addressed in these templates are Audit And Review Results, Team Performance, Customer Support. All the content presented in this PPT design is completely editable. Download it and make adjustments in color, background, font etc. as per your unique business setting.

Consumer Journey Mapping Techniques Referral Program Audit And Review Results Sample PDF
This slide covers the referral campaign results tracking sheet. It includes various details such as referral code, name, email, phone, referrals owed, count, rewards earned, promoter rewards redemption, rewards redeemed, etc. Pitch your topic with ease and precision using this Consumer Journey Mapping Techniques Referral Program Audit And Review Results Sample PDF. This layout presents information on Referral Program, Audit And Review Results. It is also available for immediate download and adjustment. So, changes can be made in the color, design, graphics or any other component to create a unique layout.

Email Marketing Campaign Outcomes And Social Media Marketing Result Analysis Dashboard Mockup PDF
This slide depicts the dashboard for analyzing the results of email campaign and social media marketing. It includes information related to the comparison, statistics, usage, etc. Pitch your topic with ease and precision using this Email Marketing Campaign Outcomes And Social Media Marketing Result Analysis Dashboard Mockup PDF. This layout presents information on Email Marketing Campaign, Outcomes And Social Media, Marketing Result, Analysis Dashboard. It is also available for immediate download and adjustment. So, changes can be made in the color, design, graphics or any other component to create a unique layout.

Highlighting The Employee Satisfaction Survey Results Developing Employee Retention Techniques Background PDF
The purpose of this slide is to exhibit the staff satisfaction survey results. Organizations can evaluate the employee satisfaction level based on the survey results and can further implement employee retention tactics if required. Find a pre-designed and impeccable Highlighting The Employee Satisfaction Survey Results Developing Employee Retention Techniques Background PDF. The templates can ace your presentation without additional effort. You can download these easy-to-edit presentation templates to make your presentation stand out from others. So, what are you waiting for Download the template from Slidegeeks today and give a unique touch to your presentation.
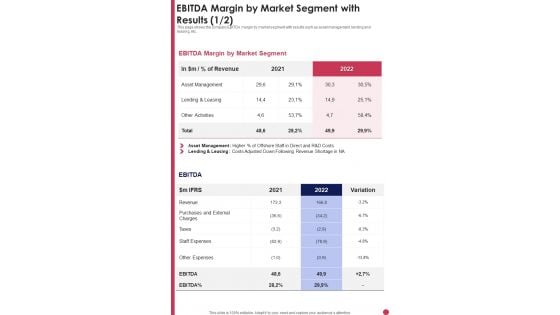
EBITDA Margin By Market Segment With Results Template 282 One Pager Documents
This page shows the company EBITDA margin by market segment with results such as asset management, lending and leasing, etc.Presenting you an exemplary EBITDA Margin By Market Segment With Results Template 282 One Pager Documents. Our one-pager comprises all the must-have essentials of an inclusive document. You can edit it with ease, as its layout is completely editable. With such freedom, you can tweak its design and other elements to your requirements. Download this EBITDA Margin By Market Segment With Results Template 282 One Pager Documents brilliant piece now.
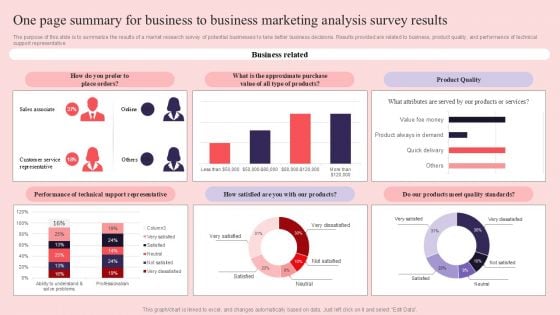
One Page Summary For Business To Business Marketing Analysis Survey Results Survey SS
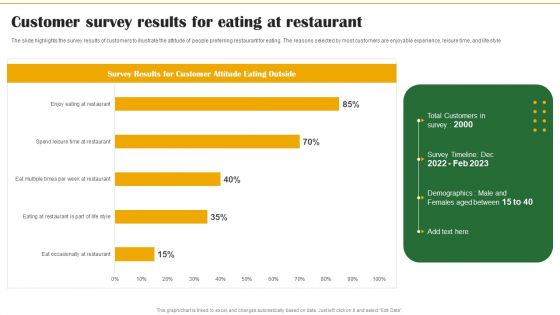
Food Organization Financial Trends Customer Survey Results For Eating At Restaurant Formats PDF
The slide highlights the survey results of customers to illustrate the attitude of people preferring restaurant for eating. The reasons selected by most customers are enjoyable experience, leisure time, and life style. Coming up with a presentation necessitates that the majority of the effort goes into the content and the message you intend to convey. The visuals of a PowerPoint presentation can only be effective if it supplements and supports the story that is being told. Keeping this in mind our experts created Food Organization Financial Trends Customer Survey Results For Eating At Restaurant Formats PDF to reduce the time that goes into designing the presentation. This way, you can concentrate on the message while our designers take care of providing you with the right template for the situation.
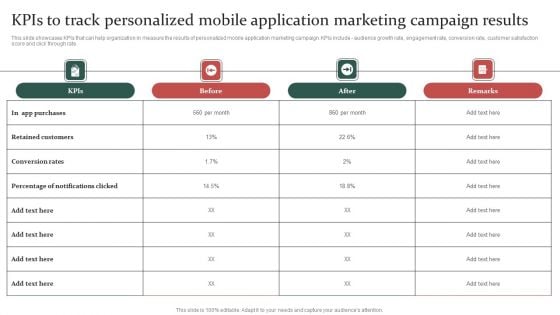
Gathering Customer Kpis To Track Personalized Mobile Application Marketing Campaign Results Information PDF
This slide showcases KPIs that can help organization in measure the results of personalized mobile application marketing campaign. KPIs include - audience growth rate, engagement rate, conversion rate, customer satisfaction score and click through rate. Do you know about Slidesgeeks Gathering Customer Kpis To Track Personalized Mobile Application Marketing Campaign Results Information PDF These are perfect for delivering any kind od presentation. Using it, create PowerPoint presentations that communicate your ideas and engage audiences. Save time and effort by using our pre-designed presentation templates that are perfect for a wide range of topic. Our vast selection of designs covers a range of styles, from creative to business, and are all highly customizable and easy to edit. Download as a PowerPoint template or use them as Google Slides themes.
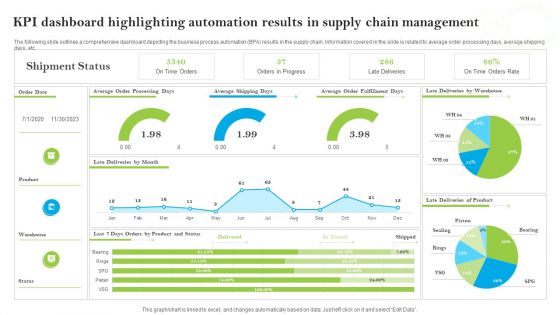
Introducing AI Tools KPI Dashboard Highlighting Automation Results In Supply Chain Portrait PDF
The following slide outlines a comprehensive dashboard depicting the business process automation BPA results in the supply chain. Information covered in the slide is related to average order processing days, average shipping days, etc. Coming up with a presentation necessitates that the majority of the effort goes into the content and the message you intend to convey. The visuals of a PowerPoint presentation can only be effective if it supplements and supports the story that is being told. Keeping this in mind our experts created Introducing AI Tools KPI Dashboard Highlighting Automation Results In Supply Chain Portrait PDF to reduce the time that goes into designing the presentation. This way, you can concentrate on the message while our designers take care of providing you with the right template for the situation.
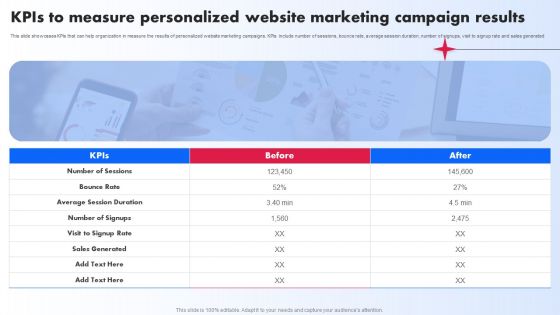
Kpis To Measure Personalized Website Marketing Campaign Results Ppt PowerPoint Presentation File Show PDF
This slide showcases KPIs that can help organization in measure the results of personalized website marketing campaigns. KPIs include number of sessions, bounce rate, average session duration, number of signups, visit to signup rate and sales generated. Welcome to our selection of the Kpis To Measure Personalized Website Marketing Campaign Results Ppt PowerPoint Presentation File Show PDF. These are designed to help you showcase your creativity and bring your sphere to life. Planning and Innovation are essential for any business that is just starting out. This collection contains the designs that you need for your everyday presentations. All of our PowerPoints are 100 percent editable, so you can customize them to suit your needs. This multi purpose template can be used in various situations. Grab these presentation templates today.
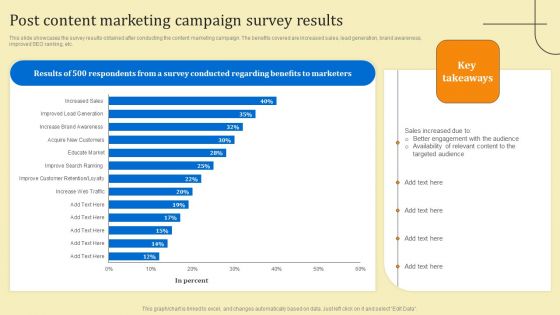
Business Sales Optimization Advertisement Campaign Post Content Marketing Campaign Survey Results Structure PDF
This slide showcases the survey results obtained after conducting the content marketing campaign. The benefits covered are increased sales, lead generation, brand awareness, improved SEO ranking, etc. Coming up with a presentation necessitates that the majority of the effort goes into the content and the message you intend to convey. The visuals of a PowerPoint presentation can only be effective if it supplements and supports the story that is being told. Keeping this in mind our experts created Business Sales Optimization Advertisement Campaign Post Content Marketing Campaign Survey Results Structure PDF to reduce the time that goes into designing the presentation. This way, you can concentrate on the message while our designers take care of providing you with the right template for the situation.
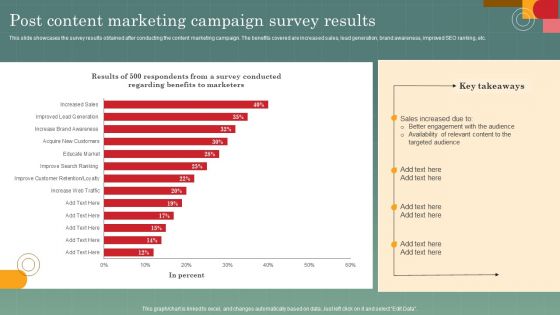
Advertising Programs Management Techniques Post Content Marketing Campaign Survey Results Information PDF
This slide showcases the survey results obtained after conducting the content marketing campaign. The benefits covered are increased sales, lead generation, brand awareness, improved SEO ranking, etc. Coming up with a presentation necessitates that the majority of the effort goes into the content and the message you intend to convey. The visuals of a PowerPoint presentation can only be effective if it supplements and supports the story that is being told. Keeping this in mind our experts created Advertising Programs Management Techniques Post Content Marketing Campaign Survey Results Information PDF to reduce the time that goes into designing the presentation. This way, you can concentrate on the message while our designers take care of providing you with the right template for the situation.
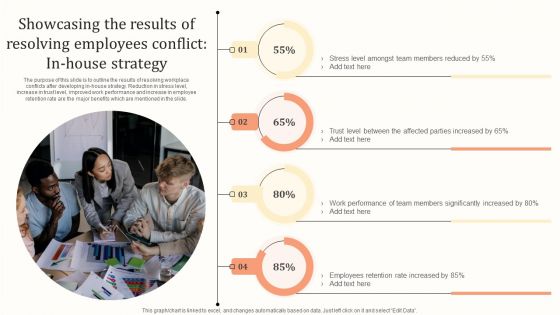
Showcasing The Results Of Resolving Employees Conflict In House Strategy Diagrams PDF
The purpose of this slide is to outline the results of resolving workplace conflicts after developing in-house strategy. Reduction in stress level, increase in trust level, improved work performance and increase in employee retention rate are the major benefits which are mentioned in the slide. Take your projects to the next level with our ultimate collection of Showcasing The Results Of Resolving Employees Conflict In House Strategy Diagrams PDF. Slidegeeks has designed a range of layouts that are perfect for representing task or activity duration, keeping track of all your deadlines at a glance. Tailor these designs to your exact needs and give them a truly corporate look with your own brand colors they will make your projects stand out from the rest.
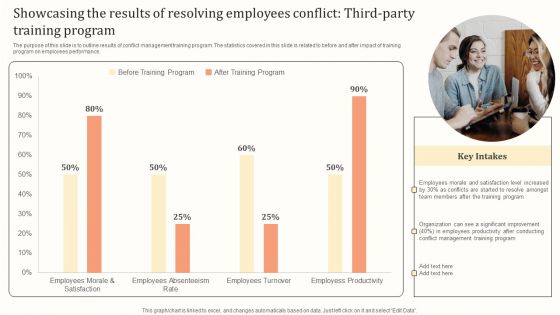
Showcasing The Results Of Resolving Employees Conflict Third Party Training Program Structure PDF
The purpose of this slide is to outline results of conflict management training program. The statistics covered in this slide is related to before and after impact of training program on employees performance. Do you know about Slidesgeeks Showcasing The Results Of Resolving Employees Conflict Third Party Training Program Structure PDF These are perfect for delivering any kind od presentation. Using it, create PowerPoint presentations that communicate your ideas and engage audiences. Save time and effort by using our pre designed presentation templates that are perfect for a wide range of topic. Our vast selection of designs covers a range of styles, from creative to business, and are all highly customizable and easy to edit. Download as a PowerPoint template or use them as Google Slides themes.
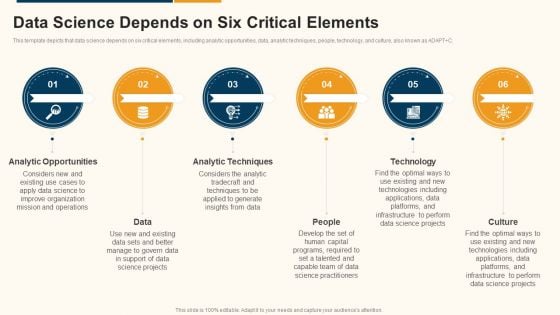
Data Interpretation And Analysis Playbook Data Science Depends On Six Critical Elements Diagrams PDF
This template depicts that data science depends on six critical elements, including analytic opportunities, data, analytic techniques, people, technology, and culture, also known as ADAPT pluse C. Presenting data interpretation and analysis playbook data science depends on six critical elements diagrams pdf to provide visual cues and insights. Share and navigate important information on six stages that need your due attention. This template can be used to pitch topics like analytic opportunities, data, analytic techniques, people, technology, culture. In addtion, this PPT design contains high resolution images, graphics, etc, that are easily editable and available for immediate download.
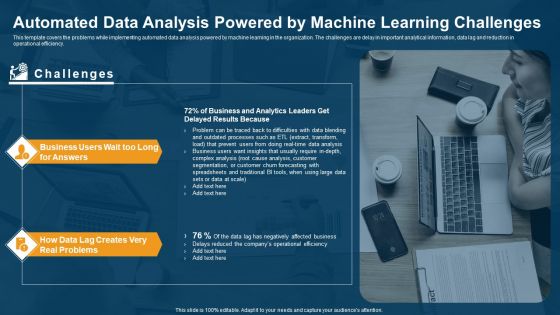
Data Interpretation And Analysis Playbook Automated Data Analysis Powered By Machine Learning Challenges Summary PDF
This template covers the problems while implementing automated data analysis powered by machine learning in the organization. The challenges are delay in important analytical information, data lag and reduction in operational efficiency. Presenting data interpretation and analysis playbook automated data analysis powered by machine learning challenges summary pdf to provide visual cues and insights. Share and navigate important information on two stages that need your due attention. This template can be used to pitch topics like operational, efficiency, business, analysis. In addtion, this PPT design contains high resolution images, graphics, etc, that are easily editable and available for immediate download.

Data Interpretation And Analysis Playbook Business Intelligence And Predictive Analytics Challenges Template PDF
This template covers the problems while implementing BI and predictive analytics in the organization. The challenges are undefined KPIs and metrics, and unable to hire right data science talent. Presenting data interpretation and analysis playbook business intelligence and predictive analytics challenges template pdf to provide visual cues and insights. Share and navigate important information on two stages that need your due attention. This template can be used to pitch topics like security vulnerabilities, operationalizing, perform analysis, deployed. In addtion, this PPT design contains high resolution images, graphics, etc, that are easily editable and available for immediate download.
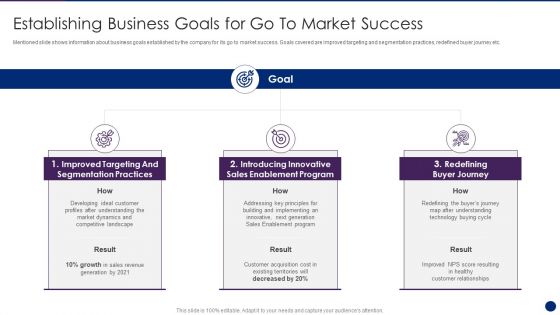
Interpreting Market Kinetics Influence Customer Purchasing Establishing Business Goals Guidelines PDF
Mentioned slide shows information about business goals established by the company for its go to market success. Goals covered are improved targeting and segmentation practices, redefined buyer journey etc. Presenting interpreting market kinetics influence customer purchasing establishing business goals guidelines pdf to provide visual cues and insights. Share and navigate important information on three stages that need your due attention. This template can be used to pitch topics like developing sales growth strategy . In addtion, this PPT design contains high resolution images, graphics, etc, that are easily editable and available for immediate download.

Interpreting Market Kinetics Influence Customer Purchasing Market Restraints To Technology Portrait PDF
This slide explains the existing market barriers to technology adoption. Barriers covered are data privacy concerns, network connectivity and high cost of implementation. Presenting interpreting market kinetics influence customer purchasing market restraints to technology portrait pdf to provide visual cues and insights. Share and navigate important information on three stages that need your due attention. This template can be used to pitch topics like data privacy concerns, network connectivity, data quality. In addtion, this PPT design contains high resolution images, graphics, etc, that are easily editable and available for immediate download.
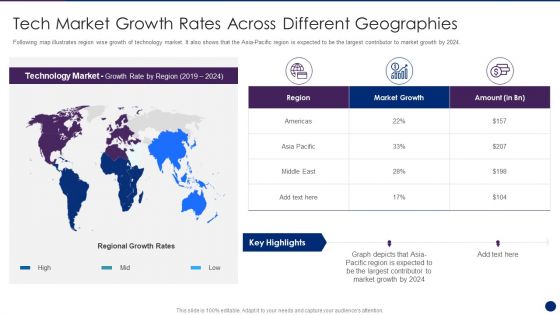
Interpreting Market Kinetics Influence Customer Purchasing Tech Market Growth Rates Microsoft PDF
Following map illustrates region wise growth of technology market. It also shows that the Asia-Pacific region is expected to be the largest contributor to market growth by 2024. Presenting interpreting market kinetics influence customer purchasing tech market growth rates microsoft pdf to provide visual cues and insights. Share and navigate important information on one stages that need your due attention. This template can be used to pitch topics like tech market growth rates across different geographies. In addtion, this PPT design contains high resolution images, graphics, etc, that are easily editable and available for immediate download.
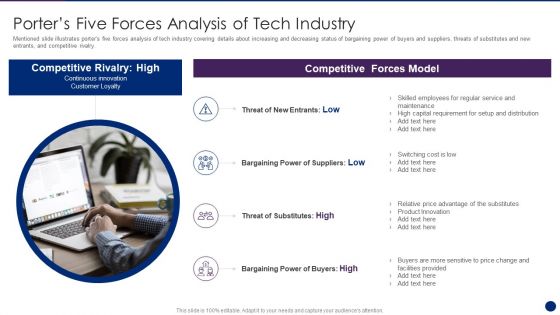
Interpreting Market Kinetics Influence Customer Purchasing Porters Five Forces Analysis Slides PDF
Mentioned slide illustrates porters five forces analysis of tech industry covering details about increasing and decreasing status of bargaining power of buyers and suppliers, threats of substitutes and new entrants, and competitive rivalry. Presenting interpreting market kinetics influence customer purchasing porters five forces analysis slides pdf to provide visual cues and insights. Share and navigate important information on one stages that need your due attention. This template can be used to pitch topics like porters five forces analysis of tech industry . In addtion, this PPT design contains high resolution images, graphics, etc, that are easily editable and available for immediate download.
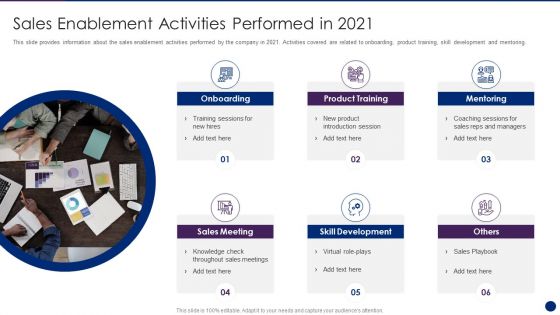
Interpreting Market Kinetics Influence Customer Purchasing Sales Enablement Activities Introduction PDF
This slide provides information about the sales enablement activities performed by the company in 2021. Activities covered are related to onboarding, product training, skill development and mentoring. Presenting interpreting market kinetics influence customer purchasing sales enablement activities introduction pdf to provide visual cues and insights. Share and navigate important information on six stages that need your due attention. This template can be used to pitch topics like onboarding, sales meeting, product training, skill development, mentoring . In addtion, this PPT design contains high resolution images, graphics, etc, that are easily editable and available for immediate download.
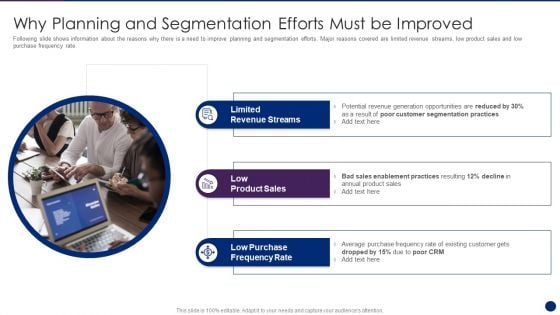
Interpreting Market Kinetics Influence Customer Purchasing Why Planning And Segmentation Ideas PDF
Following slide shows information about the reasons why there is a need to improve planning and segmentation efforts. Major reasons covered are limited revenue streams, low product sales and low purchase frequency rate. Presenting interpreting market kinetics influence customer purchasing why planning and segmentation ideas pdf to provide visual cues and insights. Share and navigate important information on three stages that need your due attention. This template can be used to pitch topics like revenue streams, low product sales , purchase frequency rate . In addtion, this PPT design contains high resolution images, graphics, etc, that are easily editable and available for immediate download.
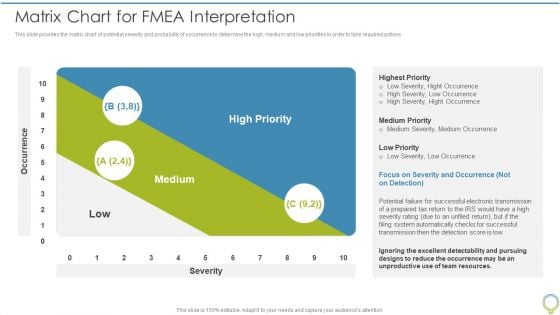
FMEA To Determine Potential Matrix Chart For Fmea Interpretation Summary PDF
This slide provides the matrix chart of potential severity and probability of occurrence to determine the high, medium and low priorities in order to take required actions. Presenting FMEA To Determine Potential Matrix Chart For Fmea Interpretation Summary PDF to provide visual cues and insights. Share and navigate important information on one stages that need your due attention. This template can be used to pitch topics like Highest Priority, Medium Priority, Low Priority. In addtion, this PPT design contains high resolution images, graphics, etc, that are easily editable and available for immediate download.

Operational Excellence Value Stream Design Diagram Ppt Summary
This is a operational excellence value stream design diagram ppt summary. This is a six stage process. The stages in this process are design future state, socialize and standardize, apply lean guidelines, prepare leadership, product family definition, future state map.
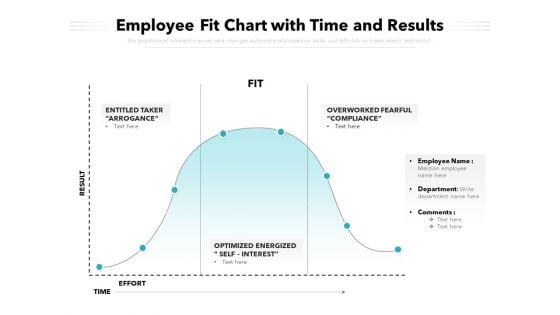
Employee Fit Chart With Time And Results Ppt PowerPoint Presentation Ideas Templates PDF
Showcasing this set of slides titled employee fit chart with time and results ppt powerpoint presentation ideas templates pdf. The topics addressed in these templates are entitled taker, arrogance optimized energized, self interest, overworked fearful compliance, effort, time. All the content presented in this PPT design is completely editable. Download it and make adjustments in color, background, font etc. as per your unique business setting.
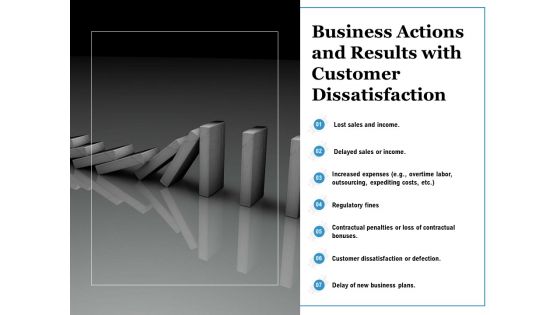
Business Actions And Results With Customer Dissatisfaction Ppt PowerPoint Presentation Gallery Professional PDF
Showcasing this set of slides titled business actions and results with customer dissatisfaction ppt powerpoint presentation gallery professional pdf. The topics addressed in these templates are lost sales and income, regulatory fines, customer dissatisfaction or defection, delay new business plans. All the content presented in this PPT design is completely editable. Download it and make adjustments in color, background, font etc. as per your unique business setting.
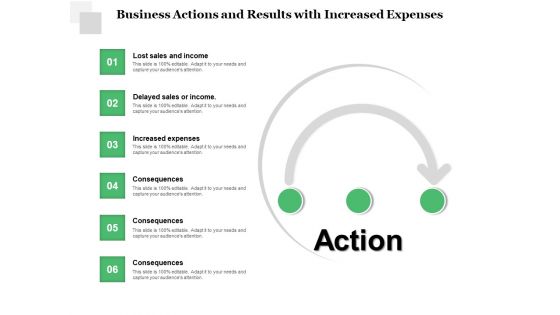
Business Actions And Results With Increased Expenses Ppt PowerPoint Presentation Slides Graphics Template PDF
Pitch your topic with ease and precision using this business actions and results with increased expenses ppt powerpoint presentation slides graphics template pdf. This layout presents information on lost sales and income, delayed sales income, increased expenses, consequences. It is also available for immediate download and adjustment. So, changes can be made in the color, design, graphics or any other component to create a unique layout.
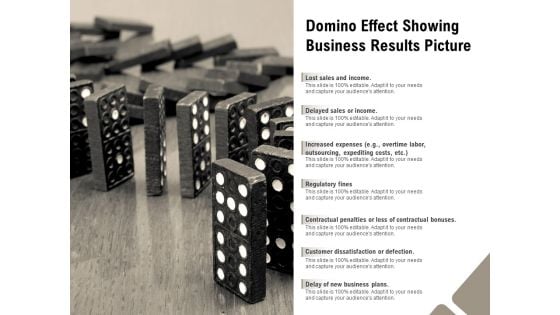
Domino Effect Showing Business Results Picture Ppt PowerPoint Presentation Infographic Template Influencers PDF
Pitch your topic with ease and precision using this domino effect showing business results picture ppt powerpoint presentation infographic template influencers pdf. This layout presents information on lost sales and income, delayed sales or income, regulatory fines. It is also available for immediate download and adjustment. So, changes can be made in the color, design, graphics or any other component to create a unique layout.
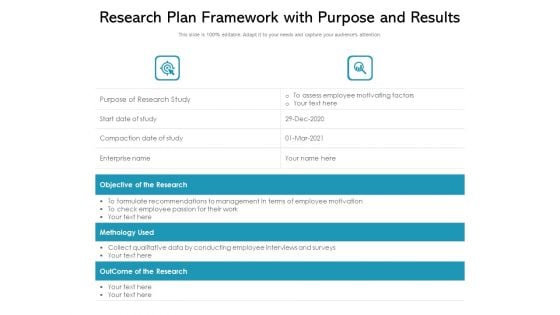
Research Plan Framework With Purpose And Results Ppt PowerPoint Presentation File Clipart Images PDF
Pitch your topic with ease and precision using this research plan framework with purpose and results ppt powerpoint presentation file clipart images pdf. This layout presents information on objective of the research, methology used, outcome of the research. It is also available for immediate download and adjustment. So, changes can be made in the color, design, graphics or any other component to create a unique layout.
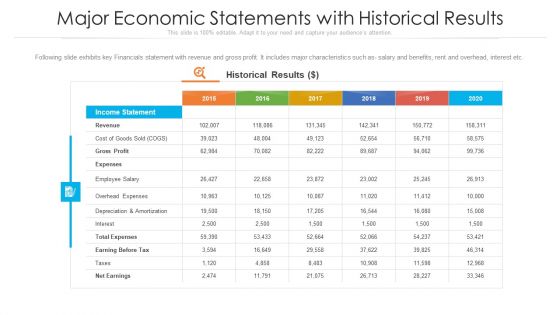
Major Economic Statements With Historical Results Ppt PowerPoint Presentation File Infographics PDF
Following slide exhibits key Financials statement with revenue and gross profit. It includes major characteristics such as- salary and benefits, rent and overhead, interest etc. Showcasing this set of slides titled major economic statements with historical results ppt powerpoint presentation file infographics pdf. The topics addressed in these templates are revenue, expenses, cost. All the content presented in this PPT design is completely editable. Download it and make adjustments in color, background, font etc. as per your unique business setting.
Five Different Types Of Calculate Facebook Key Performance Indicator Results Icons PDF
Pitch your topic with ease and precision using this five different types of calculate facebook key performance indicator results icons pdf. This layout presents information on reach kpis, traffic kpis, engagement kpis, conversions kpis, brand awareness kpis. It is also available for immediate download and adjustment. So, changes can be made in the color, design, graphics or any other component to create a unique layout.
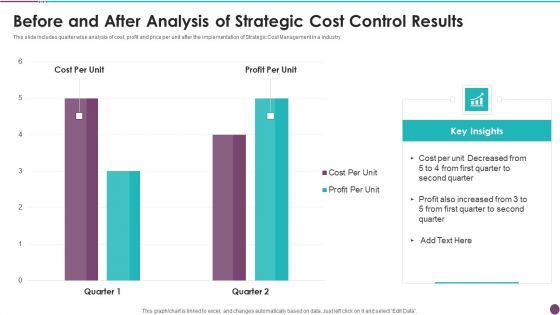
Before And After Analysis Of Strategic Cost Control Results Themes PDF
This slide includes quarter wise analysis of cost, profit and price per unit after the implementation of Strategic Cost Management in a industry. Showcasing this set of slides titled before and after analysis of strategic cost control results themes pdf. The topics addressed in these templates are cost per unit, profit per unit. All the content presented in this PPT design is completely editable. Download it and make adjustments in color, background, font etc. as per your unique business setting.
Social Media Marketing Performance Highlights With Key Campaign Results Ppt Icon PDF
This graph or chart is linked to excel, and changes automatically based on data. Just left click on it and select Edit Data. Showcasing this set of slides titled Social Media Marketing Performance Highlights With Key Campaign Results Ppt Icon PDF. The topics addressed in these templates are Profit Per, Overall Campaign, Total Budget. All the content presented in this PPT design is completely editable. Download it and make adjustments in color, background, font etc. as per your unique business setting.
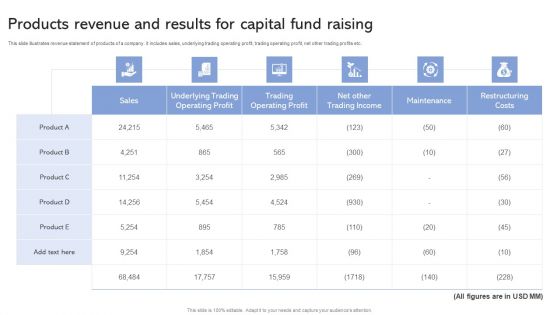
Products Revenue And Results For Capital Fund Raising Ppt Slides PDF
This slide illustrates revenue statement of products of a company. it includes sales, underlying trading operating profit, trading operating profit, net other trading profits etc. Showcasing this set of slides titled Products Revenue And Results For Capital Fund Raising Ppt Slides PDF. The topics addressed in these templates are Product, Sales, Maintenance. All the content presented in this PPT design is completely editable. Download it and make adjustments in color, background, font etc. as per your unique business setting.
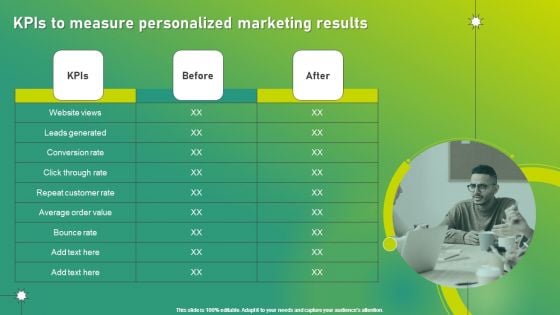
Targeted Marketing Strategic Plan For Audience Engagement Kpis To Measure Personalized Marketing Results Ideas PDF
If your project calls for a presentation, then Slidegeeks is your go to partner because we have professionally designed, easy-to-edit templates that are perfect for any presentation. After downloading, you can easily edit Targeted Marketing Strategic Plan For Audience Engagement Kpis To Measure Personalized Marketing Results Ideas PDF and make the changes accordingly. You can rearrange slides or fill them with different images. Check out all the handy templates.
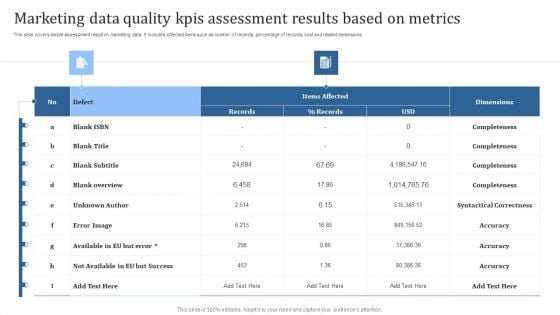
Marketing Data Quality Kpis Assessment Results Based On Metrics Summary PDF
This slide covers simple assessment result on marketing data. It includes affected items such as number of records, percentage of records, cost and related dimensions. Showcasing this set of slides titled Error Image, Unknown Author, Blank Overview. The topics addressed in these templates are Error Image, Unknown Author, Blank Overview. All the content presented in this PPT design is completely editable. Download it and make adjustments in color, background, font etc. as per your unique business setting.
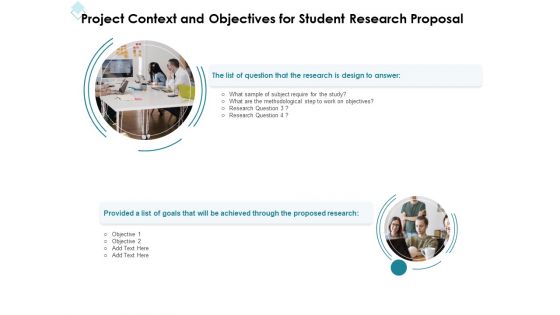
Academic Investigation Project Context And Objectives For Student Research Proposal Ppt Show Designs Download PDF
Presenting this set of slides with name academic investigation project context and objectives for student research proposal ppt show designs download pdf. This is a two stage process. The stages in this process are the list of question that the research is design to answer, provided a list of goals that will be achieved through the proposed research. This is a completely editable PowerPoint presentation and is available for immediate download. Download now and impress your audience.
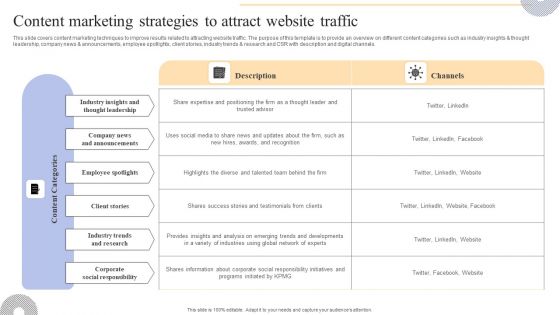
Content Marketing Strategies To Attract Website Traffic Designs PDF
This slide covers content marketing techniques to improve results related to attracting website traffic. The purpose of this template is to provide an overview on different content categories such as industry insights and thought leadership, company news and announcements, employee spotlights, client stories, industry trends and research and CSR with description and digital channels. Find a pre-designed and impeccable Content Marketing Strategies To Attract Website Traffic Designs PDF. The templates can ace your presentation without additional effort. You can download these easy-to-edit presentation templates to make your presentation stand out from others. So, what are you waiting for Download the template from Slidegeeks today and give a unique touch to your presentation.
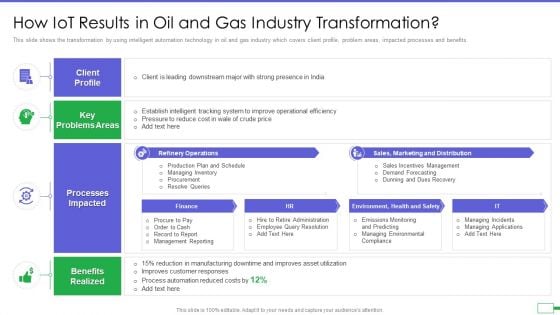
Iot And Digital Twin To Reduce Costs Post Covid How Iot Results In Oil And Gas Industry Demonstration PDF
This slide shows the transformation by using intelligent automation technology in oil and gas industry which covers client profile, problem areas, impacted processes and benefits. Presenting iot and digital twin to reduce costs post covid how iot results in oil and gas industry demonstration pdf to provide visual cues and insights. Share and navigate important information on four stages that need your due attention. This template can be used to pitch topics like client profile, key problems areas, processes impacted, benefits realized. In addtion, this PPT design contains high resolution images, graphics, etc, that are easily editable and available for immediate download.
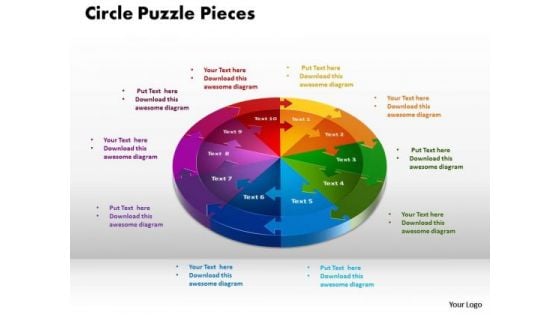
PowerPoint Theme Circle Puzzle Graphic Ppt Design
PowerPoint Theme Circle Puzzle Graphic PPT Design-This diagram is drawn up with great detail and consists of Puzzle shapes. You can easily customize, edit as well as and modify color, text and descriptions.-PowerPoint Theme Circle Puzzle Graphic PPT Design Drive home the lesson with our PowerPoint Theme Circle Puzzle Graphic Ppt Design. Bring all your experience to the fore.
Stock Photo Business Process Strategy Pyramid Structure Design Clipart Images
Bring A Cheer To Their Faces With Our stock photo business process strategy pyramid structure design clipart images. They Will Definitely Force A Smile. Our Communication Are An Enchanting Force. They Have An Array Of Attractive Assets.
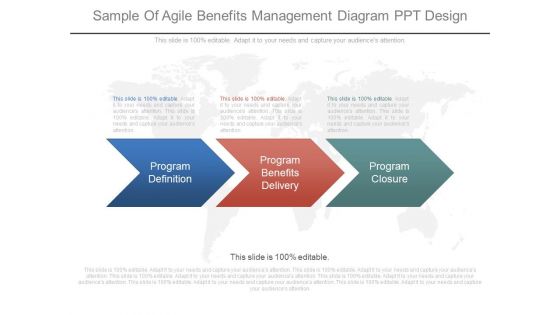
Sample Of Agile Benefits Management Diagram Ppt Design
This is a sample of agile benefits management diagram ppt design. This is a three stage process. The stages in this process are program definition, program benefits delivery, program closure.
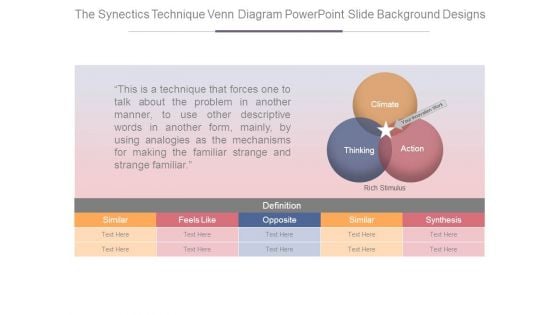
The Synectics Technique Venn Diagram Powerpoint Slide Background Designs
This is a the synectics technique venn diagram powerpoint slide background designs. This is a three stage process. The stages in this process are thinking, climate, your innovation work, action, rich stimulus, definition, similar, feels like, opposite, synthesis.
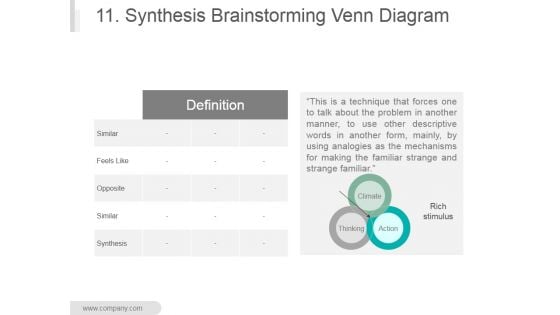
11 Synthesis Brainstorming Venn Diagram Ppt PowerPoint Presentation Designs Download
This is a 11 synthesis brainstorming venn diagram ppt powerpoint presentation designs download. This is a three stage process. The stages in this process are rich stimulus, climate, thinking, action, definition, similar.

Seo Search Business PowerPoint Template 0910
A search engine optimization arrow hits the target market SEO bulls eye Get extraordinary with our Seo Search Business PowerPoint Template 0910. Your thoughts will achieve well above the average results.
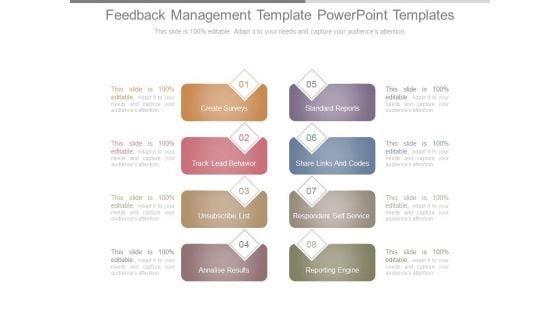
Feedback Management Template Powerpoint Templates
This is a feedback management template powerpoint templates. This is a eight stage process. The stages in this process are create surveys, track lead behavior, unsubscribe list, annalise results, reporting engine, respondent self service, share links and codes, standard reports.
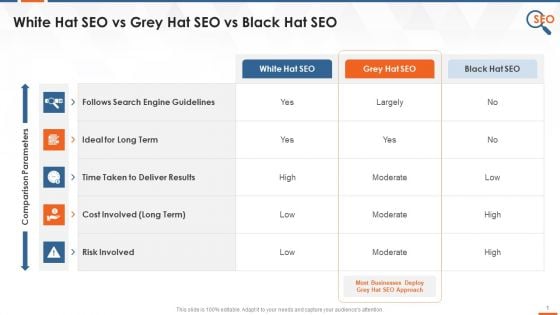
Comparison Between White Black And Grey Hat SEO Training Ppt
The following slide depicts the comparison of white, black, and grey hat SEO. The multiple parameters used for comparison are search engine guidelines, ideal for long term, time taken to deliver results, cost involved long term, and risk involved.
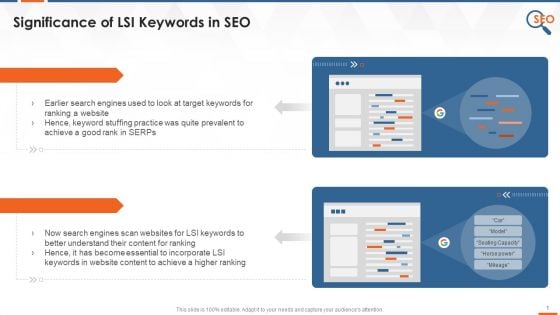
Significance Of Lsi Keywords In SEO Training Ppt
This slide provides information regarding the importance of LSI keywords in SEO to have a better understanding of website content in order to achieve higher ranks in search engine results pages SERPs.
Social Media Promotion Plan With Measure Results Ppt Icon Files PDF
This slide exhibits social media content management strategy. It includes major activities such as- identifying and setting goals, conduct social media audit on daily basis, develop metrics and KPIs for analyzing social media content. Showcasing this set of slides titled social media promotion plan with measure results ppt icon files pdf. The topics addressed in these templates are goals, social content, measure results. All the content presented in this PPT design is completely editable. Download it and make adjustments in color, background, font etc. as per your unique business setting.
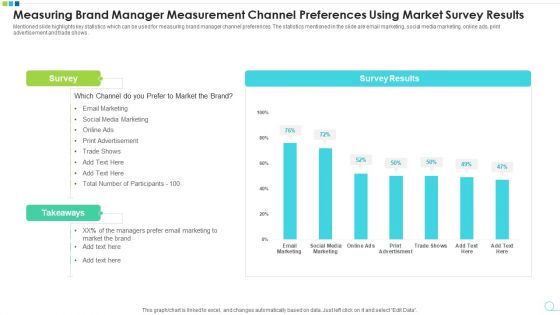
Measuring Brand Manager Measurement Channel Preferences Using Market Survey Results Professional PDF
Mentioned slide highlights key statistics which can be used for measuring brand manager channel preferences. The statistics mentioned in the slide are email marketing, social media marketing, online ads, print advertisement and trade shows. Pitch your topic with ease and precision using this measuring brand manager measurement channel preferences using market survey results professional pdf. This layout presents information on measuring brand manager measurement channel preferences using market survey results. It is also available for immediate download and adjustment. So, changes can be made in the color, design, graphics or any other component to create a unique layout.
Supplier Evaluation Matrix For Tracking Vendor Management Action Plan Results Icons PDF
This slide showcases the vendor assessment matrix for evaluating impact of supplier strategy. It covers assessment based on weighted average method including criteria such as quality, price, suppliers impression, etc. Showcasing this set of slides titled supplier evaluation matrix for tracking vendor management action plan results icons pdf. The topics addressed in these templates are supplier evaluation matrix for tracking vendor management action plan results. All the content presented in this PPT design is completely editable. Download it and make adjustments in color, background, font etc. as per your unique business setting.
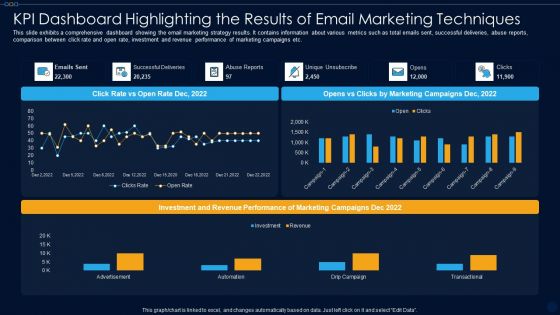
KPI Dashboard Highlighting The Results Of Email Marketing Techniques Ppt PowerPoint Presentation File Format PDF
This slide exhibits a comprehensive dashboard showing the email marketing strategy results. It contains information about various metrics such as total emails sent, successful deliveries, abuse reports, comparison between click rate and open rate, investment and revenue performance of marketing campaigns etc. Showcasing this set of slides titled kpi dashboard highlighting the results of email marketing techniques ppt powerpoint presentation file format pdf. The topics addressed in these templates are advertisement, automation, drip campaign, transactional. All the content presented in this PPT design is completely editable. Download it and make adjustments in color, background, font etc. as per your unique business setting.
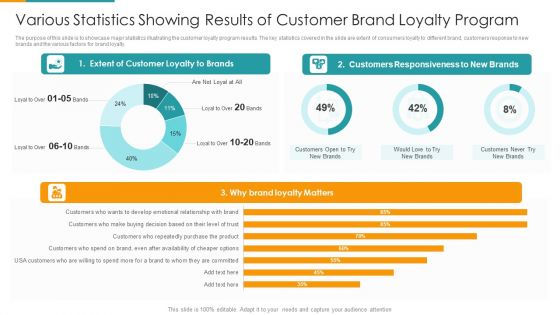
Various Statistics Showing Results Of Customer Brand Loyalty Program Background PDF
The purpose of this slide is to showcase major statistics illustrating the customer loyalty program results. The key statistics covered in the slide are extent of consumers loyalty to different brand, customers response to new brands and the various factors for brand loyalty. Pitch your topic with ease and precision using this various statistics showing results of customer brand loyalty program background pdf. This layout presents information on extent of customer loyalty to brands, customers responsiveness to new brands, brand loyalty matters. It is also available for immediate download and adjustment. So, changes can be made in the color, design, graphics or any other component to create a unique layout.


 Continue with Email

 Home
Home


