Solution

Arrows Opposite Directions Success PowerPoint Templates And PowerPoint Themes 0912
Arrows Opposite Directions Success PowerPoint Templates And PowerPoint Themes 0912-Microsoft Powerpoint Templates and Background with opposite arrows Explanations are a cinch with our Arrows Opposite Directions Success PowerPoint Templates And PowerPoint Themes 0912. Your thoughts will be easily accepted.

Stock Photo 2014 In American Flag Colors PowerPoint Slide
Our above image shows of graphic of year 2014 designed with American flag colors. You can download this 2014 image slide to prepare presentations to celebrate the Year 2014. This image provides a fantastic explanation of the topic.

Stock Photo Arrow Made With Green Grass PowerPoint Slide
Our above image shows of graphic of arrow made of green grass. Use this arrow design in nature related topics. This image provides a fantastic explanation of the topic. Deliver amazing presentations to mesmerize your audience.
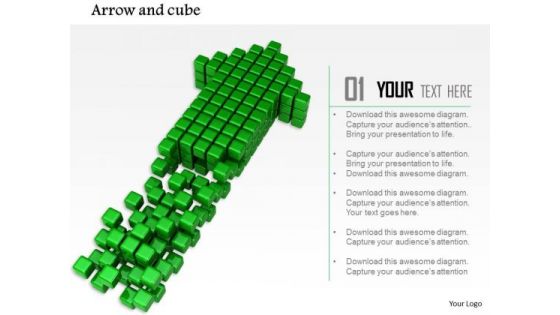
Stock Photo Green Arrow Made With Cubes PowerPoint Slide
Our above image shows of graphic of arrow made of green cubes. Use this arrow design in business related topics. This image provides a fantastic explanation of the topic. Deliver amazing presentations to mesmerize your audience.
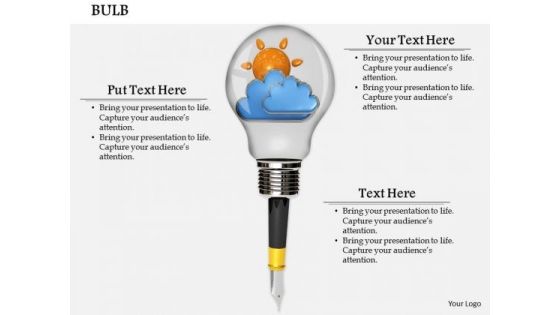
0814 Stock Photo Graphics Of Sun And Cloud In Bulb PowerPoint Slide
Our above image has a design of sun and cloud in bulb. This image is best to describe the concept of new idea, hope beginning. You can provide a fantastic explanation of the topic with this image.

Stock Photo 3d Books With One Red Book Out Shows Leadership PowerPoint Slide
Our above image has a theme of books with one standing out. This image is best to describe the concept of leadership. You can provide a fantastic explanation of the topic with this image.
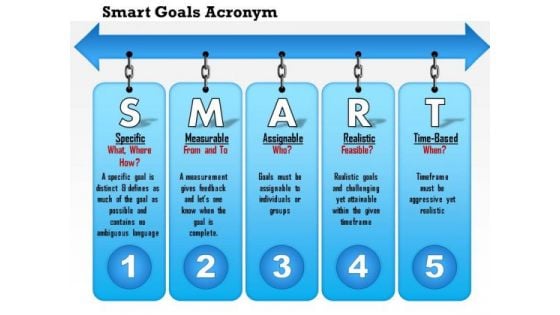
Business Diagram Smart Goals Acronym PowerPoint Ppt Presentation
This slide displays smart goals acronym. This diagram provides details explanation of smart goals. Smart goals are specific, measurable, assignable, and realistic and time based. This template helps you to grab the attention of your listener.

3d Happy Man With Money PowerPoint Templates
Explain the concept of financial growth strategy and its requirement for success with this unique image. This contains the graphic of 3d man with money. This diagram slide is well designed for finance presentations to give better explanation of growth.
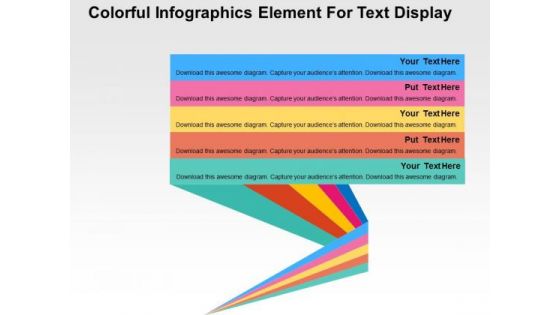
Colorful Infographics Element For Text Display PowerPoint Templates
Our above slide has a theme of colorful text boxes. This Infographics slide is best to describe text I information. You can provide a fantastic explanation of the topic with this slide.
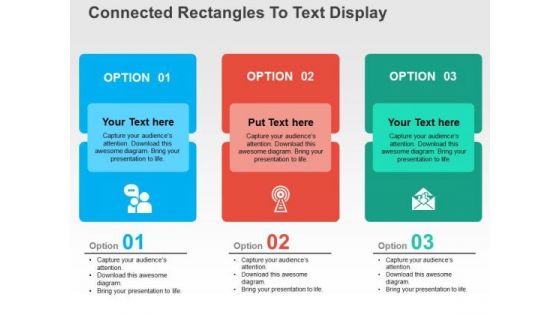
Connected Rectangles To Text Display PowerPoint Templates
Our above slide has a theme of connected rectangles. This Infographics slide is best to describe text information. You can provide a fantastic explanation of the topic with this slide.
Two Steps Chain Design PowerPoint Templates
Our above image displays graphic of chain design. This slide is well designed with the concept of networking and teamwork. This image provides a fantastic explanation of the topic.
Compass Arrow On Bulb PowerPoint Templates
Our above slide has a theme of compass arrow pointing on bulb. This infographic slide is best to describe concepts of idea and planning. You can provide a fantastic explanation of the topic with this slide.
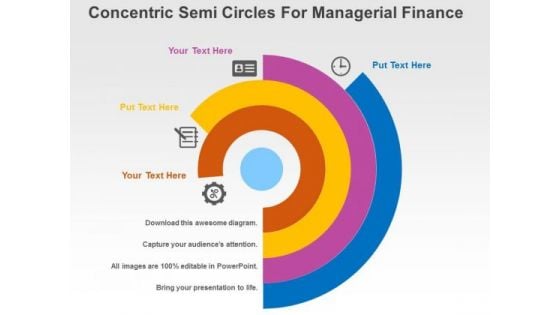
Concentric Semi Circles For Managerial Finance PowerPoint Templates
Our above slide has been designed with concentric semi circles. This infographic slide is best to describe concept of managerial finance. You can provide a fantastic explanation of the topic with this slide.
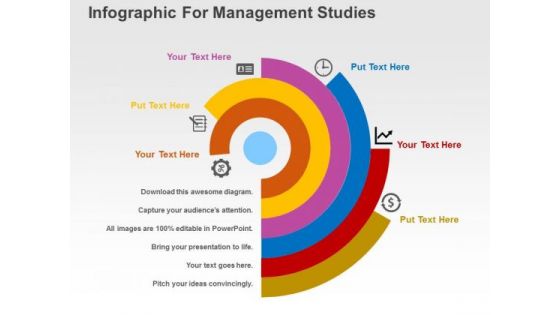
Infographic For Management Studies PowerPoint Templates
Our above slide has been designed with concentric semi circles. This infographic slide is best to describe concept of managerial finance. You can provide a fantastic explanation of the topic with this slide.
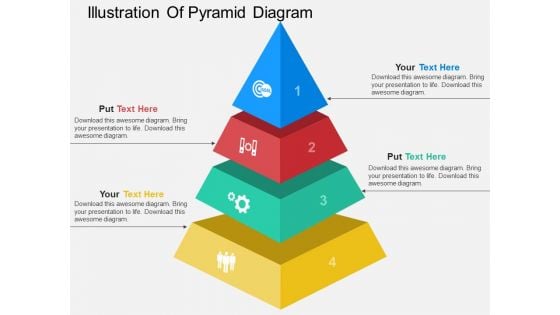
Illustration Of Pyramid Diagram Powerpoint Template
This PowerPoint slide contains illustration of pyramid diagram. This professional slide may be used for visual explanation of data. Adjust the above diagram in your business presentations to give professional impact.
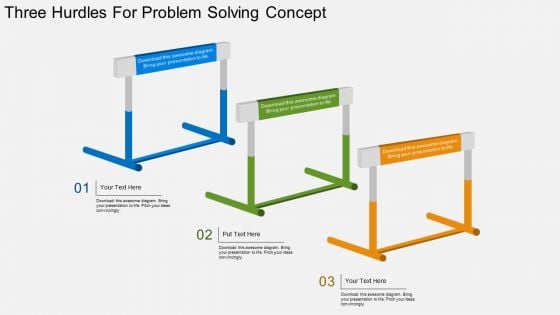
Three Hurdles For Problem Solving Concept Powerpoint Template
This PowerPoint template has been designed with graphics of three hurdles. This PPT slide is best to describe business strategy analysis. You can provide a fantastic explanation of the topic with this slide.
Three Medicine Bottle With Research Icons Powerpoint Template
Our above slide has been designed with medicine bottle with research icons. This infographic slide is best for medical science and research related topics. You can provide a fantastic explanation of the topic with this slide.
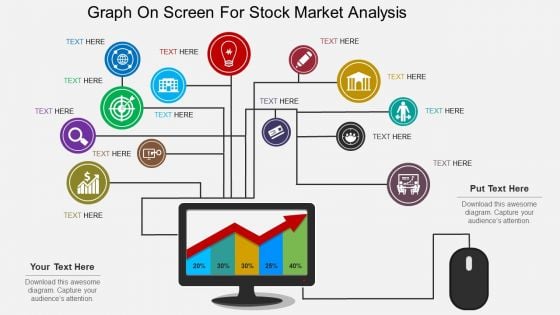
Graph On Screen For Stock Market Analysis Powerpoint Template
This PowerPoint slide contains computer screen with business graph. This professional slide may be used for visual explanation of data. Adjust the above diagram in your business presentations to give professional impact.

Colorful Idea Word With Human Hand Powerpoint Templates
Our above PPT slide has diagram of colorful idea word with human hand. This business diagram slide is best to describe the concept of idea planning. You can provide a fantastic explanation of the topic with this image.
Dollar Mobile Bar Graph And Monitor Icons In Circles Powerpoint Templates
Our above slide has been designed with dollar, mobile, bar graph and monitor icons. This infographic slide is best to describe text information. You can provide a fantastic explanation of the topic with this slide.

Four Circles For Information Display Powerpoint Templates
This PowerPoint slide contains graphics of four circles. This professional slide may be used for visual explanation of data. Adjust the above diagram in your business presentations to give professional impact.

Set Of Seven Vertical Steps Powerpoint Templates
This PowerPoint slide contains graphics of seven vertical steps. This professional slide may be used for visual explanation of data. Adjust the above diagram in your business presentations to give professional impact.
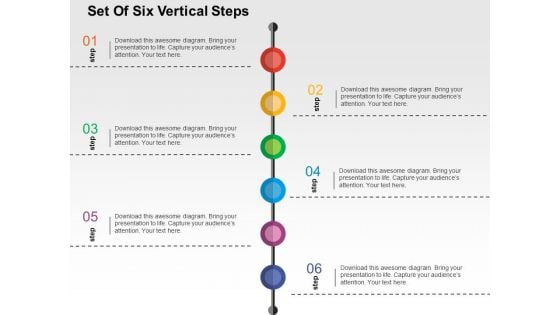
Set Of Six Vertical Steps Powerpoint Templates
This PowerPoint slide contains graphics of six vertical steps. This professional slide may be used for visual explanation of data. Adjust the above diagram in your business presentations to give professional impact.
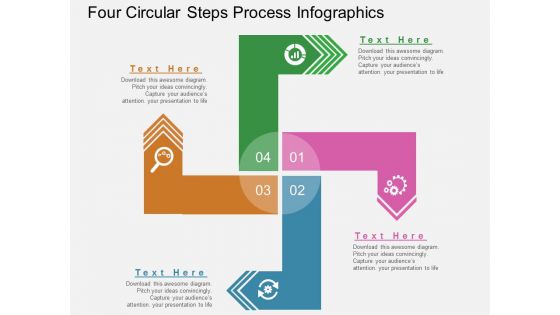
Four Circular Steps Process Infographics Powerpoint Template
This PowerPoint slide contains circular steps process infographic. This professional slide may be used for visual explanation of data. Adjust the above diagram in your business presentations to give professional impact.
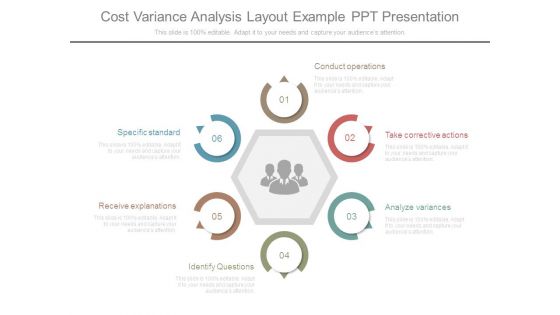
Cost Variance Analysis Layout Example Ppt Presentation
This is a cost variance analysis layout example ppt presentation. This is a six stage process. The stages in this process are conduct operations, take corrective actions, analyze variances, identify questions, receive explanations, specific standard.

Competitive Landscape Ppt PowerPoint Presentation Pictures Styles
This is a competitive landscape ppt powerpoint presentation pictures styles. This is a five stage process. The stages in this process are competitors, market leader, challenger, niche competitor, explanation.
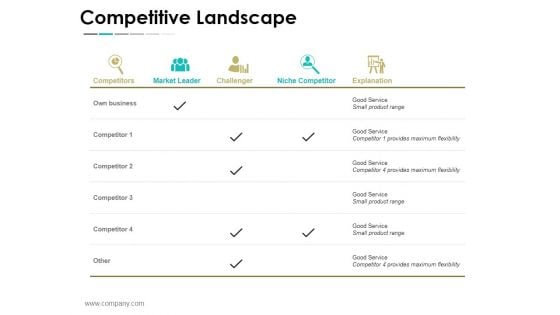
Competitive Landscape Ppt PowerPoint Presentation Model Infographics
This is a competitive landscape ppt powerpoint presentation model infographics. This is a four stage process. The stages in this process are competitors, market leader, challenger, niche competitor, explanation.
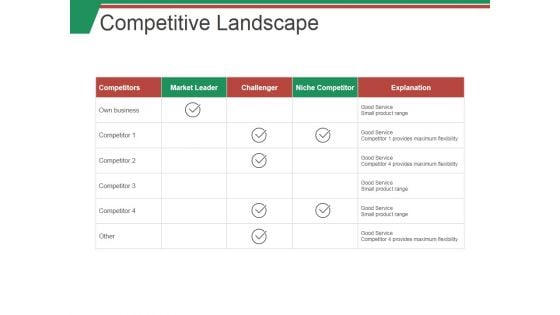
Competitive Landscape Ppt PowerPoint Presentation Pictures Microsoft
This is a competitive landscape ppt powerpoint presentation pictures microsoft. This is a four stage process. The stages in this process are competitors, market leader, challenger, niche competitor, explanation.
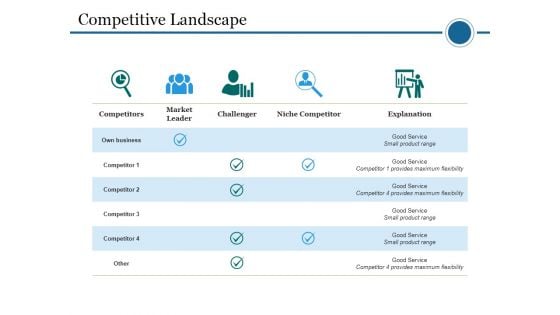
Competitive Landscape Ppt PowerPoint Presentation Styles Gridlines
This is a competitive landscape ppt powerpoint presentation styles gridlines. This is a four stage process. The stages in this process are competitors, market leader, challenger, niche competitor, explanation.
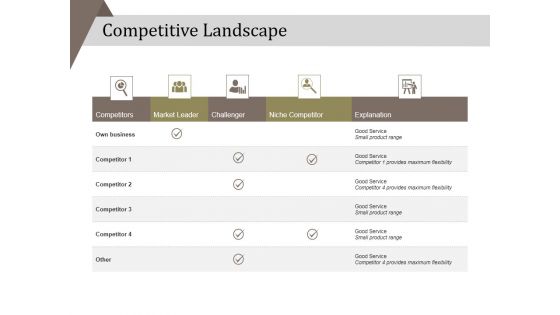
Competitive Landscape Ppt PowerPoint Presentation Gallery Background Image
This is a competitive landscape ppt powerpoint presentation gallery background image. This is a five stage process. The stages in this process are competitors, market leader, challenger, niche competitor, explanation.
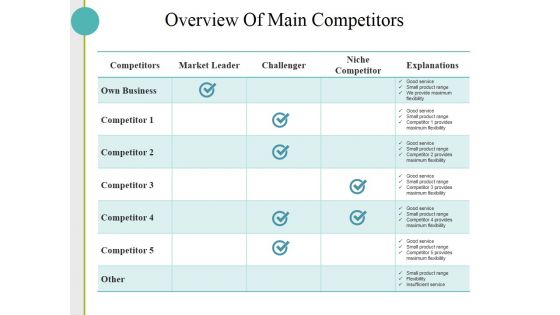
Overview Of Main Competitors Ppt PowerPoint Presentation File Clipart Images
This is a overview of main competitors ppt powerpoint presentation file clipart images. This is a three stage process. The stages in this process are competitors, market leader, challenger, niche competitor, explanations.
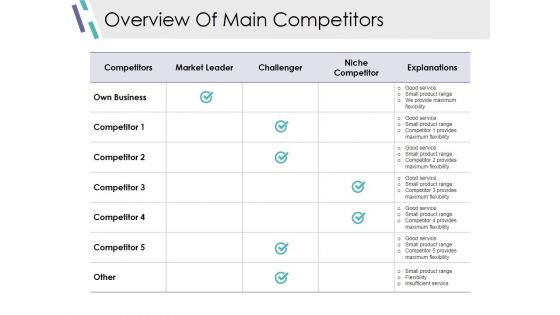
Overview Of Main Competitors Ppt PowerPoint Presentation Show Template
This is a overview of main competitors ppt powerpoint presentation show template. This is a five stage process. The stages in this process are competitors, market leader, challenger, niche competitor, explanations.
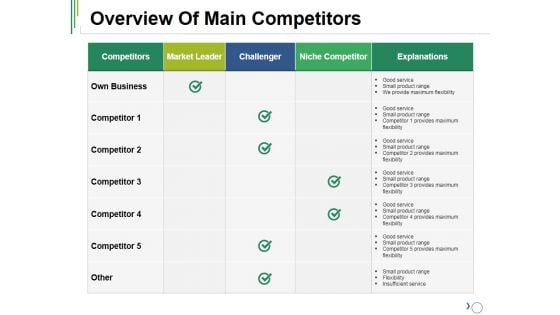
Overview Of Main Competitors Ppt PowerPoint Presentation Pictures Graphics Design
This is a overview of main competitors ppt powerpoint presentation pictures graphics design. This is a five stage process. The stages in this process are market leader, challenger, explanations, niche competitor, competitor.
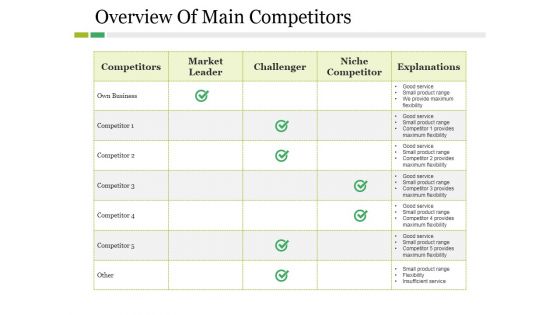
Overview Of Main Competitors Ppt PowerPoint Presentation Styles Portrait
This is a overview of main competitors ppt powerpoint presentation styles portrait. This is a four stage process. The stages in this process are market leader, challenger, explanations, niche competitor, own business.
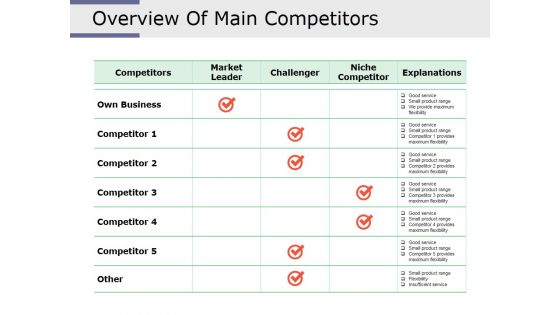
Overview Of Main Competitors Ppt PowerPoint Presentation Example File
This is a overview of main competitors ppt powerpoint presentation example file. This is a three stage process. The stages in this process are market leader, challenger, niche competitor, explanations, competitors.
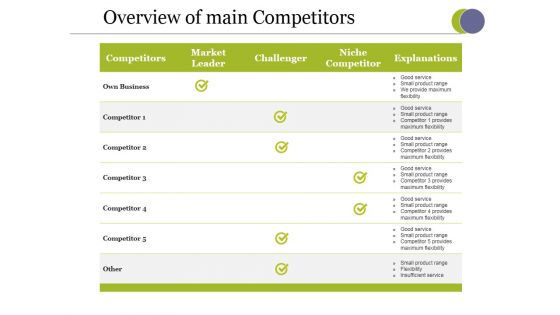
Overview Of Main Competitors Ppt PowerPoint Presentation Gallery Graphics Tutorials
This is a overview of main competitors ppt powerpoint presentation gallery graphics tutorials. This is a three stage process. The stages in this process are market leader, challenger, niche competitor, explanations, competitors.
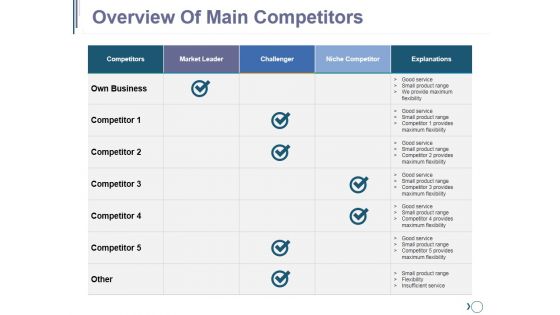
Overview Of Main Competitors Ppt PowerPoint Presentation File Designs
This is a overview of main competitors ppt powerpoint presentation file designs. This is a six stage process. The stages in this process are competitors, market leader, challenger, niche competitor, explanations.
Overview Of Main Competitors Ppt PowerPoint Presentation Icon Layout Ideas
This is a overview of main competitors ppt powerpoint presentation icon layout ideas. This is a five stage process. The stages in this process are competitors, market leader, challenger, niche competitor, explanations.
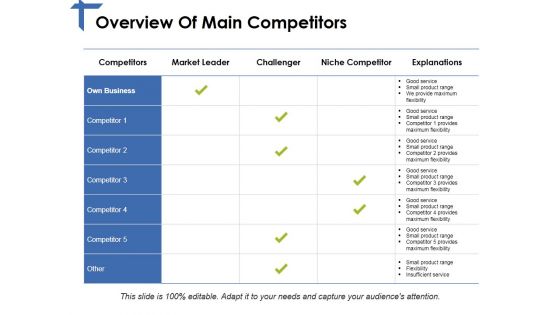
Overview Of Main Competitors Ppt PowerPoint Presentation Summary Example File
This is a overview of main competitors ppt powerpoint presentation summary example file. This is a five stage process. The stages in this process are own business, competitor, market leader, challenger, explanations.
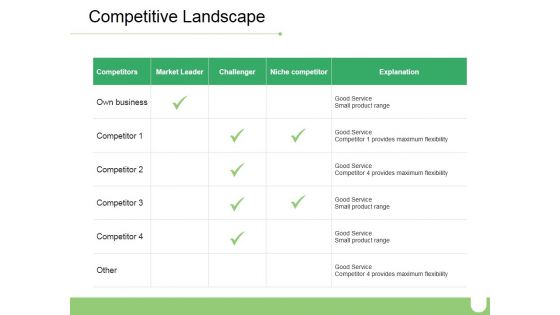
Competitive Landscape Ppt PowerPoint Presentation Professional Design Templates
This is a competitive landscape ppt powerpoint presentation professional design templates. This is a four stage process. The stages in this process are competitors, market leader, challenger, niche competitor, explanation.
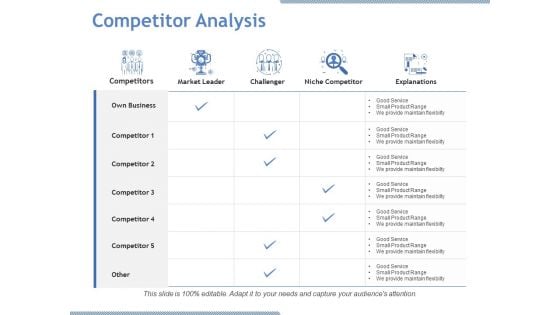
Competitor Analysis Ppt PowerPoint Presentation Model Layout Ideas
This is a competitor analysis ppt powerpoint presentation model layout ideas. This is a five stage process. The stages in this process are competitors, market leader, challenger, explanations, niche competitor.
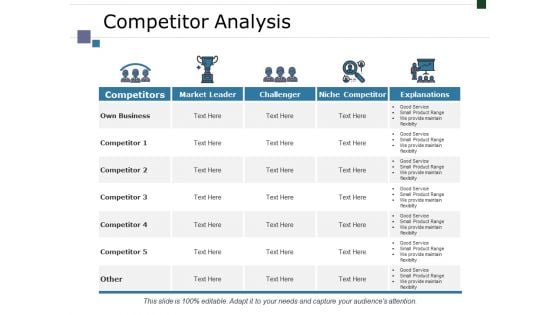
Competitor Analysis Ppt PowerPoint Presentation Infographics Infographic Template
This is a competitor analysis ppt powerpoint presentation infographics infographic template. This is a five stage process. The stages in this process are competitors, market leader, challenger, niche competitor, explanations.
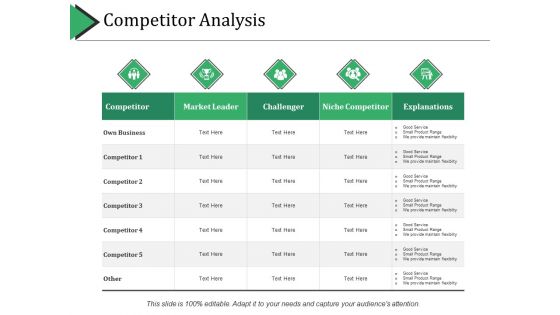
Competitor Analysis Ppt PowerPoint Presentation Summary Graphics Template
This is a competitor analysis ppt powerpoint presentation summary graphics template. This is a five stage process. The stages in this process are competitor, market leader, challenger, niche competitor, explanations.
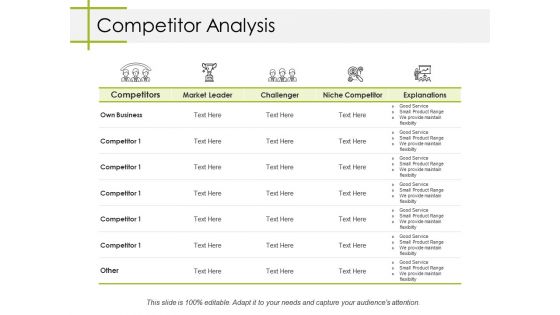
Competitor Analysis Ppt PowerPoint Presentation Ideas Example
This is a competitor analysis ppt powerpoint presentation ideas example. This is a five stage process. The stages in this process are competitors, market leader, challenger, niche competitor, explanations.
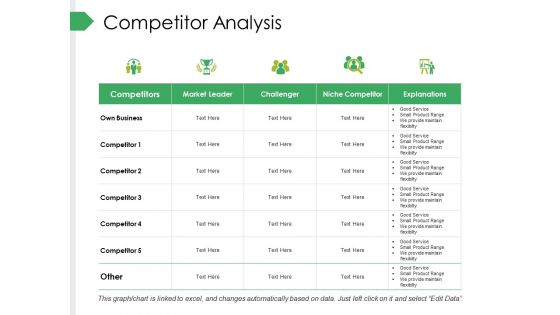
Competitor Analysis Ppt PowerPoint Presentation Outline Slides
This is a competitor analysis ppt powerpoint presentation outline slides. This is a five stage process. The stages in this process are competitors, market leader, challenger, niche competitor, explanations
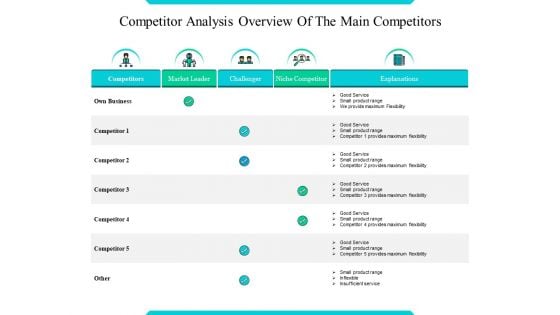
Competitor Analysis Overview Of The Main Competitors Ppt PowerPoint Presentation Infographics Layout Ideas
This is a competitor analysis overview of the main competitors ppt powerpoint presentation infographics layout ideas. This is a five stage process. The stages in this process are competitors, market leader, challenger, niche competitor, explanations.
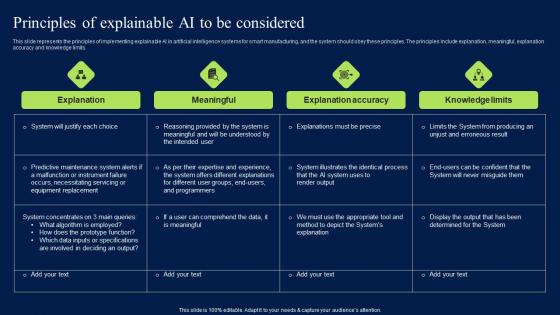
Principles Of Explainable AI To Be Considered Artificial Intelligence Impact Themes PDF
This slide represents the principles of implementing explainable AI in artificial intelligence systems for smart manufacturing, and the system should obey these principles. The principles include explanation, meaningful, explanation accuracy and knowledge limits. Create an editable Principles Of Explainable AI To Be Considered Artificial Intelligence Impact Themes PDF that communicates your idea and engages your audience. Whether you are presenting a business or an educational presentation, pre-designed presentation templates help save time. Principles Of Explainable AI To Be Considered Artificial Intelligence Impact Themes PDF is highly customizable and very easy to edit, covering many different styles from creative to business presentations. Slidegeeks has creative team members who have crafted amazing templates. So, go and get them without any delay. This slide represents the principles of implementing explainable AI in artificial intelligence systems for smart manufacturing, and the system should obey these principles. The principles include explanation, meaningful, explanation accuracy and knowledge limits.
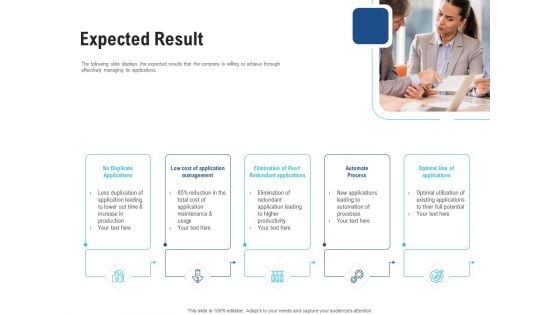
Enhance Enterprise Application Performance Expected Result Ppt Infographics Show PDF
Presenting enhance enterprise application performance expected result ppt infographics show pdf to provide visual cues and insights. Share and navigate important information on five stages that need your due attention. This template can be used to pitch topics like application leading, production, application management, productivity, automation processes . In addtion, this PPT design contains high-resolution images, graphics, etc, that are easily editable and available for immediate download.
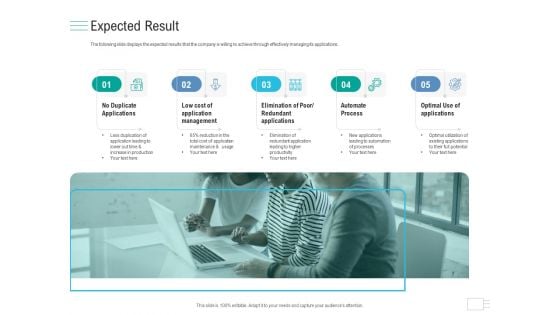
Business API Management Expected Result Ppt Layouts Microsoft PDF
Presenting business API management expected result ppt layouts microsoft pdf to provide visual cues and insights. Share and navigate important information on five stages that need your due attention. This template can be used to pitch topics like elimination redundant application leading to higher productivity, automate process, applications leading to automation processes, optimal use applications. In addtion, this PPT design contains high-resolution images, graphics, etc, that are easily editable and available for immediate download.
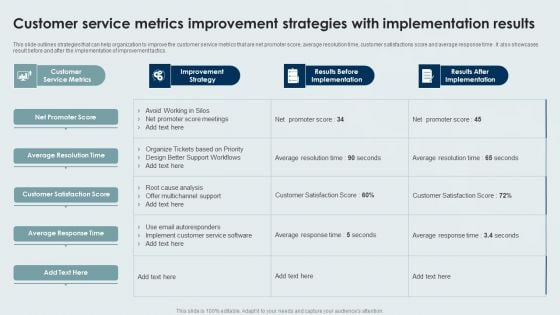
Customer Service Metrics Improvement Strategies With Implementation Results Clipart PDF
This slide outlines strategies that can help organization to improve the customer service metrics that are net promoter score, average resolution time, customer satisfactions score and average response time . It also showcases result before and after the implementation of improvement tactics. Pitch your topic with ease and precision using this Customer Service Metrics Improvement Strategies With Implementation Results Clipart PDF. This layout presents information on Customer Service Metrics, Improvement Strategy, Results Before Implementation. It is also available for immediate download and adjustment. So, changes can be made in the color, design, graphics or any other component to create a unique layout.
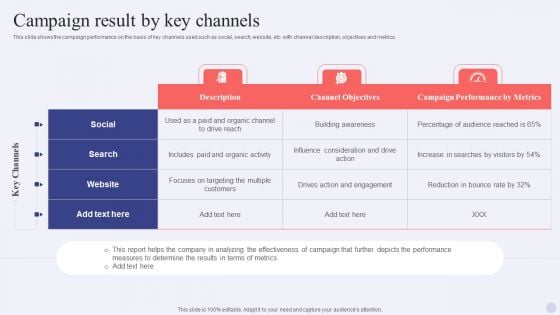
Electronic Commerce Systems Campaign Result By Key Channels Demonstration PDF
This slide shows the campaign performance on the basis of key channels used such as social, search, website, etc. with channel description, objectives and metrics. Deliver and pitch your topic in the best possible manner with this Electronic Commerce Systems Campaign Result By Key Channels Demonstration PDF. Use them to share invaluable insights on Channel Objectives, Social, Search and impress your audience. This template can be altered and modified as per your expectations. So, grab it now.
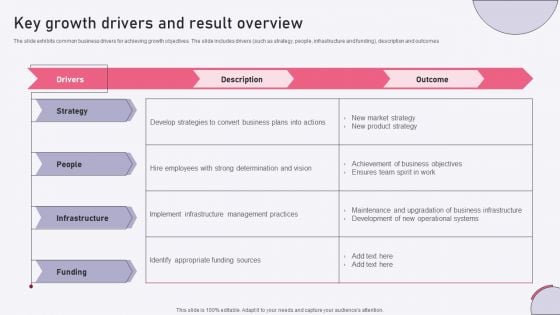
Key Growth Drivers And Result Overview Ppt File Deck PDF
The slide exhibits common business drivers for achieving growth objectives. The slide includes drivers such as strategy, people, infrastructure and funding, description and outcomes. Pitch your topic with ease and precision using this Key Growth Drivers And Result Overview Ppt File Deck PDF. This layout presents information on Strategy, People, Infrastructure, Funding. It is also available for immediate download and adjustment. So, changes can be made in the color, design, graphics or any other component to create a unique layout.
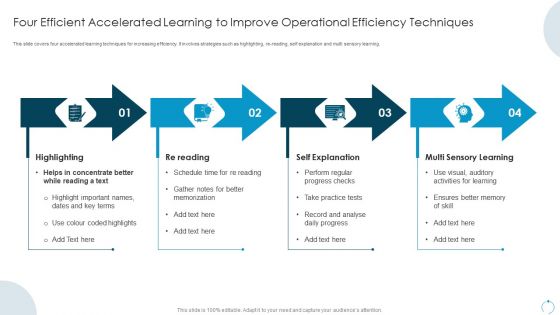
Four Efficient Accelerated Learning To Improve Operational Efficiency Techniques Introduction PDF
This slide covers four accelerated learning techniques for increasing efficiency. It involves strategies such as highlighting, re-reading, self explanation and multi sensory learning. Presenting Four Efficient Accelerated Learning To Improve Operational Efficiency Techniques Introduction PDF to dispense important information. This template comprises four stages. It also presents valuable insights into the topics including Highlighting, Re Reading, Self Explanation, Multi Sensory Learning. This is a completely customizable PowerPoint theme that can be put to use immediately. So, download it and address the topic impactfully.
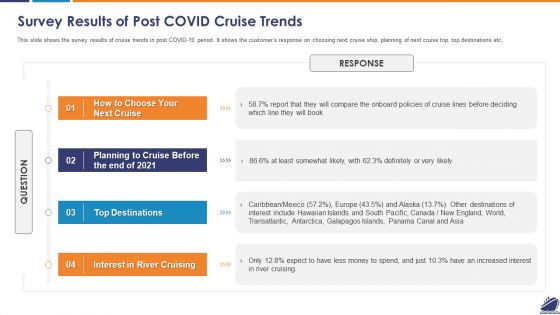
Survey Results Of Post COVID Cruise Trends Portrait PDF
This slide shows the survey results of cruise trends in post COVID 19 period. It shows the customers response on choosing next cruise ship, planning of next cruise trip, top destinations etc. Presenting survey results of post covid cruise trends portrait pdf to provide visual cues and insights. Share and navigate important information on four stages that need your due attention. This template can be used to pitch topics like planning to cruise before the end of 2021, top destinations, interest in river cruising. In addtion, this PPT design contains high resolution images, graphics, etc, that are easily editable and available for immediate download.
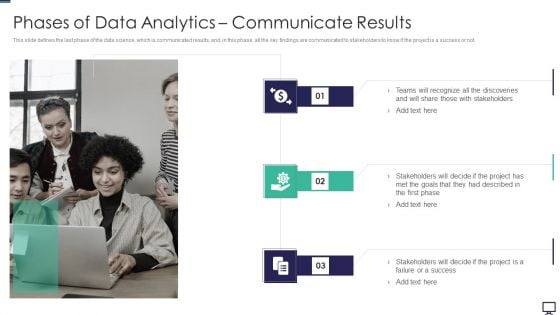
Phases Of Data Analytics Communicate Results Ppt Ideas Inspiration PDF
This slide defines the last phase of the data science, which is communicated results, and, in this phase, all the key findings are communicated to stakeholders to know if the project is a success or not. Presenting phases of data analytics communicate results ppt ideas inspiration pdf to provide visual cues and insights. Share and navigate important information on three stages that need your due attention. This template can be used to pitch topics like goals, project. In addtion, this PPT design contains high resolution images, graphics, etc, that are easily editable and available for immediate download.
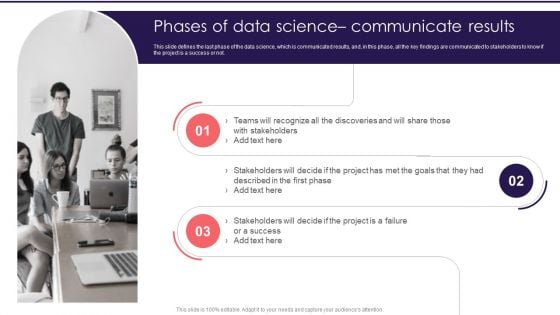
Information Studies Phases Of Data Science Communicate Results Structure PDF
This slide defines the last phase of the data science, which is communicated results, and, in this phase, all the key findings are communicated to stakeholders to know if the project is a success or not. Presenting Information Studies Phases Of Data Science Communicate Results Structure PDF to provide visual cues and insights. Share and navigate important information on three stages that need your due attention. This template can be used to pitch topics like Goals, Project. In addtion, this PPT design contains high resolution images, graphics, etc, that are easily editable and available for immediate download.
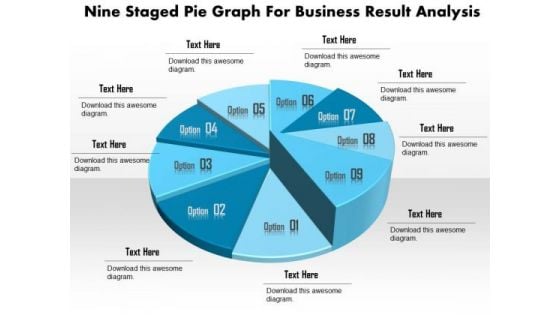
Business Diagram Nine Staged Pie Graph For Business Result Analysis Presentation Template
This business slide displays nine staged pie chart. This diagram is a data visualization tool that gives you a simple way to present statistical information. This slide helps your audience examine and interpret the data you present.
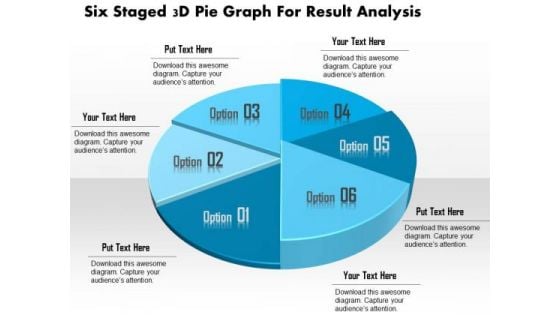
Business Diagram Six Staged 3d Pie Graph For Result Analysis Presentation Template
This business slide displays six staged pie chart. This diagram is a data visualization tool that gives you a simple way to present statistical information. This slide helps your audience examine and interpret the data you present.
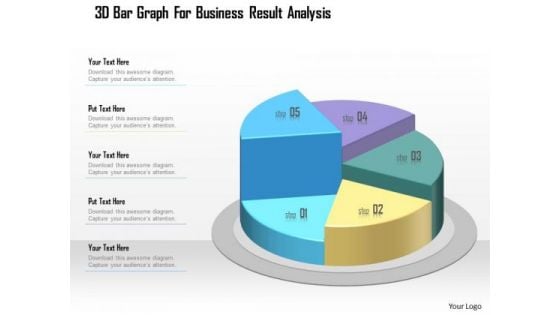
Business Diagram 3d Bar Graph For Business Result Analysis Presentation Template
This business slide displays five staged pie chart. This diagram is a data visualization tool that gives you a simple way to present statistical information. This slide helps your audience examine and interpret the data you present.
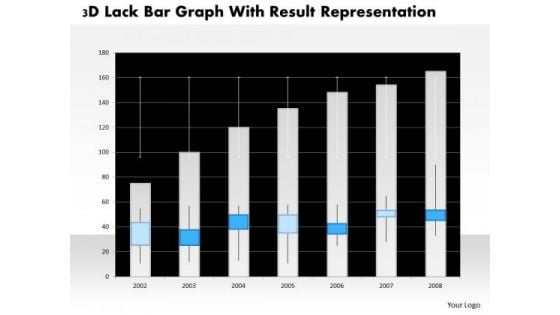
Business Diagram 3d Lack Bar Graph With Result Representation PowerPoint Slide
This business diagram has graphic of 3d lack bar graph. This diagram is a data visualization tool that gives you a simple way to present statistical information. This slide helps your audience examine and interpret the data you present.


 Continue with Email

 Home
Home


