Stack Diagram
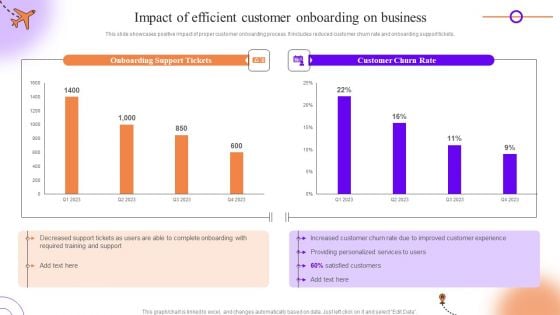
Client Onboarding Journey Impact On Business Impact Of Efficient Customer Onboarding Diagrams PDF
This slide showcases positive impact of proper customer onboarding process. It includes reduced customer churn rate and onboarding support tickets. Slidegeeks is one of the best resources for PowerPoint templates. You can download easily and regulate Client Onboarding Journey Impact On Business Impact Of Efficient Customer Onboarding Diagrams PDF for your personal presentations from our wonderful collection. A few clicks is all it takes to discover and get the most relevant and appropriate templates. Use our Templates to add a unique zing and appeal to your presentation and meetings. All the slides are easy to edit and you can use them even for advertisement purposes.
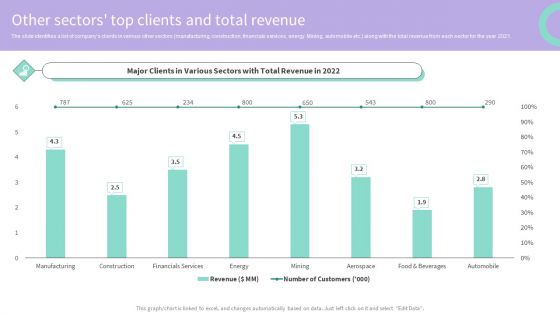
Buy Side Merger And Acquisition Advisory Other Sectors Top Clients And Total Revenue Diagrams PDF
The slide identifies a list of companys clients in various other sectors manufacturing, construction, financials services, energy. Mining, automobile etc. along with the total revenue from each sector for the year 2021. Take your projects to the next level with our ultimate collection of Buy Side Merger And Acquisition Advisory Other Sectors Top Clients And Total Revenue Diagrams PDF. Slidegeeks has designed a range of layouts that are perfect for representing task or activity duration, keeping track of all your deadlines at a glance. Tailor these designs to your exact needs and give them a truly corporate look with your own brand colors they will make your projects stand out from the rest.
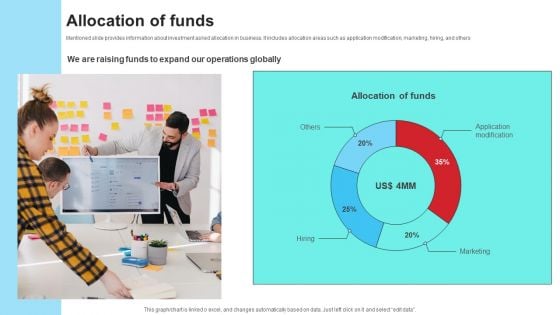
Community Engagement Platform Fundraising Pitch Deck Allocation Of Funds Diagrams PDF
Mentioned slide provides information about investment asked allocation in business. It includes allocation areas such as application modification, marketing, hiring, and others. Boost your pitch with our creative Community Engagement Platform Fundraising Pitch Deck Allocation Of Funds Diagrams PDF. Deliver an awe-inspiring pitch that will mesmerize everyone. Using these presentation templates you will surely catch everyones attention. You can browse the ppts collection on our website. We have researchers who are experts at creating the right content for the templates. So you do not have to invest time in any additional work. Just grab the template now and use them.
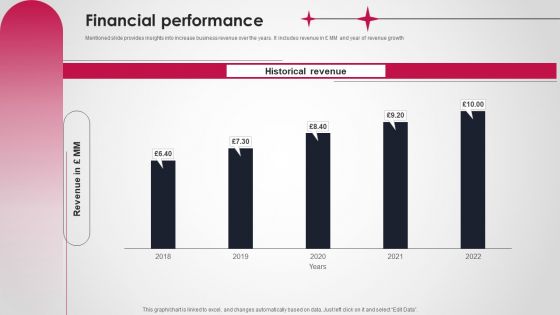
Logistics And Supply Chain Platform Funding Pitch Deck Financial Performance Diagrams PDF
Mentioned slide provides insights into increase business revenue over the years. It includes revenue in MM and year of revenue growth Boost your pitch with our creative Logistics And Supply Chain Platform Funding Pitch Deck Financial Performance Diagrams PDF. Deliver an awe-inspiring pitch that will mesmerize everyone. Using these presentation templates you will surely catch everyones attention. You can browse the ppts collection on our website. We have researchers who are experts at creating the right content for the templates. So you do not have to invest time in any additional work. Just grab the template now and use them.
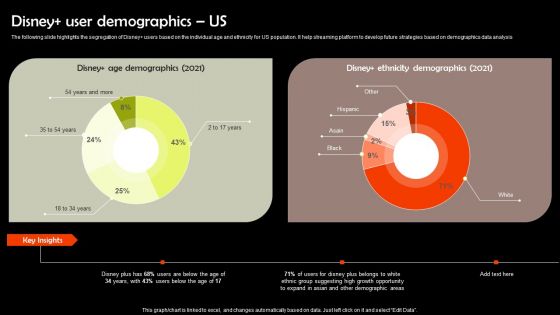
Digital Media Streaming Platform Company Profile Disney User Demographics US Diagrams PDF
The following slide highlights the segregation of Disney users based on the individual age and ethnicity for US population. It help streaming platform to develop future strategies based on demographics data analysis Take your projects to the next level with our ultimate collection of Digital Media Streaming Platform Company Profile Disney User Demographics US Diagrams PDF. Slidegeeks has designed a range of layouts that are perfect for representing task or activity duration, keeping track of all your deadlines at a glance. Tailor these designs to your exact needs and give them a truly corporate look with your own brand colors they will make your projects stand out from the rest.
Providing Efficient Client Services Kpi Dashboard For Tracking Customer Retention Diagrams PDF
This slide covers the dashboard for analyzing customer loyalty with metrics such as NPS, loyal customer rate, premium users, CLV, customer churn, revenue churn, net retention, MRR growth, etc. Take your projects to the next level with our ultimate collection of Providing Efficient Client Services Kpi Dashboard For Tracking Customer Retention Diagrams PDF. Slidegeeks has designed a range of layouts that are perfect for representing task or activity duration, keeping track of all your deadlines at a glance. Tailor these designs to your exact needs and give them a truly corporate look with your own brand colors they will make your projects stand out from the rest.
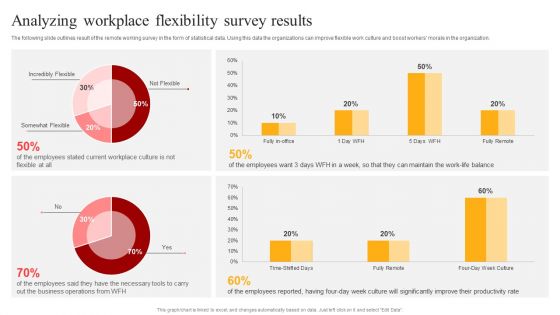
Flexible Working Policies And Guidelines Analyzing Workplace Flexibility Survey Results Diagrams PDF
The following slide outlines result of the remote working survey in the form of statistical data. Using this data the organizations can improve flexible work culture and boost workers morale in the organization. Boost your pitch with our creative Flexible Working Policies And Guidelines Analyzing Workplace Flexibility Survey Results Diagrams PDF. Deliver an awe-inspiring pitch that will mesmerize everyone. Using these presentation templates you will surely catch everyones attention. You can browse the ppts collection on our website. We have researchers who are experts at creating the right content for the templates. So you do not have to invest time in any additional work. Just grab the template now and use them.
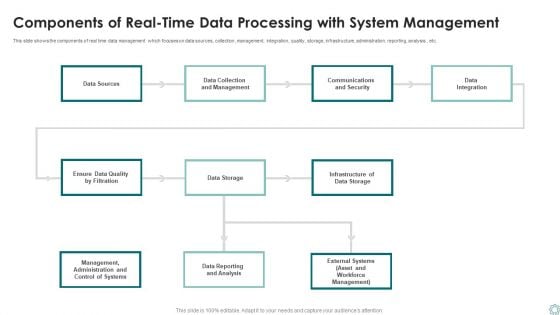
Components Of Real Time Data Processing With System Management Ppt Infographic Template Diagrams PDF
This slide shows the components of real time data management which focuses on data sources, collection, management, integration, quality, storage, infrastructure, administration, reporting, analysis, etc. Presenting Components Of Real Time Data Processing With System Management Ppt Infographic Template Diagrams PDF to dispense important information. This template comprises one stages. It also presents valuable insights into the topics including Data Storage, Data Sources, Data Integration. This is a completely customizable PowerPoint theme that can be put to use immediately. So, download it and address the topic impactfully.
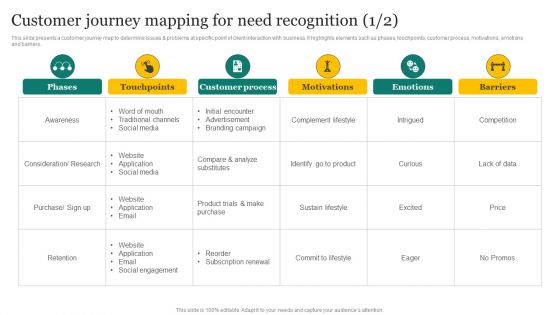
Strategic Promotion Plan Development Stages Customer Journey Mapping For Need Recognition Diagrams PDF
This slide presents a customer journey map to determine issues and problems at specific point of client interaction with business. It highlights elements such as phases, touchpoints, customer process, motivations, emotions and barriers. Boost your pitch with our creative Strategic Promotion Plan Development Stages Customer Journey Mapping For Need Recognition Diagrams PDF. Deliver an awe-inspiring pitch that will mesmerize everyone. Using these presentation templates you will surely catch everyones attention. You can browse the ppts collection on our website. We have researchers who are experts at creating the right content for the templates. So you do not have to invest time in any additional work. Just grab the template now and use them.

Virtual Currency Investment Guide For Companies Dashboard To Effectively Track Bitcoin Diagrams PDF
The following dashboard highlights key parameters that can be used by the organization to track the performance of their bitcoin investment, it enlists major KPIs such as price of bitcoin, transaction chart and its historical performance. Deliver an awe inspiring pitch with this creative Virtual Currency Investment Guide For Companies Dashboard To Effectively Track Bitcoin Diagrams PDF bundle. Topics like Prediction Meter, Todays Market Activity, Transaction Chart can be discussed with this completely editable template. It is available for immediate download depending on the needs and requirements of the user.
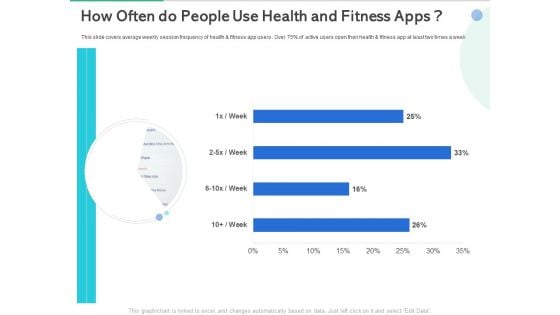
Market Overview Fitness Industry How Often Do People Use Health And Fitness Apps Diagrams PDF
This slide covers average weekly session frequency of health and fitness app users . Over 75 percent of active users open their health and fitness app at least two times a week. Deliver an awe-inspiring pitch with this creative market overview fitness industry how often do people use health and fitness apps diagrams pdf bundle. Topics like people use health and fitness apps can be discussed with this completely editable template. It is available for immediate download depending on the needs and requirements of the user.
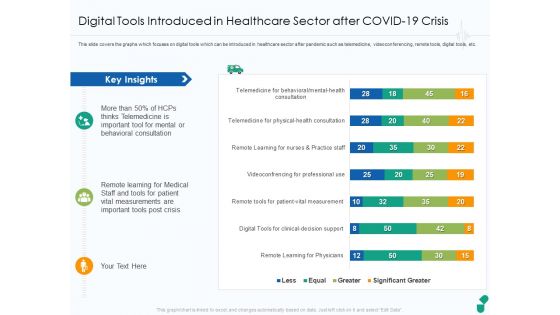
Digital Tools Introduced In Healthcare Sector After COVID 19 Crisis Ppt Outline Diagrams PDF
This slide covers the graphs which focuses on digital tools which can be introduced in healthcare sector after pandemic such as telemedicine, videoconferencing, remote tools, digital tools, etc. Deliver an awe-inspiring pitch with this creative digital tools introduced in healthcare sector after covid 19 crisis ppt outline diagrams pdf bundle. Topics like key insights, patient vital measurements, important tools post crisis, behavioral consultation can be discussed with this completely editable template. It is available for immediate download depending on the needs and requirements of the user.
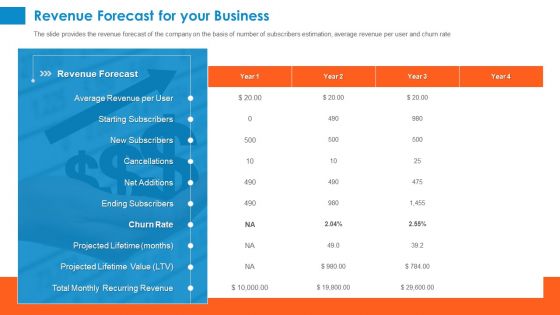
Raising Company Capital From Public Funding Sources Revenue Forecast For Your Business Diagrams PDF
The slide provides the revenue forecast of the company on the basis of number of subscribers estimation, average revenue per user and churn rate. Deliver an awe-inspiring pitch with this creative raising company capital from public funding sources revenue forecast for your business diagrams pdf bundle. Topics like revenue forecast, ending subscribers, starting subscribers, average revenue per user, projected lifetime, total monthly recurring revenue can be discussed with this completely editable template. It is available for immediate download depending on the needs and requirements of the user.
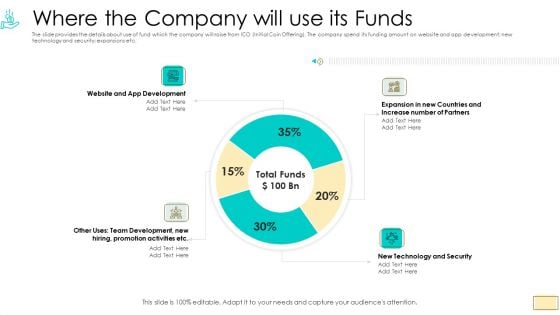
Investor Pitch Ppt For Crypto Funding Where The Company Will Use Its Funds Diagrams PDF
The slide provides the details about use of fund which the company will raise from ICO Initial Coin Offering. The company spend its funding amount on website and app development new technology and security expansions etc.Deliver an awe-inspiring pitch with this creative investor pitch ppt for crypto funding where the company will use its funds diagrams pdf. bundle. Topics like website and app development, new technology and security, expansion in new countries and increase number of partners can be discussed with this completely editable template. It is available for immediate download depending on the needs and requirements of the user.
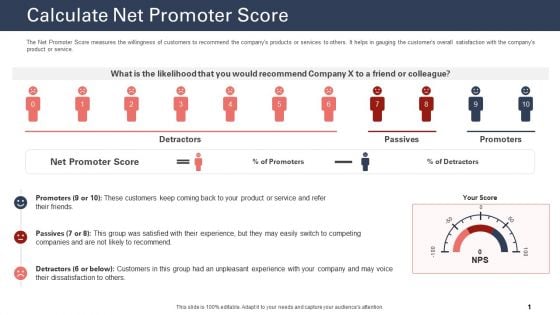
Techniques To Increase Customer Satisfaction Calculate Net Promoter Score Diagrams PDF
The Net Promoter Score measures the willingness of customers to recommend the companys products or services to others. It helps in gauging the customers overall satisfaction with the companys product or service. Deliver an awe inspiring pitch with this creative techniques to increase customer satisfaction calculate net promoter score diagrams pdf bundle. Topics like calculate net promoter score, product or service, net promoter score can be discussed with this completely editable template. It is available for immediate download depending on the needs and requirements of the user.
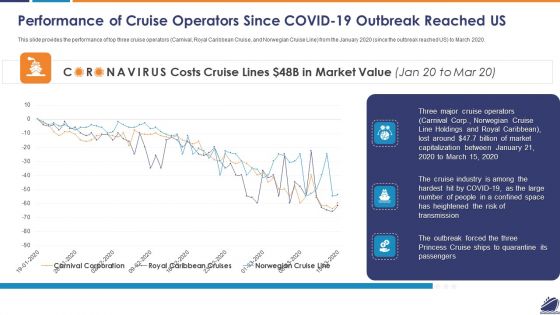
Performance Of Cruise Operators Since COVID 19 Outbreak Reached US Diagrams PDF
This slide provides the performance of top three cruise operators Carnival, Royal Caribbean Cruise, and Norwegian Cruise Line from the January 2020 since the outbreak reached US to March 2020. Deliver an awe inspiring pitch with this creative performance of cruise operators since covid 19 outbreak reached us diagrams pdf bundle. Topics like performance of cruise operators since covid 19 outbreak reached us can be discussed with this completely editable template. It is available for immediate download depending on the needs and requirements of the user.
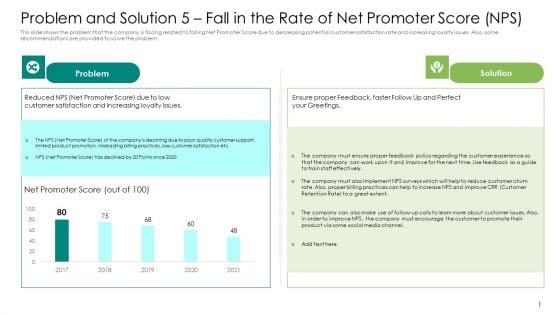
Problem And Solution 5 Fall In The Rate Of Net Promoter Score NPS Diagrams PDF
This slide shows the problem that the company is facing related to falling Net Promoter Score due to decreasing potential customer satisfaction rate and increasing loyalty issues. Also, some recommendations are provided to solve the problem. Deliver an awe-inspiring pitch with this creative problem and solution 5 fall in the rate of net promoter score nps diagrams pdf. bundle. Topics like net promoter score, 2017 to 2021 can be discussed with this completely editable template. It is available for immediate download depending on the needs and requirements of the user.
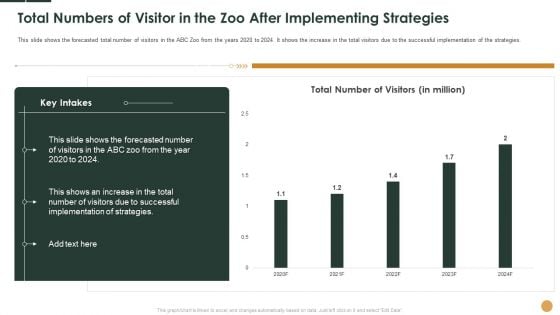
Total Numbers Of Visitor In The Zoo After Implementing Strategies Ppt Summary Diagrams PDF
This slide shows the forecasted total number of visitors in the ABC Zoo from the years 2020 to 2024. It shows the increase in the total visitors due to the successful implementation of the strategies.Deliver an awe-inspiring pitch with this creative total numbers of visitor in the zoo after implementing strategies ppt summary diagrams pdf. bundle. Topics like total number of visitors, 2020 to 2024 can be discussed with this completely editable template. It is available for immediate download depending on the needs and requirements of the user.
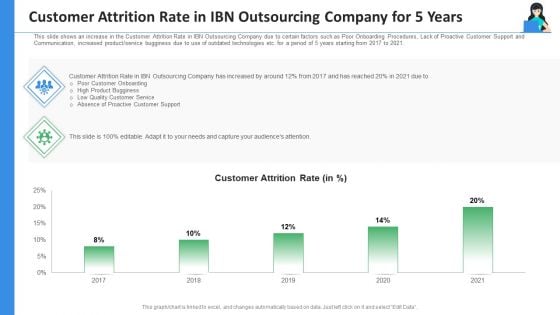
Customer Attrition Rate In IBN Outsourcing Company For 5 Years Ppt Styles Diagrams PDF
This slide shows an increase in the Customer Attrition Rate in IBN Outsourcing Company due to certain factors such as Poor Onboarding Procedures, Lack of Proactive Customer Support and Communication, increased product service bugginess due to use of outdated technologies etc. for a period of 5 years starting from 2017 to 2021. Deliver an awe inspiring pitch with this creative customer attrition rate in IBN outsourcing company for 5 years ppt styles diagrams pdf bundle. Topics like product bugginess, quality customer service, absence of proactive customer support, 2017 to 2021 can be discussed with this completely editable template. It is available for immediate download depending on the needs and requirements of the user.
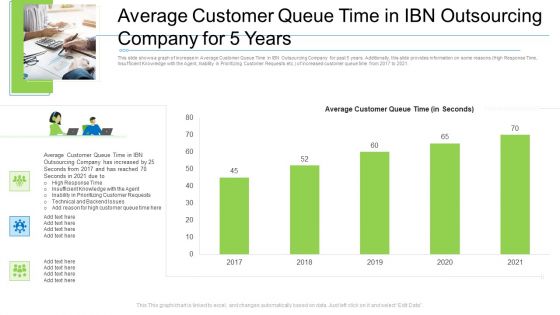
Average Customer Queue Time In Ibn Outsourcing Company For 5 Years Diagrams PDF
This slide shows a graph of increase in Average Customer Queue Time in IBN Outsourcing Company for past 5 years. Additionally, this slide provides information on some reasons High Response Time, Insufficient Knowledge with the Agent, Inability in Prioritizing Customer Requests etc. of increased customer queue time from 2017 to 2021. Deliver an awe-inspiring pitch with this creative average customer queue time in ibn outsourcing company for 5 years diagrams pdf. bundle. Topics like average customer queue time in ibn outsourcing company for 5 years can be discussed with this completely editable template. It is available for immediate download depending on the needs and requirements of the user.
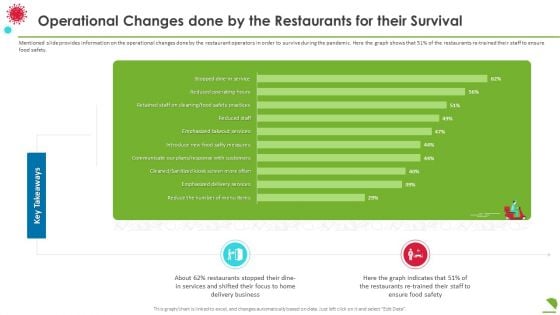
Operational Changes Done By The Restaurants For Their Survival Diagrams PDF
Mentioned slide provides information on the operational changes done by the restaurant operators in order to survive during the pandemic. Here the graph shows that 51 percentage of the restaurants re trained their staff to ensure food safety. Deliver an awe inspiring pitch with this creative operational changes done by the restaurants for their survival diagrams pdf bundle. Topics like business, services, key takeaways can be discussed with this completely editable template. It is available for immediate download depending on the needs and requirements of the user.
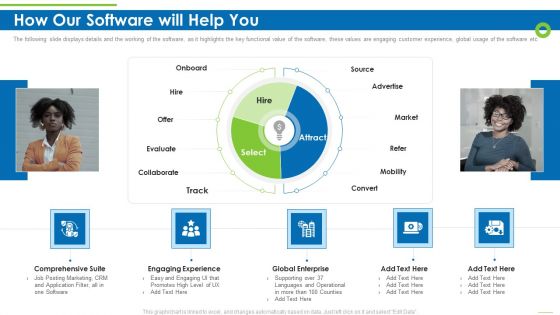
Enterprise Recruitment Industries Investor Fund Raising How Our Software Will Help You Diagrams PDF
The following slide displays details and the working of the software, as it highlights the key functional value of the software, these values are engaging customer experience, global usage of the software etc Deliver an awe inspiring pitch with this creative enterprise recruitment industries investor fund raising how our software will help you diagrams pdf bundle. Topics like comprehensive suite, engaging experience, global enterprise can be discussed with this completely editable template. It is available for immediate download depending on the needs and requirements of the user.
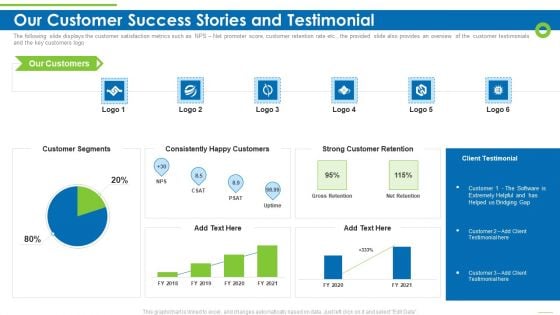
Enterprise Recruitment Industries Investor Fund Raising Our Customer Success Stories And Testimonial Diagrams PDF
The following slide displays the customer satisfaction metrics such as NPS Net promoter score, customer retention rate etc., the provided slide also provides an overview of the customer testimonials and the key customers logo Deliver an awe inspiring pitch with this creative enterprise recruitment industries investor fund raising our customer success stories and testimonial diagrams pdf bundle. Topics like customer segments, consistently happy customers, strong customer retention can be discussed with this completely editable template. It is available for immediate download depending on the needs and requirements of the user.
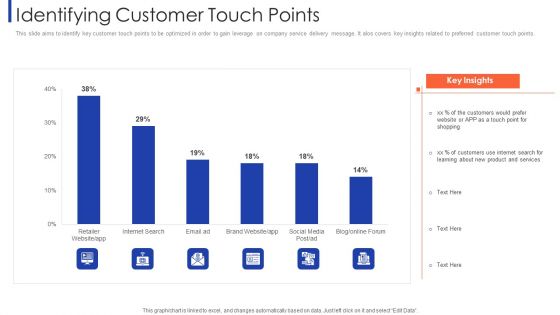
Customer Relationship Strategy For Building Loyalty Identifying Customer Touch Points Diagrams PDF
This slide aims to identify key customer touch points to be optimized in order to gain leverage on company service delivery message. It alos covers key insights related to preferred customer touch points. Deliver an awe inspiring pitch with this creative customer relationship strategy for building loyalty identifying customer touch points diagrams pdf bundle. Topics like retailer website, internet search, brand website, social media can be discussed with this completely editable template. It is available for immediate download depending on the needs and requirements of the user.
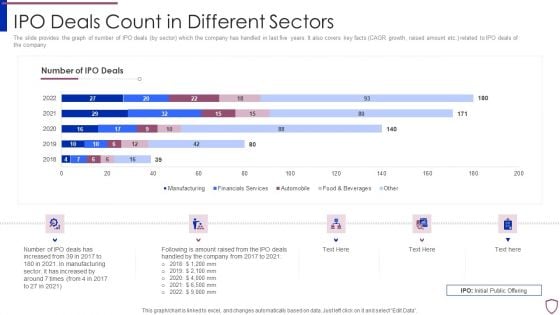
Financing Catalogue For Security Underwriting Agreement IPO Deals Count In Different Sectors Diagrams PDF
The slide provides the graph of number of IPO deals by sector which the company has handled in last five years. It also covers key facts CAGR growth, raised amount etc. related to IPO deals of the company. Deliver an awe inspiring pitch with this creative financing catalogue for security underwriting agreement ipo deals count in different sectors diagrams pdf bundle. Topics like manufacturing, financial services, automobile, food and beverages can be discussed with this completely editable template. It is available for immediate download depending on the needs and requirements of the user.
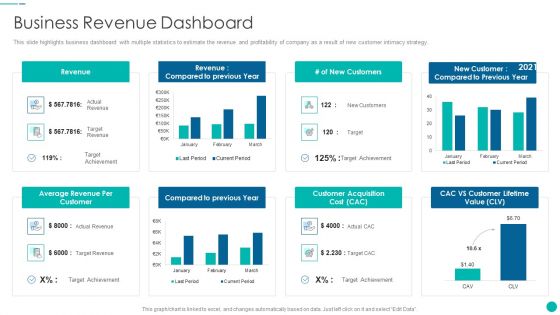
Tactical Procedure For Increasing Customer Intimacy Business Revenue Dashboard Diagrams PDF
This slide highlights business dashboard with multiple statistics to estimate the revenue and profitability of company as a result of new customer intimacy strategy. Deliver an awe inspiring pitch with this creative tactical procedure for increasing customer intimacy business revenue dashboard diagrams pdf bundle. Topics like average revenue per customer, compared to previous year, customer acquisition cost, cac vs customer lifetime value, revenue can be discussed with this completely editable template. It is available for immediate download depending on the needs and requirements of the user.
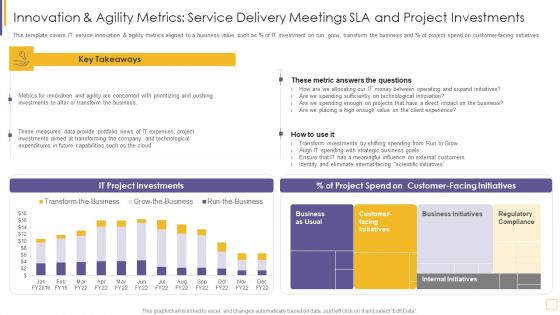
Guidelines For Exhibiting Business Value Of Information And Technology Innovation And Agility Metrics Diagrams PDF
This template covers IT service innovation and agility metrics aligned to a business value such as percentage of IT investment on run, grow, transform the business and percentage of project spend on customer facing initiatives. Deliver an awe inspiring pitch with this creative guidelines for exhibiting business value of information and technology innovation and agility metrics diagrams pdf bundle. Topics like measures, investments, expenses, technological, capabilities can be discussed with this completely editable template. It is available for immediate download depending on the needs and requirements of the user.
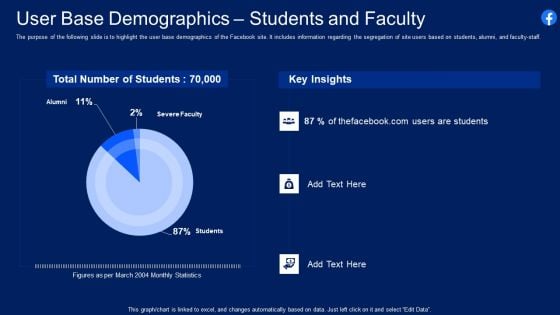
Facebook Original Capital Funding User Base Demographics Students And Faculty Diagrams PDF
The purpose of the following slide is to highlight the user base demographics of the Facebook site. It includes information regarding the segregation of site users based on students, alumni, and faculty staff. Deliver an awe inspiring pitch with this creative facebook original capital funding user base demographics students and faculty diagrams pdf bundle. Topics like user base demographics students and faculty can be discussed with this completely editable template. It is available for immediate download depending on the needs and requirements of the user.
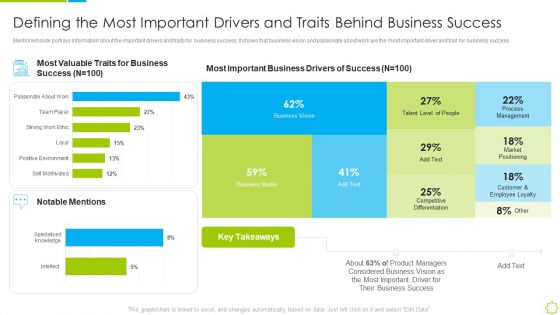
Launch New Sales Enablement Program Lead Generation Defining The Most Important Drivers Diagrams PDF
Mentioned slide portrays information about the important drivers and traits for business success. It shows that business vision and passionate about work are the most important driver and trait for business success. Deliver an awe inspiring pitch with this creative launch new sales enablement program lead generation defining the most important drivers diagrams pdf bundle. Topics like defining the most important drivers and traits behind business success can be discussed with this completely editable template. It is available for immediate download depending on the needs and requirements of the user.
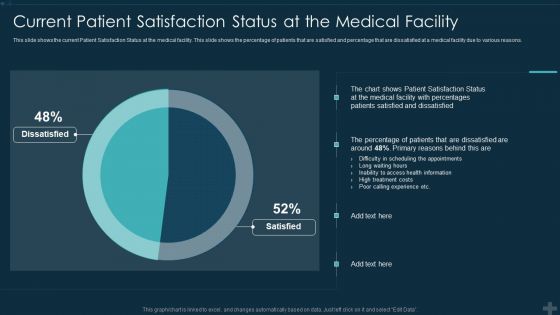
Application Patient Satisfaction Tactics Enhance Clinical Results Current Patient Satisfaction Status Diagrams PDF
This slide shows the current Patient Satisfaction Status at the medical facility. This slide shows the percentage of patients that are satisfied and percentage that are dissatisfied at a medical facility due to various reasons. Deliver an awe inspiring pitch with this creative application patient satisfaction tactics enhance clinical results current patient satisfaction status diagrams pdf bundle. Topics like current patient satisfaction status at the medical facility can be discussed with this completely editable template. It is available for immediate download depending on the needs and requirements of the user.
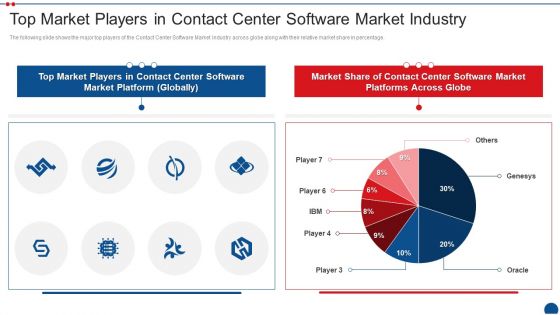
Call Center Application Market Industry Top Market Players In Contact Center Software Market Industry Diagrams PDF
The following slide shows the major top players of the Contact Center Software Market Industry across globe along with their relative market share in percentage. Deliver an awe inspiring pitch with this creative call center application market industry top market players in contact center software market industry diagrams pdf bundle. Topics like top market players in contact center software market industry can be discussed with this completely editable template. It is available for immediate download depending on the needs and requirements of the user.
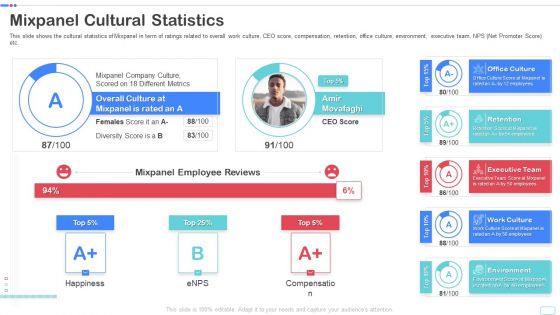
Mixpanel Capital Raising Pitch Deck Mixpanel Cultural Statistics Topics PDF Diagrams PDF
This slide shows the cultural statistics of Mixpanel in term of ratings related to overall work culture, CEO score, compensation, retention, office culture, environment, executive team, NPS Net Promoter Score etc. Deliver an awe inspiring pitch with this creative mixpanel capital raising pitch deck mixpanel cultural statistics topics pdf diagrams pdf bundle. Topics like office culture, retention, executive team, work culture, environment can be discussed with this completely editable template. It is available for immediate download depending on the needs and requirements of the user.
Retail Trading Platform Dashboard Tracking Essential Kpis For Ecommerce Performance Diagrams PDF
This slide provides information regarding essential KPIs for ecommerce performance dashboard tracking average bounce rate, new vs. old customers, channel revenue vs. channel acquisitions costs, channel revenue vs. sales, average conversion rate, etc. Deliver an awe inspiring pitch with this creative retail trading platform dashboard tracking essential kpis for ecommerce performance diagrams pdf bundle. Topics like average bounce rate, average conversion rate, bounce rate, channel revenue sales can be discussed with this completely editable template. It is available for immediate download depending on the needs and requirements of the user.
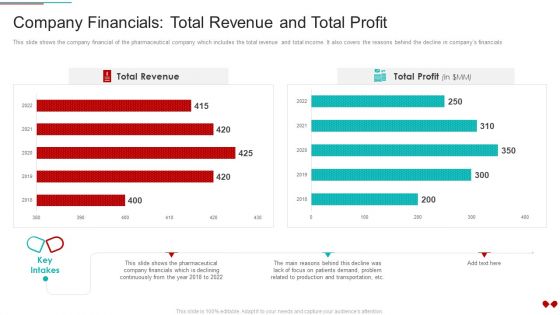
Environmental Impact Analysis For A Pharmaceutical Company Financials Total Revenue And Total Profit Diagrams PDF
This slide shows the company financial of the pharmaceutical company which includes the total revenue and total income. It also covers the reasons behind the decline in companys financialsDeliver an awe inspiring pitch with this creative Environmental Impact Analysis For A Pharmaceutical Company Financials Total Revenue And Total Profit Diagrams PDF bundle. Topics like Company Financials Total Revenue And Total Profit can be discussed with this completely editable template. It is available for immediate download depending on the needs and requirements of the user.
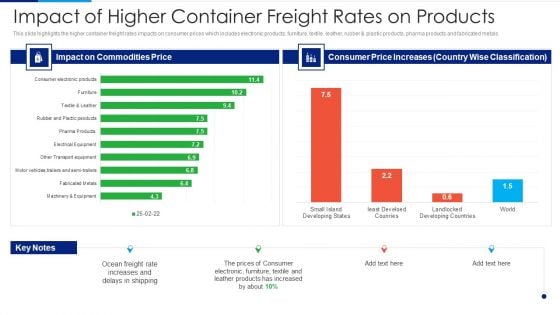
Russia Ukraine Conflict Effect Impact Of Higher Container Freight Rates On Products Diagrams PDF
This slide highlights the higher container freight rates impacts on consumer prices which includes electronic products, furniture, textile, leather, rubber and plastic products, pharma products and fabricated metals. Deliver an awe inspiring pitch with this creative Russia Ukraine Conflict Effect Impact Of Higher Container Freight Rates On Products Diagrams PDF bundle. Topics like Impact On Commodities Price, Consumer Price Increases, Ocean Freight Rate, Prices Of Consumer can be discussed with this completely editable template. It is available for immediate download depending on the needs and requirements of the user.
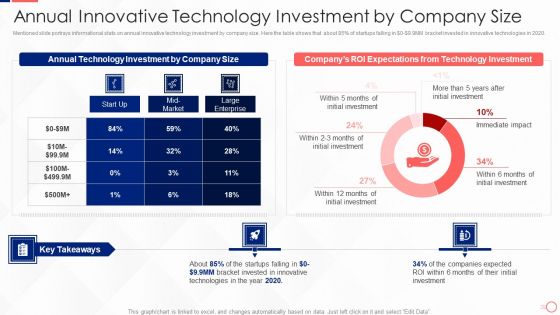
Investing In Tech Innovation Annual Innovative Technology Investment By Company Size Diagrams PDF
Mentioned slide portrays informational stats on annual innovative technology investment by company size. Here the table shows that about 85 percent of startups falling in Dollar 0- Dollar 9.9MM bracket invested in innovative technologies in 2020. Deliver an awe inspiring pitch with this creative Investing In Tech Innovation Annual Innovative Technology Investment By Company Size Diagrams PDF bundle. Topics like Annual Technology Investment, Company Size, ROI Expectations Technology, Initial Investment can be discussed with this completely editable template. It is available for immediate download depending on the needs and requirements of the user.
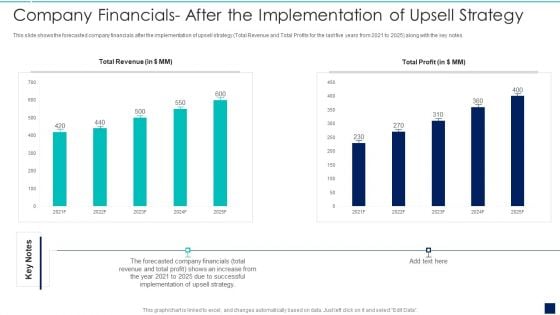
Influence Buyers To Purchase Additional High Company Financials After The Implementation Diagrams PDF
This slide shows the forecasted company financials after the implementation of upsell strategy total Revenue and Total Profits for the last five years from 2021 to 2025 along with the key notes.Deliver an awe inspiring pitch with this creative Influence Buyers To Purchase Additional High Company Financials After The Implementation Diagrams PDF bundle. Topics like Company Financials After The Implementation Of Upsell Strategy can be discussed with this completely editable template. It is available for immediate download depending on the needs and requirements of the user.
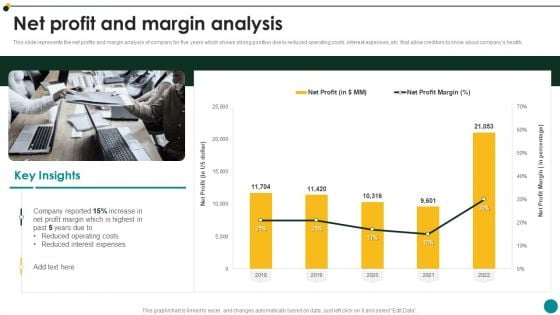
IT Services And Consulting Company Profile Net Profit And Margin Analysis Diagrams PDF
This slide represents the net profits and margin analysis of company for five years which shows strong position due to reduced operating costs, interest expenses, etc. that allow creditors to know about companys health.Deliver an awe inspiring pitch with this creative IT Services And Consulting Company Profile Net Profit And Margin Analysis Diagrams PDF bundle. Topics like Reduced Expenses, Reduced Operating Costs, Profit Highest can be discussed with this completely editable template. It is available for immediate download depending on the needs and requirements of the user.
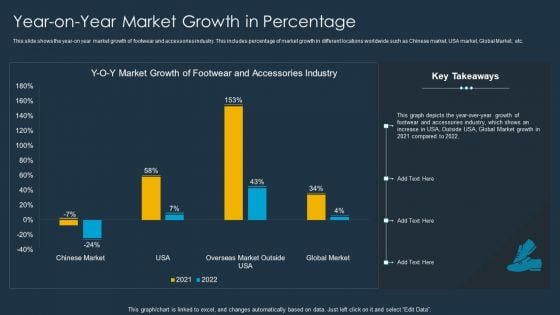
Shoe Firm Investor Pitch Deck Year On Year Market Growth In Percentage Diagrams PDF
This slide shows the year-on year market growth of footwear and accessories industry. This includes percentage of market growth in different locations worldwide such as Chinese market, USA market, Global Market, etc. Deliver an awe inspiring pitch with this creative Shoe Firm Investor Pitch Deck Year On Year Market Growth In Percentage Diagrams PDF bundle. Topics like Market Growth, Accessories Industry, Global Merket can be discussed with this completely editable template. It is available for immediate download depending on the needs and requirements of the user.
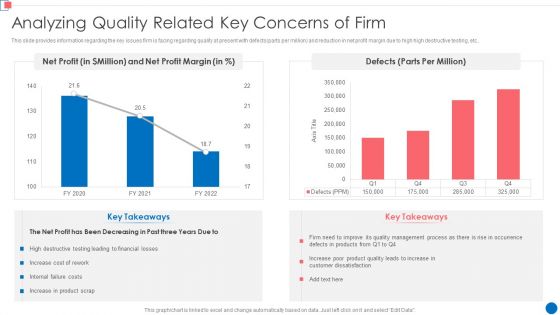
Optimize Enterprise Core Analyzing Quality Related Key Concerns Of Firm Diagrams PDF
This slide provides information regarding the key issues firm is facing regarding quality at present with defects parts per million and reduction in net profit margin due to high high destructive testing, etc. Deliver an awe inspiring pitch with this creative Optimize Enterprise Core Analyzing Quality Related Key Concerns Of Firm Diagrams PDF bundle. Topics like Net Profit, Net Profit Margin, 2020 To 2022 can be discussed with this completely editable template. It is available for immediate download depending on the needs and requirements of the user.
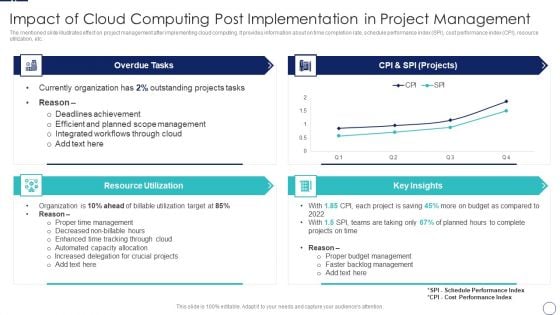
How To Implement Cloud Collaboration Impact Of Cloud Computing Post Implementation Diagrams PDF
The mentioned slide illustrates effect on project management after implementing cloud computing. It provides information about on time completion rate, schedule performance index SPI, cost performance index CPI, resource utilization, etc. Deliver an awe inspiring pitch with this creative How To Implement Cloud Collaboration Impact Of Cloud Computing Post Implementation Diagrams PDF bundle. Topics like Overdue Tasks, Resource Utilization, CPI And SPI can be discussed with this completely editable template. It is available for immediate download depending on the needs and requirements of the user.
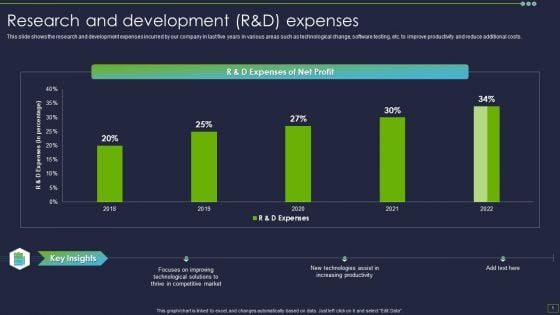
IT Consultancy Services Company Profile Research And Development Randd Expenses Diagrams PDF
This slide shows the research and development expenses incurred by our company in last five years in various areas such as technological change, software testing, etc. to improve productivity and reduce additional costs.Deliver an awe inspiring pitch with this creative IT Consultancy Services Company Profile Research And Development Randd Expenses Diagrams PDF bundle. Topics like Focuses Improving, Technological Solutions, Competitive Market can be discussed with this completely editable template. It is available for immediate download depending on the needs and requirements of the user.
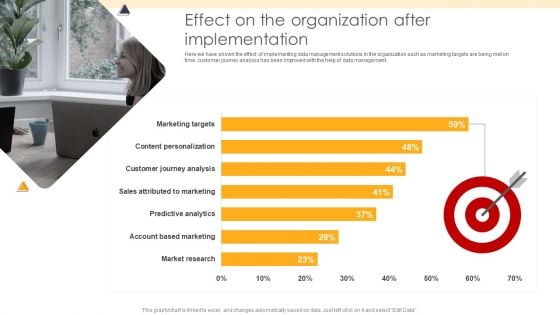
ETL Repository Effect On The Organization After Implementation Ppt PowerPoint Presentation Portfolio Diagrams PDF
Here we have shown the effect of implementing data management solutions in the organization such as marketing targets are being met on time, customer journey analysis has been improved with the help of data management. Deliver an awe inspiring pitch with this creative ETL Repository Effect On The Organization After Implementation Ppt PowerPoint Presentation Portfolio Diagrams PDF bundle. Topics like Market Research, Account Based, Sales Attributed can be discussed with this completely editable template. It is available for immediate download depending on the needs and requirements of the user.
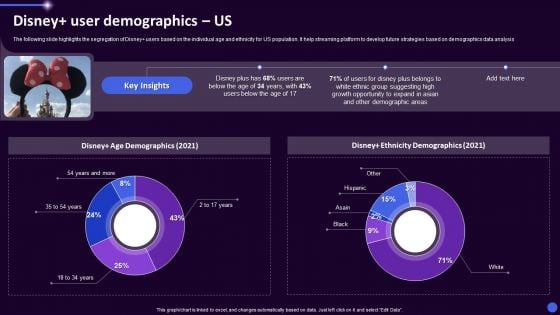
Disney Plus OTT Platform Company Summary Disney User Demographics Us Ppt Gallery Diagrams PDF
The following slide highlights the segregation of Disney users based on the individual age and ethnicity for US population. It help streaming platform to develop future strategies based on demographics data analysis. Deliver an awe inspiring pitch with this creative Disney Plus OTT Platform Company Summary Disney User Demographics Us Ppt Gallery Diagrams PDF bundle. Topics like Disney Ethnicity Demographics, Disney Age Demographics, 2021 can be discussed with this completely editable template. It is available for immediate download depending on the needs and requirements of the user.
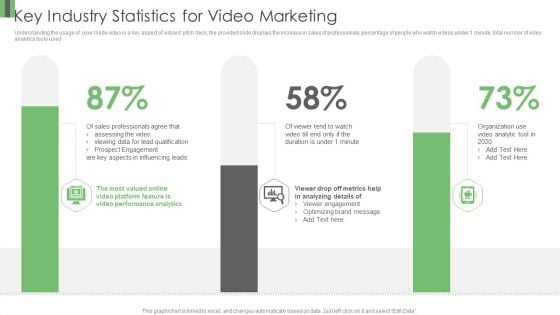
Vidyard Elevator Funding Key Industry Statistics For Video Marketing Ppt Show Diagrams PDF
Understanding the usage of user made video is a key aspect of vidyard pitch deck, the provided slide displays the increase in sales of professionals, percentage of people who watch videos under 1 minute, total number of video analytics tools used . Deliver an awe inspiring pitch with this creative Vidyard Elevator Funding Key Industry Statistics For Video Marketing Ppt Show Diagrams PDF bundle. Topics like Sales Professionals Agree, Prospect Engagement, Valued Online can be discussed with this completely editable template. It is available for immediate download depending on the needs and requirements of the user.
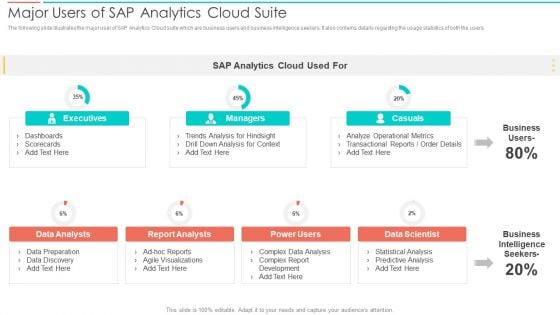
SAC Planning And Implementation Major Users Of SAP Analytics Cloud Suite Diagrams PDF
The following slide illustrates the major user of SAP Analytics Cloud suite which are business users and business intelligence seekers. It also contains details regarding the usage statistics of both the users. Deliver an awe inspiring pitch with this creative SAC Planning And Implementation Major Users Of SAP Analytics Cloud Suite Diagrams PDF bundle. Topics like Executives, Casuals, Business Intelligence Seekers, Data Scientist can be discussed with this completely editable template. It is available for immediate download depending on the needs and requirements of the user.
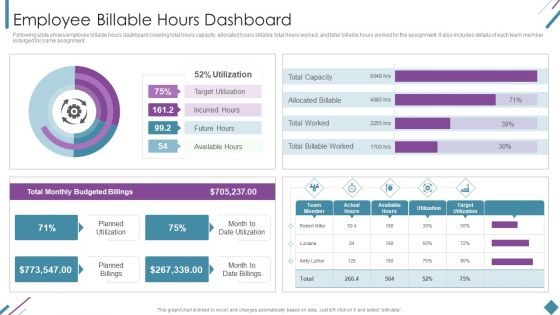
Metrics To Measure Business Performance Employee Billable Hours Dashboard Diagrams PDF
Following slide shows employee billable hours dashboard covering total hours capacity, allocated hours billable, total hours worked, and total billable hours worked for the assignment. It also includes details of each team member indulged for same assignment. Deliver an awe inspiring pitch with this creative Metrics To Measure Business Performance Employee Billable Hours Dashboard Diagrams PDF bundle. Topics like Total Monthly, Budgeted Billings, Planned Utilization can be discussed with this completely editable template. It is available for immediate download depending on the needs and requirements of the user.
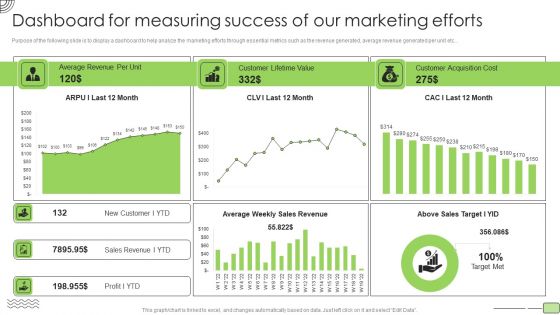
Organic Business Growth Strategies Dashboard For Measuring Success Of Our Marketing Efforts Diagrams PDF
Purpose of the following slide is to display a dashboard to help analyze the marketing efforts through essential metrics such as the revenue generated, average revenue generated per unit etc. Deliver an awe inspiring pitch with this creative Organic Business Growth Strategies Dashboard For Measuring Success Of Our Marketing Efforts Diagrams PDF bundle. Topics like Average Revenue, Customer Lifetime Value, Customer Acquisition Cost can be discussed with this completely editable template. It is available for immediate download depending on the needs and requirements of the user.
Precooked Food Industry Analysis KPI Dashboard For Tracking Supply Chain Costs Diagrams PDF
This slide represents the KPI dashboard to track the multiple cost associated with supply chain in food manufacturing industry. It includes information regarding cash to cash cycle in days, carry cost of inventory along with details of net sales.Deliver an awe inspiring pitch with this creative Precooked Food Industry Analysis KPI Dashboard For Tracking Supply Chain Costs Diagrams PDF bundle. Topics like Processing Industry, Food Processing, Manufacturing Industry can be discussed with this completely editable template. It is available for immediate download depending on the needs and requirements of the user.
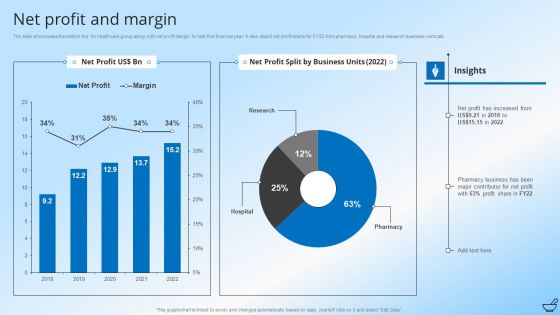
Pharmaceutical And Clinical Research Summary Net Profit And Margin Diagrams PDF
The slide showcases the bottom line for healthcare group along with net profit margin for last five financial year. It also depict net profit share for FY22 from pharmacy, hospital and research business verticals. Deliver an awe inspiring pitch with this creative Pharmaceutical And Clinical Research Summary Net Profit And Margin Diagrams PDF bundle. Topics like Pharmacy Business, Profit Share, Business Units can be discussed with this completely editable template. It is available for immediate download depending on the needs and requirements of the user.
Business Process Mapping Levels One To Five Ppt PowerPoint Presentation Icon Diagrams
This is a business process mapping levels one to five ppt powerpoint presentation icon diagrams. This is a five stage process. The stages in this process are process management, end to end process, e2e process.
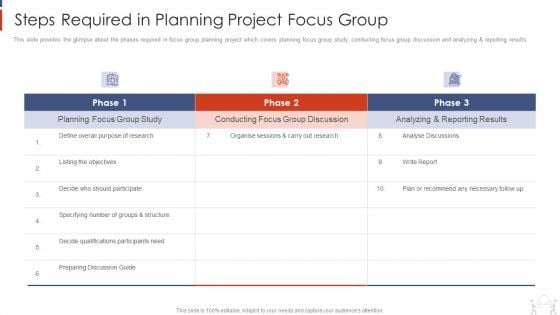
Project Management Modelling Techniques IT Steps Required In Planning Project Focus Group Diagrams PDF
This slide provides the glimpse about the phases required in focus group planning project which covers planning focus group study, conducting focus group discussion and analyzing and reporting results. Deliver an awe inspiring pitch with this creative project management modelling techniques it steps required in planning project focus group diagrams pdf bundle. Topics like planning focus group study, conducting focus group discussion, analyzing and reporting results can be discussed with this completely editable template. It is available for immediate download depending on the needs and requirements of the user.
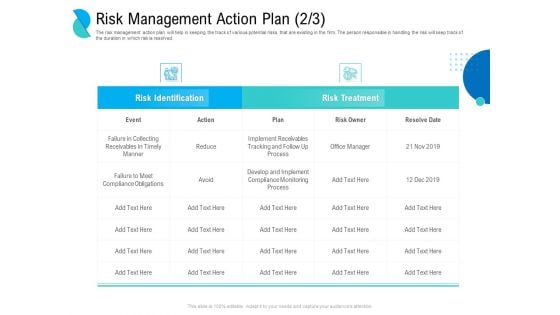
Determining Crisis Management BCP Risk Management Action Plan Event Ppt PowerPoint Presentation Portfolio Diagrams PDF
The risk management action plan will help in keeping the track of various potential risks that are existing in the firm. The person responsible in handling the risk will keep track of the duration in which risk is resolved. Deliver and pitch your topic in the best possible manner with thisdetermining crisis management bcp risk management action plan event ppt powerpoint presentation portfolio diagrams pdf. Use them to share invaluable insights onevent, reduce, failure in collecting receivables in timely manner, failure to meet compliance obligations, develop and implement compliance monitoring process. and impress your audience. This template can be altered and modified as per your expectations. So, grab it now.
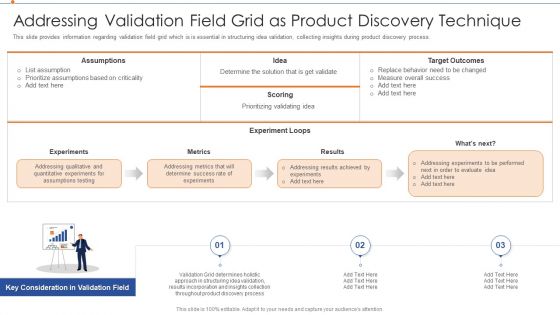
Strategies For Improving Product Discovery Addressing Validation Field Grid As Product Discovery Technique Diagrams PDF
This slide provides information regarding validation field grid which is is essential in structuring idea validation, collecting insights during product discovery process. This is a strategies for improving product discovery addressing validation field grid as product discovery technique diagrams pdf template with various stages. Focus and dispense information on three stages using this creative set, that comes with editable features. It contains large content boxes to add your information on topics like experiments, metrics, results, target outcomes, scoring, idea. You can also showcase facts, figures, and other relevant content using this PPT layout. Grab it now.
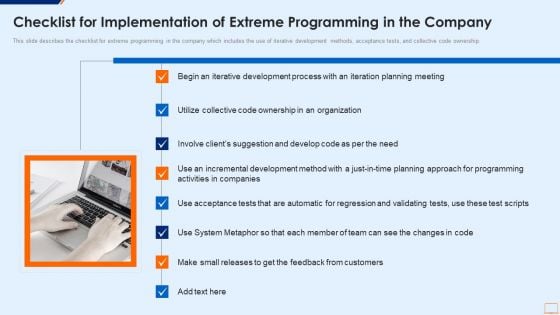
Extreme Programming Methodology IT Checklist For Implementation Of Extreme Diagrams PDF
This slide describes the checklist for extreme programming in the company which includes the use of iterative development methods, acceptance tests, and collective code ownership.This is a extreme programming methodology it checklist for implementation of extreme diagrams pdf template with various stages. Focus and dispense information on one stage using this creative set, that comes with editable features. It contains large content boxes to add your information on topics like requirements of the project, discussing the project, iterations are decided You can also showcase facts, figures, and other relevant content using this PPT layout. Grab it now.
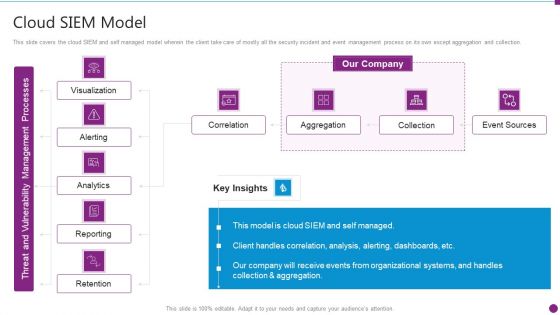
Security Information And Event Management Strategies For Financial Audit And Compliance Cloud SIEM Model Diagrams PDF
This slide covers the cloud SIEM and self managed model wherein the client take care of mostly all the security incident and event management process on its own except aggregation and collection. Deliver and pitch your topic in the best possible manner with this security information and event management strategies for financial audit and compliance cloud siem model diagrams pdf. Use them to share invaluable insights on visualization, alerting, analytics, reporting, retention and impress your audience. This template can be altered and modified as per your expectations. So, grab it now.
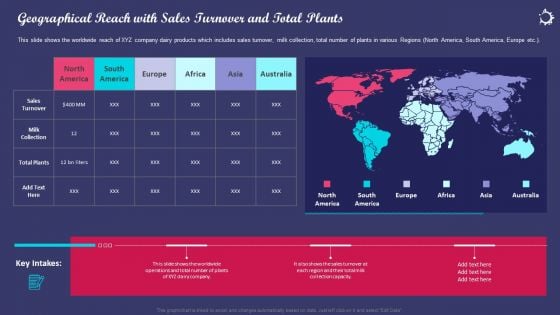
Enhancing Consumers Perception Towards Geographical Reach With Sales Turnover And Total Plants Diagrams PDF
This slide shows the worldwide reach of XYZ company dairy products which includes sales turnover, milk collection, total number of plants in various Regions North America, South America, Europe etc. Presenting enhancing consumers perception towards geographical reach with sales turnover and total plants diagrams pdf to provide visual cues and insights. Share and navigate important information on one stages that need your due attention. This template can be used to pitch topics like geographical reach with sales turnover and total plants. In addtion, this PPT design contains high resolution images, graphics, etc, that are easily editable and available for immediate download.
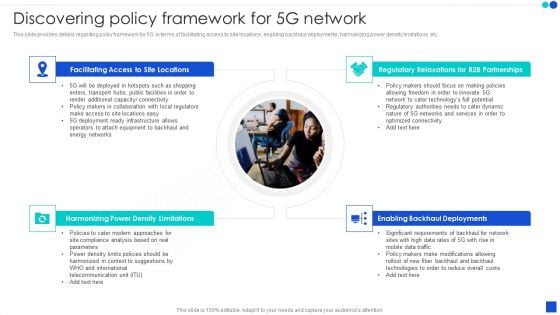
5G Technology Development For Digital Transformation Discovering Policy Framework For 5G Network Diagrams PDF
This slide provides details regarding policy framework for 5G in terms of facilitating access to site locations, enabling backhaul deployments, harmonizing power density limitations, etc. Slidegeeks is one of the best resources for PowerPoint templates. You can download easily and regulate 5G Technology Development For Digital Transformation Discovering Policy Framework For 5G Network Diagrams PDF for your personal presentations from our wonderful collection. A few clicks is all it takes to discover and get the most relevant and appropriate templates. Use our Templates to add a unique zing and appeal to your presentation and meetings. All the slides are easy to edit and you can use them even for advertisement purposes.
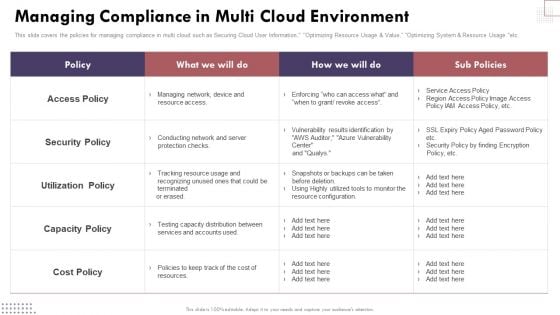
Managing Compliance In Multi Cloud Environment Cloud Computing Complexities And Solutions Diagrams PDF
This slide covers the policies for managing compliance in multi cloud such as Securing Cloud User Information, Optimizing Resource Usage Value, Optimizing System Resource Usage etc.Boost your pitch with our creative Managing Compliance In Multi Cloud Environment Cloud Computing Complexities And Solutions Diagrams PDF. Deliver an awe-inspiring pitch that will mesmerize everyone. Using these presentation templates you will surely catch everyones attention. You can browse the ppts collection on our website. We have researchers who are experts at creating the right content for the templates. So you do not have to invest time in any additional work. Just grab the template now and use them.
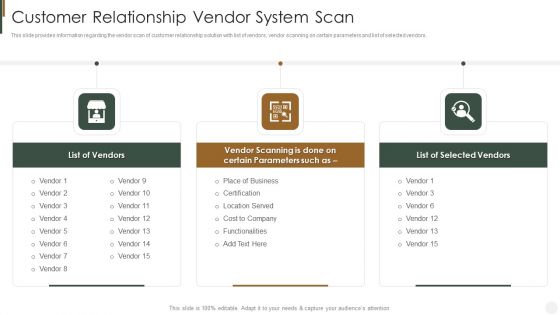
Customer Relationship Vendor System Scan Strategies To Improve Customer Diagrams PDF
This slide provides information regarding the vendor scan of customer relationship solution with list of vendors, vendor scanning on certain parameters and list of selected vendors. Slidegeeks is one of the best resources for PowerPoint templates. You can download easily and regulate Customer Relationship Vendor System Scan Strategies To Improve Customer Diagrams PDF for your personal presentations from our wonderful collection. A few clicks is all it takes to discover and get the most relevant and appropriate templates. Use our Templates to add a unique zing and appeal to your presentation and meetings. All the slides are easy to edit and you can use them even for advertisement purposes.


 Continue with Email

 Home
Home


