Stakeholder Icons
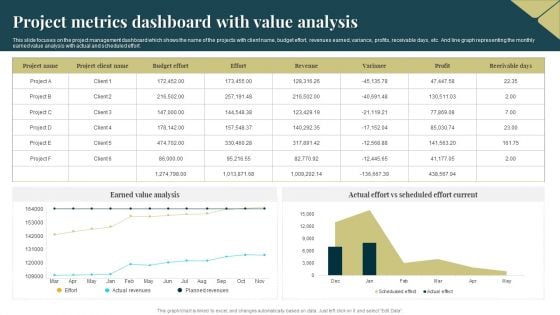
Project Metrics Dashboard With Value Analysis Introduction PDF
This slide focuses on the project management dashboard which shows the name of the projects with client name, budget effort, revenues earned, variance, profits, receivable days, etc. And line graph representing the monthly earned value analysis with actual and scheduled effort. Showcasing this set of slides titled Project Metrics Dashboard With Value Analysis Introduction PDF. The topics addressed in these templates are Budget Effort, Revenues, Earned Value Analysis. All the content presented in this PPT design is completely editable. Download it and make adjustments in color, background, font etc. as per your unique business setting.
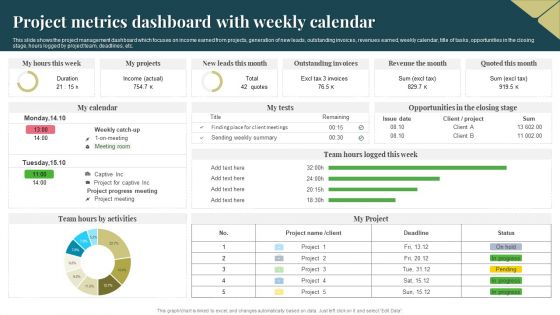
Project Metrics Dashboard With Weekly Calendar Download PDF
This slide shows the project management dashboard which focuses on income earned from projects, generation of new leads, outstanding invoices, revenues earned, weekly calendar, title of tasks, opportunities in the closing stage, hours logged by project team, deadlines, etc. Pitch your topic with ease and precision using this Project Metrics Dashboard With Weekly Calendar Download PDF. This layout presents information on Income, Revenue, Project. It is also available for immediate download and adjustment. So, changes can be made in the color, design, graphics or any other component to create a unique layout.
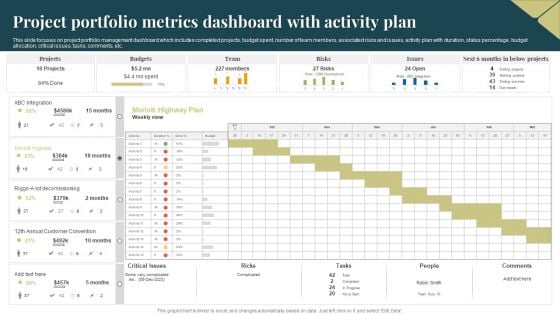
Project Portfolio Metrics Dashboard With Activity Plan Clipart PDF
This slide focuses on project portfolio management dashboard which includes completed projects, budget spent, number of team members, associated risks and issues, activity plan with duration, status percentage, budget allocation, critical issues, tasks, comments, etc. Pitch your topic with ease and precision using this Project Portfolio Metrics Dashboard With Activity Plan Clipart PDF. This layout presents information on Budgets, Team, Risks. It is also available for immediate download and adjustment. So, changes can be made in the color, design, graphics or any other component to create a unique layout.
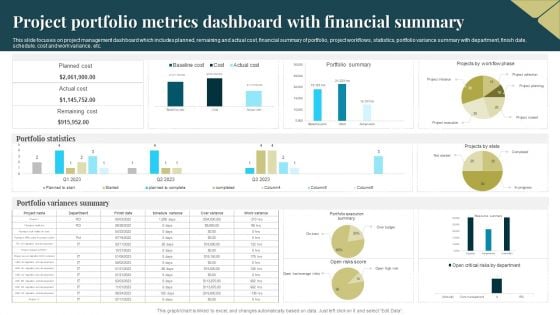
Project Portfolio Metrics Dashboard With Financial Summary Demonstration PDF
This slide focuses on project management dashboard which includes planned, remaining and actual cost, financial summary of portfolio, project workflows, statistics, portfolio variance summary with department, finish date, schedule, cost and work variance, etc. Showcasing this set of slides titled Project Portfolio Metrics Dashboard With Financial Summary Demonstration PDF. The topics addressed in these templates are Planned Cost, Portfolio Statistics, Portfolio Variances Summary. All the content presented in this PPT design is completely editable. Download it and make adjustments in color, background, font etc. as per your unique business setting.
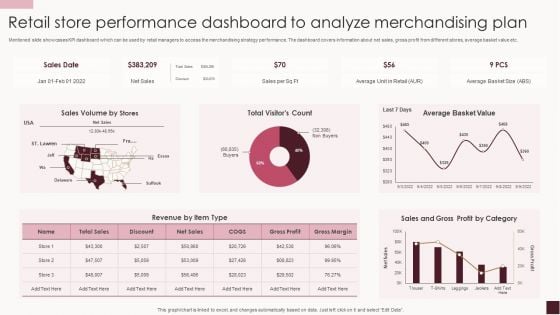
Retail Store Performance Dashboard To Analyze Merchandising Plan Structure PDF
Mentioned slide showcases KPI dashboard which can be used by retail managers to access the merchandising strategy performance. The dashboard covers information about net sales, gross profit from different stores, average basket value etc.Showcasing this set of slides titled Retail Store Performance Dashboard To Analyze Merchandising Plan Structure PDF. The topics addressed in these templates are Sales Volume, Average Basket, Gross Profit. All the content presented in this PPT design is completely editable. Download it and make adjustments in color, background, font etc. as per your unique business setting.
Weekly Customer Grievance Tracking Dashboard Designs PDF
This slide showcases dashboard that can help organization to identify the open and overdue status of customer grievance . It can guide managers to resolve the complaints and issues within stipulated time for customer satisfaction. Pitch your topic with ease and precision using this Weekly Customer Grievance Tracking Dashboard Designs PDF. This layout presents information on Average, Traffic Analysis, Customer Satisfaction Ratings. It is also available for immediate download and adjustment. So, changes can be made in the color, design, graphics or any other component to create a unique layout.
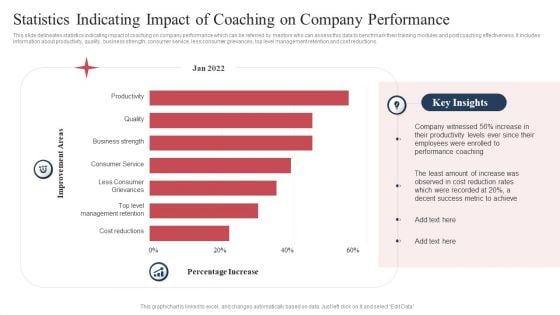
Statistics Indicating Impact Of Coaching On Company Performance Formats PDF
This slide delineates statistics indicating impact of coaching on company performance which can be referred by mentors who can assess this data to benchmark their training modules and post coaching effectiveness. It includes information about productivity, quality, business strength, consumer service, less consumer grievances, top level management retention and cost reductions. Pitch your topic with ease and precision using this Statistics Indicating Impact Of Coaching On Company Performance Formats PDF. This layout presents information on Productivity, Quality, Business Strength. It is also available for immediate download and adjustment. So, changes can be made in the color, design, graphics or any other component to create a unique layout.
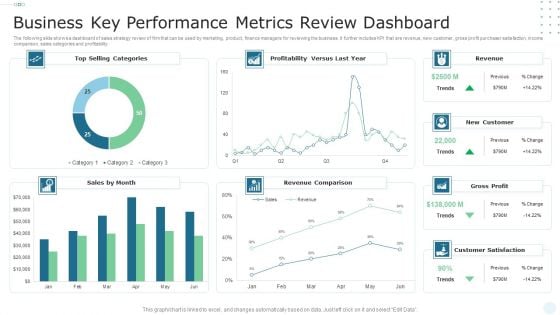
Business Key Performance Metrics Review Dashboard Portrait PDF
The following slide shows a dashboard of sales strategy review of firm that can be used by marketing, product, finance managers for reviewing the business. It further includes KPI that are revenue, new customer, gross profit purchaser satisfaction, income comparison, sales categories and profitability. Showcasing this set of slides titled Business Key Performance Metrics Review Dashboard Portrait PDF. The topics addressed in these templates are Sales, Revenue Comparison, Profitability. All the content presented in this PPT design is completely editable. Download it and make adjustments in color, background, font etc. as per your unique business setting.
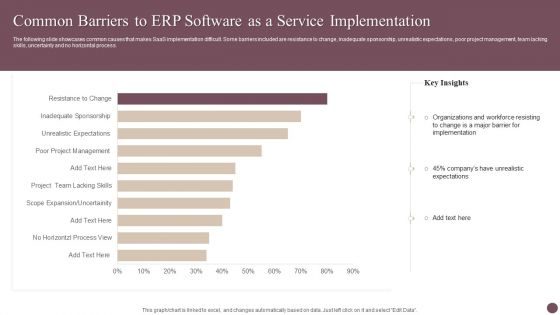
Common Barriers To ERP Software As A Service Implementation Sample PDF
The following slide showcases common causes that makes SaaS implementation difficult. Some barriers included are resistance to change, inadequate sponsorship, unrealistic expectations, poor project management, team lacking skills, uncertainty and no horizontal process. Showcasing this set of slides titled Common Barriers To ERP Software As A Service Implementation Sample PDF. The topics addressed in these templates are Scope Expansion, Uncertainity, Implementation, Workforce Resisting. All the content presented in this PPT design is completely editable. Download it and make adjustments in color, background, font etc. as per your unique business setting.
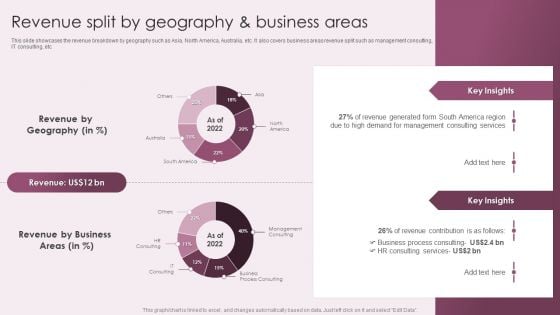
Business Advisory Solutions Company Profile Revenue Split By Geography And Business Areas Template PDF
This slide showcases the revenue breakdown by geography such as Asia, North America, Australia, etc. It also covers business areas revenue split such as management consulting, IT consulting, etc. Deliver an awe inspiring pitch with this creative Business Advisory Solutions Company Profile Revenue Split By Geography And Business Areas Template PDF bundle. Topics like Revenue Geography, Revenue Business Areas, Revenue Contribution can be discussed with this completely editable template. It is available for immediate download depending on the needs and requirements of the user.
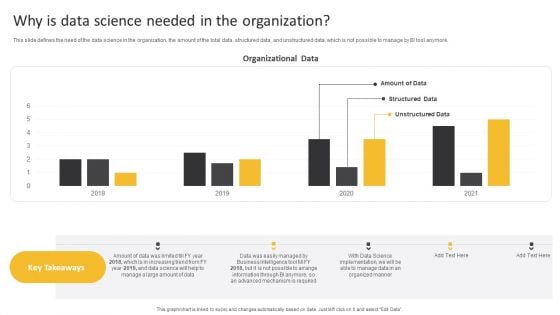
Information Science Why Is Data Science Needed In The Organization Ppt PowerPoint Presentation Slide Download PDF
This slide defines the need of the data science in the organization, the amount of the total data, structured data, and unstructured data, which is not possible to manage by BI tool anymore.Deliver an awe inspiring pitch with this creative Information Science Why Is Data Science Needed In The Organization Ppt PowerPoint Presentation Slide Download PDF bundle. Topics like Organized Manner, Advanced Mechanism, Information Through can be discussed with this completely editable template. It is available for immediate download depending on the needs and requirements of the user.
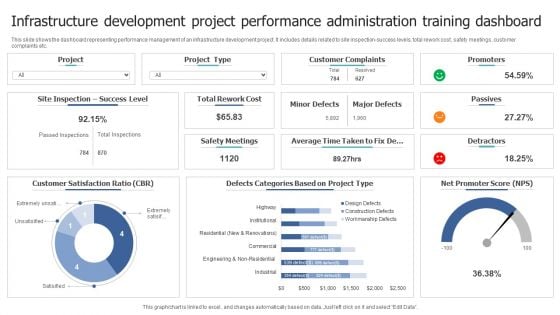
Infrastructure Development Project Performance Administration Training Dashboard Professional PDF
This slide shows the dashboard representing performance management of an infrastructure development project. It includes details related to site inspection success levels, total rework cost, safety meetings, customer complaints etc. Showcasing this set of slides titled Infrastructure Development Project Performance Administration Training Dashboard Professional PDF. The topics addressed in these templates are Customer Satisfaction Ratio, Customer Complaints, Rework Cost. All the content presented in this PPT design is completely editable. Download it and make adjustments in color, background, font etc. as per your unique business setting.
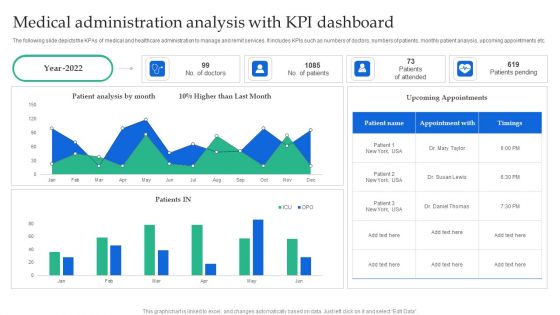
Medical Administration Analysis With KPI Dashboard Clipart PDF
The following slide depicts the KPAs of medical and healthcare administration to manage and remit services. It includes KPIs such as numbers of doctors, numbers of patients, monthly patient analysis, upcoming appointments etc. Showcasing this set of slides titled Medical Administration Analysis With KPI Dashboard Clipart PDF. The topics addressed in these templates are Patient Analysis, Higher Than, Upcoming Appointments. All the content presented in this PPT design is completely editable. Download it and make adjustments in color, background, font etc. as per your unique business setting.
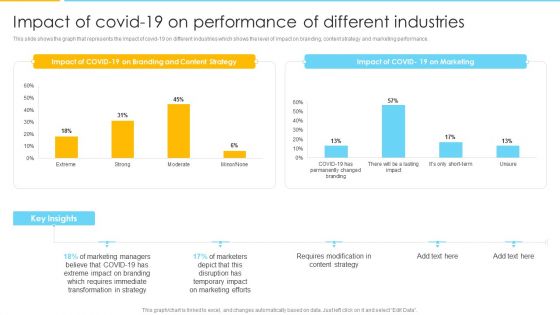
Optimizing Ecommerce Marketing Plan To Improve Sales Impact Of Covid 19 On Performance Of Different Industries Formats PDF
This slide shows the graph that represents the impact of covid 19 on different industries which shows the level of impact on branding, content strategy and marketing performance. Deliver an awe inspiring pitch with this creative Optimizing Ecommerce Marketing Plan To Improve Sales Impact Of Covid 19 On Performance Of Different Industries Formats PDF bundle. Topics like Transformation In Strategy, Marketing Managers, Content Strategy can be discussed with this completely editable template. It is available for immediate download depending on the needs and requirements of the user.
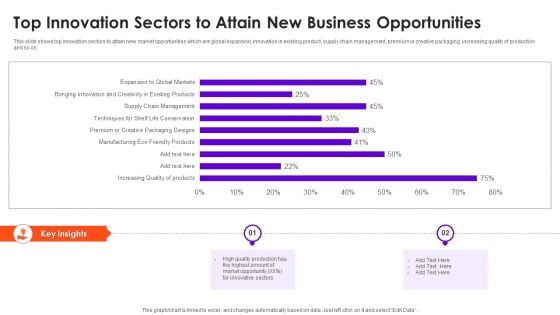
Top Innovation Sectors To Attain New Business Opportunities Information PDF
This slide shows top innovation sectors to attain new market opportunities which are global expansion, innovation in existing product, supply chain management, premium or creative packaging, increasing quality of production and so on. Showcasing this set of slides titled Top Innovation Sectors To Attain New Business Opportunities Information PDF. The topics addressed in these templates are Market Opportunity, Quality Production, Innovative Sectors. All the content presented in this PPT design is completely editable. Download it and make adjustments in color, background, font etc. as per your unique business setting.
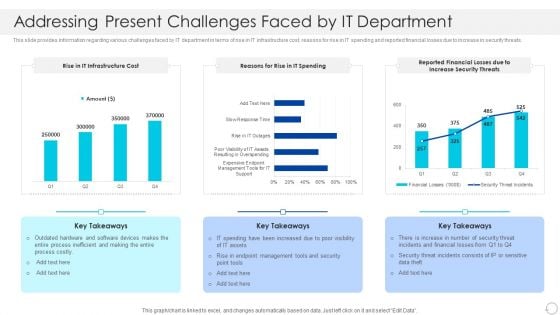
Addressing Present Challenges Faced By IT Department Download PDF
This slide provides information regarding various challenges faced by IT department in terms of rise in IT infrastructure cost, reasons for rise in IT spending and reported financial losses due to increase in security threats. Deliver and pitch your topic in the best possible manner with this Addressing Present Challenges Faced By IT Department Download PDF. Use them to share invaluable insights on Management Tools, Financial, Security and impress your audience. This template can be altered and modified as per your expectations. So, grab it now.
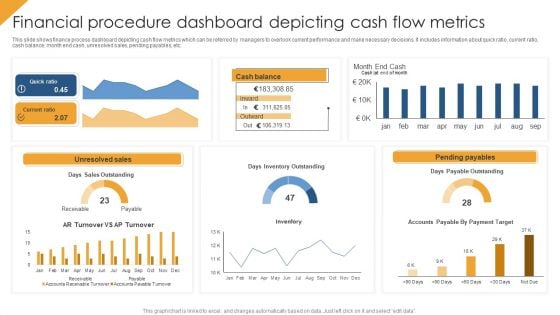
Financial Procedure Dashboard Depicting Cash Flow Metrics Structure PDF
This slide shows finance process dashboard depicting cash flow metrics which can be referred by managers to overlook current performance and make necessary decisions. It includes information about quick ratio, current ratio, cash balance, month end cash, unresolved sales, pending payables, etc. Pitch your topic with ease and precision using this Financial Procedure Dashboard Depicting Cash Flow Metrics Structure PDF. This layout presents information on Quick Ratio, Unresolved Sales, Pending Payables. It is also available for immediate download and adjustment. So, changes can be made in the color, design, graphics or any other component to create a unique layout.
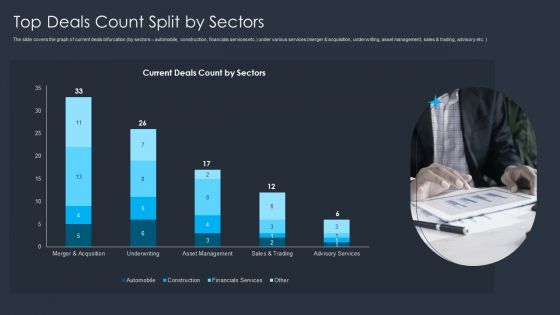
Merger And Acquisition Buying Strategy For Business Growth Top Deals Count Split By Sectors Clipart PDF
The slide covers the graph of current deals bifurcation by sectors automobile, construction, financials services etc. under various services merger and acquisition, underwriting, asset management, sales and trading, advisory etc. Deliver an awe inspiring pitch with this creative Merger And Acquisition Buying Strategy For Business Growth Top Deals Count Split By Sectors Clipart PDF bundle. Topics like Sales, Financials Service, Construction can be discussed with this completely editable template. It is available for immediate download depending on the needs and requirements of the user.
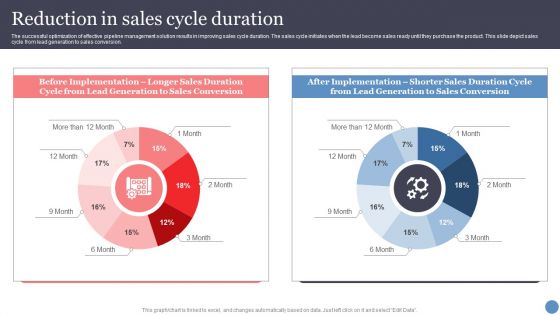
Reduction In Sales Cycle Duration Introduction PDF
The successful optimization of effective pipeline management solution results in improving sales cycle duration. The sales cycle initiates when the lead become sales ready until they purchase the product. This slide depict sales cycle from lead generation to sales conversion. Deliver and pitch your topic in the best possible manner with this Reduction In Sales Cycle Duration Introduction PDF. Use them to share invaluable insights on Implementation, Sales Conversion and impress your audience. This template can be altered and modified as per your expectations. So, grab it now.
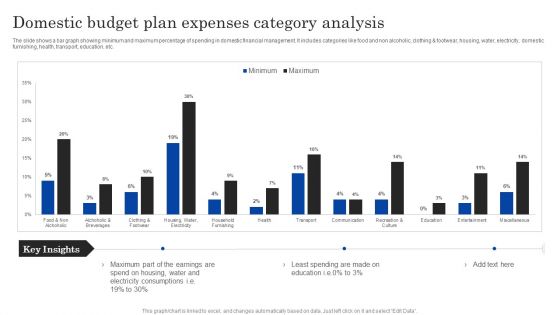
Domestic Budget Plan Expenses Category Analysis Ppt PowerPoint Presentation Layouts Inspiration PDF
The slide shows a bar graph showing minimum and maximum percentage of spending in domestic financial management. It includes categories like food and non alcoholic, clothing and footwear, housing, water, electricity, domestic furnishing, health, transport, education, etc.Showcasing this set of slides titled Domestic Budget Plan Expenses Category Analysis Ppt PowerPoint Presentation Layouts Inspiration PDF. The topics addressed in these templates are Part Earnings, Electricity Consumptions, Least Spending. All the content presented in this PPT design is completely editable. Download it and make adjustments in color, background, font etc. as per your unique business setting.

Key Challenges Of Pharmaceutical Quality Control In Industry Ppt PowerPoint Presentation Slides Examples PDF
This slide displays statistical analysis for most common operational barriers faced by pharmaceutical industry in quality management. It includes details such as digitalization, automation, cost inflations, process transparency, etc. Pitch your topic with ease and precision using this Key Challenges Of Pharmaceutical Quality Control In Industry Ppt PowerPoint Presentation Slides Examples PDF. This layout presents information on Opretional Inconsistencies, Latest Technologies, Automation Related. It is also available for immediate download and adjustment. So, changes can be made in the color, design, graphics or any other component to create a unique layout.
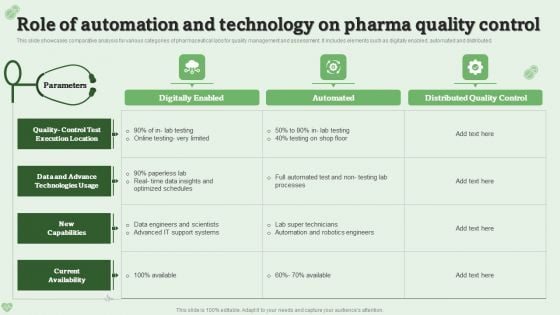
Role Of Automation And Technology On Pharma Quality Control Ppt PowerPoint Presentation Gallery Backgrounds PDF
This slide showcases comparative analysis for various categories of pharmaceutical labs for quality management and assessment. It includes elements such as digitally enabled, automated and distributed. Showcasing this set of slides titled Role Of Automation And Technology On Pharma Quality Control Ppt PowerPoint Presentation Gallery Backgrounds PDF. The topics addressed in these templates are Data Engineers, Current Availability, Quality Control. All the content presented in this PPT design is completely editable. Download it and make adjustments in color, background, font etc. as per your unique business setting.
Warehouse Automation Deployment Dashboard For Tracking Impact Of Warehouse House Infographics PDF
This slide covers the dashboard with after automation warehouse overview. It include KPIs such as autonomous robots status, robotic arms status, battery level, performance, time to return, etc. Deliver and pitch your topic in the best possible manner with this Warehouse Automation Deployment Dashboard For Tracking Impact Of Warehouse House Infographics PDF. Use them to share invaluable insights on Autonomous Robot, Systems Engineer, Warehouse Manager and impress your audience. This template can be altered and modified as per your expectations. So, grab it now.
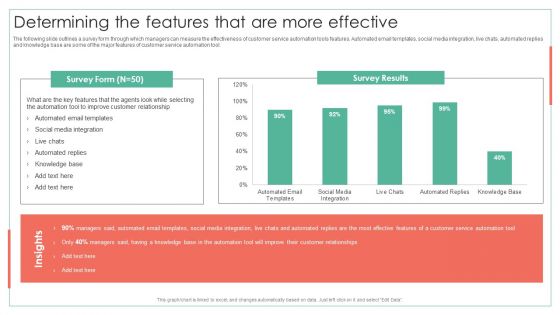
Determining The Features That Are More Effective Achieving Operational Efficiency Pictures PDF
The following slide outlines a survey form through which managers can measure the effectiveness of customer service automation tools features. Automated email templates, social media integration, live chats, automated replies and knowledge base are some of the major features of customer service automation tool.Deliver an awe inspiring pitch with this creative Determining The Features That Are More Effective Achieving Operational Efficiency Pictures PDF bundle. Topics like Customer Relationship, Media Integration, Knowledge Base can be discussed with this completely editable template. It is available for immediate download depending on the needs and requirements of the user.
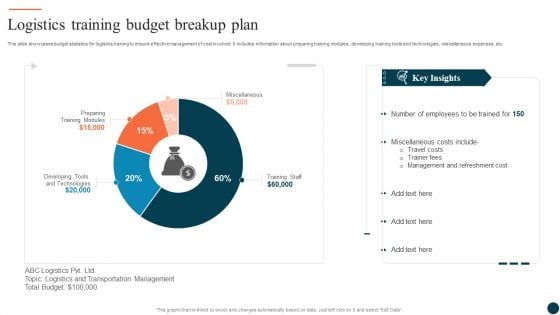
Logistics Training Budget Breakup Plan Ppt Infographics Infographic Template PDF
This slide showcases budget statistics for logistics training to ensure effective management of cost involved. It includes information about preparing training modules, developing training tools and technologies, miscellaneous expenses, etc. Showcasing this set of slides titled Logistics Training Budget Breakup Plan Ppt Infographics Infographic Template PDF. The topics addressed in these templates are Miscellaneous, Training Staff, Preparing Training Modules. All the content presented in this PPT design is completely editable. Download it and make adjustments in color, background, font etc. as per your unique business setting.
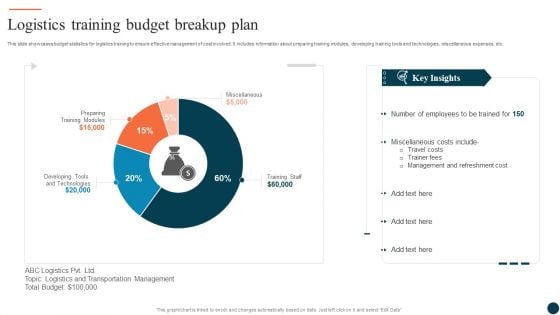
Logistics Training Budget Breakup Plan Ppt Inspiration Graphic Images PDF
This slide showcases budget statistics for logistics training to ensure effective management of cost involved. It includes information about preparing training modules, developing training tools and technologies, miscellaneous expenses, etc. Showcasing this set of slides titled Logistics Training Budget Breakup Plan Ppt Inspiration Graphic Images PDF. The topics addressed in these templates are Preparing Training Modules, Miscellaneous, Training Staff. All the content presented in this PPT design is completely editable. Download it and make adjustments in color, background, font etc. as per your unique business setting.
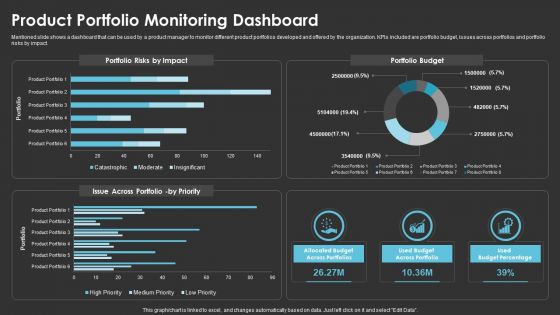
Method To Introduce New Product Offerings In The Industry Product Portfolio Monitoring Dashboard Template PDF
Mentioned slide shows a dashboard that can be used by a product manager to monitor different product portfolios developed and offered by the organization. KPIs included are portfolio budget, issues across portfolios and portfolio risks by impact. Deliver and pitch your topic in the best possible manner with this Method To Introduce New Product Offerings In The Industry Product Portfolio Monitoring Dashboard Template PDF. Use them to share invaluable insights on Portfolio Risks, Portfolio Budget and impress your audience. This template can be altered and modified as per your expectations. So, grab it now.
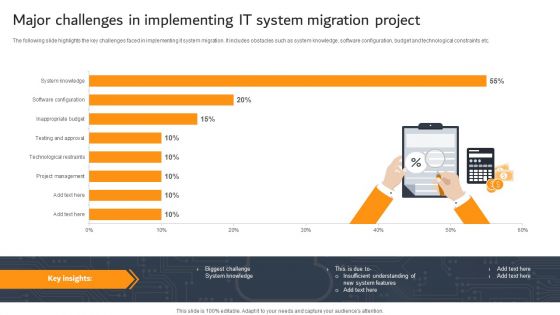
Major Challenges In Implementing IT System Migration Project Ppt PowerPoint Presentation Outline Graphics PDF
The following slide highlights the key challenges faced in implementing it system migration. It includes obstacles such as system knowledge, software configuration, budget and technological constraints etc.Pitch your topic with ease and precision using this Major Challenges In Implementing IT System Migration Project Ppt PowerPoint Presentation Outline Graphics PDF. This layout presents information on Insufficient Understanding, System Features, Project Management. It is also available for immediate download and adjustment. So, changes can be made in the color, design, graphics or any other component to create a unique layout.
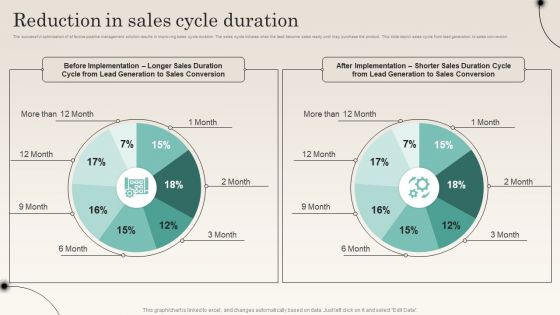
Reduction In Sales Cycle Duration Improving Distribution Channel Slides PDF
The successful optimization of effective pipeline management solution results in improving sales cycle duration. The sales cycle initiates when the lead become sales ready until they purchase the product. This slide depict sales cycle from lead generation to sales conversion.Deliver and pitch your topic in the best possible manner with this Reduction In Sales Cycle Duration Improving Distribution Channel Slides PDF. Use them to share invaluable insights on Positive Momentum, Opportunities Progression, Enhance Engagement and impress your audience. This template can be altered and modified as per your expectations. So, grab it now.
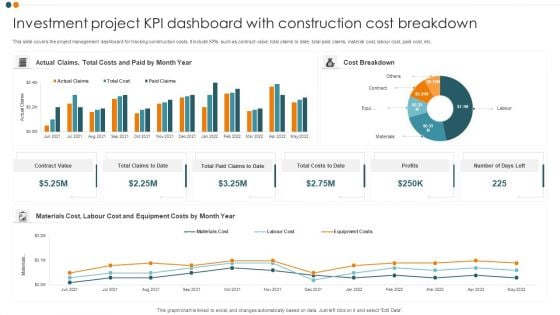
Investment Project KPI Dashboard With Construction Cost Breakdown Professional PDF
This slide covers the project management dashboard for tracking construction costs. It include KPIs such as contract value, total claims to date, total paid claims, material cost, labour cost, paid cost, etc. Showcasing this set of slides titled Investment Project KPI Dashboard With Construction Cost Breakdown Professional PDF. The topics addressed in these templates are Actual Claims, Cost Breakdown, Contract Value. All the content presented in this PPT design is completely editable. Download it and make adjustments in color, background, font etc. as per your unique business setting.
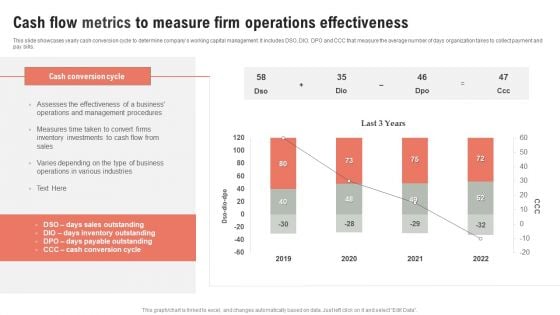
Cash Flow Metrics To Measure Firm Operations Effectiveness Ppt Outline Infographic Template PDF
This slide showcases yearly cash conversion cycle to determine companys working capital management. It includes DSO, DIO, DPO and CCC that measure the average number of days organization takes to collect payment and pay bills. Pitch your topic with ease and precision using this Cash Flow Metrics To Measure Firm Operations Effectiveness Ppt Outline Infographic Template PDF. This layout presents information on Cash Conversion Cycle, 2019 To 2022, Cash Flow. It is also available for immediate download and adjustment. So, changes can be made in the color, design, graphics or any other component to create a unique layout.
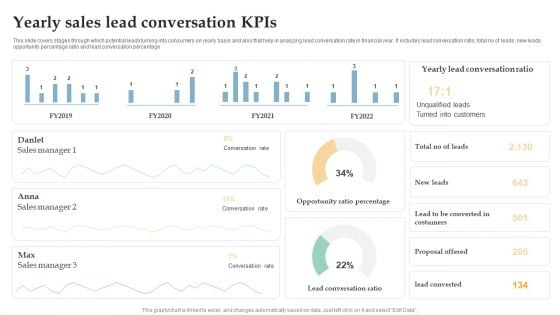
Yearly Sales Lead Conversation Kpis Ppt Inspiration Brochure PDF
This slide covers stages through which potential leads turning into consumers on yearly basis and also that help in analyzing lead conversation rate in financial year. It includes lead conversation ratio, total no of leads, new leads opportunity percentage ratio and lead conversation percentage. Pitch your topic with ease and precision using this Yearly Sales Lead Conversation Kpis Ppt Inspiration Brochure PDF. This layout presents information on Sales Manager, Conversation Rate, Opportunity Ratio Percentage. It is also available for immediate download and adjustment. So, changes can be made in the color, design, graphics or any other component to create a unique layout.
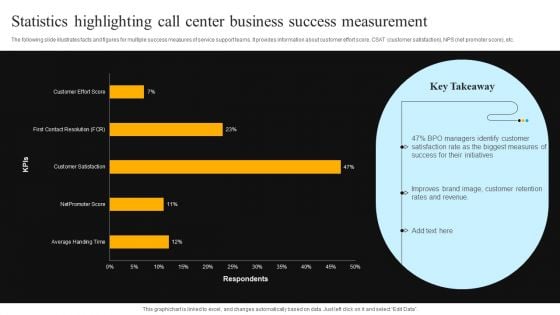
Statistics Highlighting Call Center Business Success Measurement Introduction PDF
The following slide illustrates facts and figures for multiple success measures of service support teams. It provides information about customer effort score, CSAT customer satisfaction, NPS net promoter score, etc. Showcasing this set of slides titled Statistics Highlighting Call Center Business Success Measurement Introduction PDF. The topics addressed in these templates are BPO Managers, Customer Satisfaction Rate, Biggest Measure. All the content presented in this PPT design is completely editable. Download it and make adjustments in color, background, font etc. as per your unique business setting.
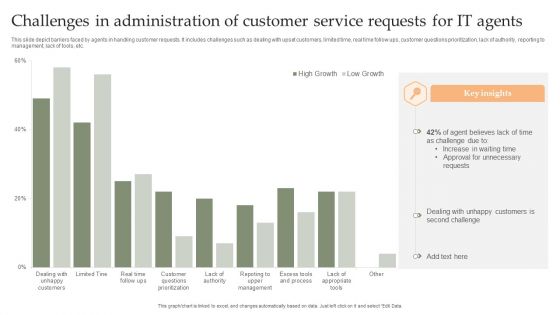
Challenges In Administration Of Customer Service Requests For IT Agents Mockup PDF
This slide depict barriers faced by agents in handling customer requests. It includes challenges such as dealing with upset customers, limited time, real time follow ups, customer questions prioritization, lack of authority, reporting to management, lack of tools, etc. Pitch your topic with ease and precision using this Challenges In Administration Of Customer Service Requests For IT Agents Mockup PDF. This layout presents information on Increase Waiting Time, Approval For Unnecessary, Dealing Unhappy Customers. It is also available for immediate download and adjustment. So, changes can be made in the color, design, graphics or any other component to create a unique layout.
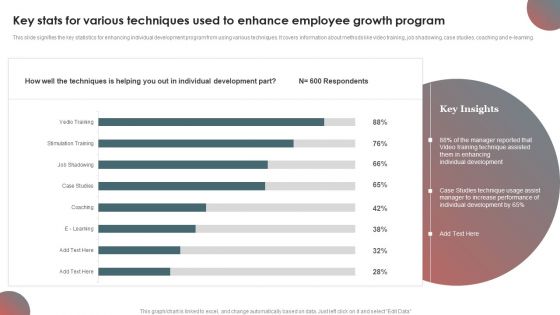
Key Stats For Various Techniques Used To Enhance Employee Growth Program Information PDF
This slide signifies the key statistics for enhancing individual development program from using various techniques. It covers information about methods like video training, job shadowing, case studies, coaching and e-learning.Pitch your topic with ease and precision using this Key Stats For Various Techniques Used To Enhance Employee Growth Program Information PDF. This layout presents information on Manager Reported, Technique Assisted, Them Enhancing. It is also available for immediate download and adjustment. So, changes can be made in the color, design, graphics or any other component to create a unique layout.
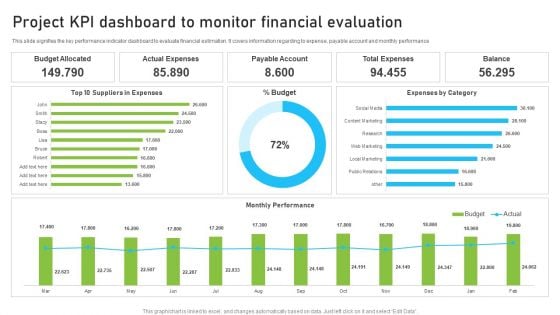
Project KPI Dashboard To Monitor Financial Evaluation Background PDF
This slide signifies the construction project management projection plan. It covers information regarding to the estimate ID, Task, effort hours, resource quantity, performance factor and duration evaluation. Pitch your topic with ease and precision using this Project KPI Dashboard To Monitor Financial Evaluation Background PDF. This layout presents information on Actual Expenses, Payable Account, Budget Allocated. It is also available for immediate download and adjustment. So, changes can be made in the color, design, graphics or any other component to create a unique layout.

Increase Sales By Lead Generation Problems Faced By The Company Pictures PDF
This slide shows the problems which are faced by the company while managing leads such as finding strategies, generate the leads, etc. This Increase Sales By Lead Generation Problems Faced By The Company Pictures PDF is perfect for any presentation, be it in front of clients or colleagues. It is a versatile and stylish solution for organizing your meetings. The product features a modern design for your presentation meetings. The adjustable and customizable slides provide unlimited possibilities for acing up your presentation. Slidegeeks has done all the homework before launching the product for you. So, dont wait, grab the presentation templates today.
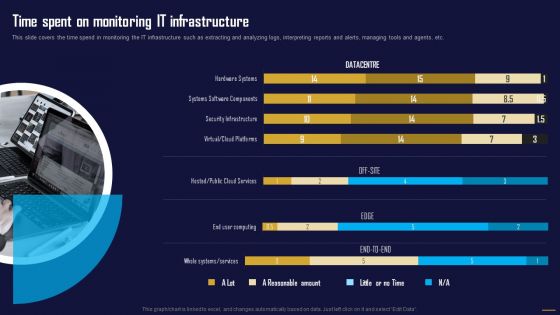
Time Spent On Monitoring IT Infrastructure Information Tech System Maintenance Designs PDF
This slide covers the time spend in monitoring the IT infrastructure such as extracting and analyzing logs, interpreting reports and alerts, managing tools and agents, etc.Want to ace your presentation in front of a live audience Our Time Spent On Monitoring IT Infrastructure Information Tech System Maintenance Designs PDF can help you do that by engaging all the users towards you.. Slidegeeks experts have put their efforts and expertise into creating these impeccable powerpoint presentations so that you can communicate your ideas clearly. Moreover, all the templates are customizable, and easy-to-edit and downloadable. Use these for both personal and commercial use.
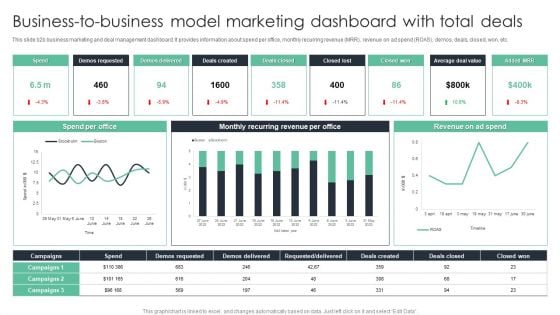
Business To Business Model Marketing Dashboard With Total Deals Ppt Professional Inspiration PDF
This slide b2b business marketing and deal management dashboard. It provides information about spend per office, monthly recurring revenue MRR, revenue on ad spend ROAS, demos, deals, closed, won, etc. Showcasing this set of slides titled Business To Business Model Marketing Dashboard With Total Deals Ppt Professional Inspiration PDF. The topics addressed in these templates are Demos Requested, Demos Delivered, Deals Created. All the content presented in this PPT design is completely editable. Download it and make adjustments in color, background, font etc. as per your unique business setting.
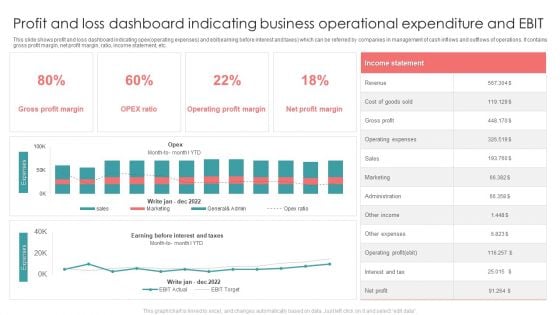
Profit And Loss Dashboard Indicating Business Operational Expenditure And EBIT Formats PDF
This slide shows profit and loss dashboard indicating opex operating expenses and ebit earning before interest and taxes which can be referred by companies in management of cash inflows and outflows of operations. It contains gross profit margin, net profit margin, ratio, income statement, etc. Showcasing this set of slides titled Profit And Loss Dashboard Indicating Business Operational Expenditure And EBIT Formats PDF. The topics addressed in these templates are Revenue, Gross Profit, Sales. All the content presented in this PPT design is completely editable. Download it and make adjustments in color, background, font etc. as per your unique business setting.
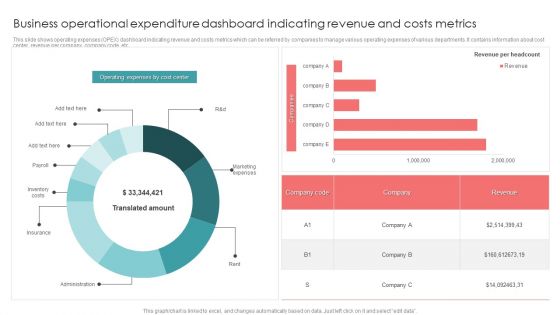
Business Operational Expenditure Dashboard Indicating Revenue And Costs Metrics Pictures PDF
This slide shows operating expenses OPEX dashboard indicating revenue and costs metrics which can be referred by companies to manage various operating expenses of various departments. It contains information about cost center, revenue per company, company code, etc. Pitch your topic with ease and precision using this Business Operational Expenditure Dashboard Indicating Revenue And Costs Metrics Pictures PDF. This layout presents information on Business Operational, Costs Metrics, Revenue. It is also available for immediate download and adjustment. So, changes can be made in the color, design, graphics or any other component to create a unique layout.
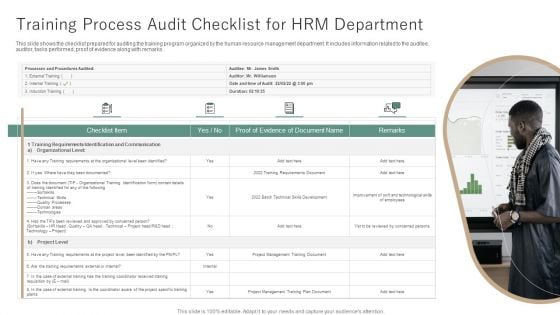
Training Process Audit Checklist For HRM Department Ppt Inspiration Deck PDF
This slide shows the checklist prepared for auditing the training program organized by the human resource management department. It includes information related to the auditee, auditor, tasks performed, proof of evidence along with remarks. Persuade your audience using this Training Process Audit Checklist For HRM Department Ppt Inspiration Deck PDF. This PPT design covers four stages, thus making it a great tool to use. It also caters to a variety of topics including Checklist Item, Organizational Level, Been Documented. Download this PPT design now to present a convincing pitch that not only emphasizes the topic but also showcases your presentation skills.
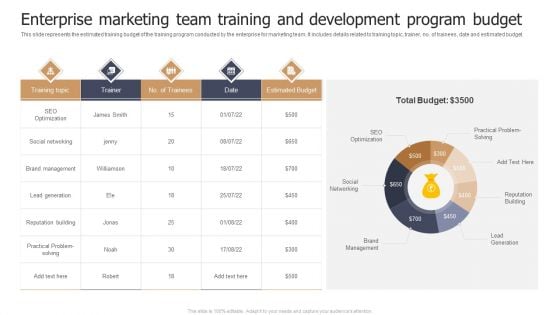
Enterprise Marketing Team Training And Development Program Budget Infographics PDF
This slide represents the estimated training budget of the training program conducted by the enterprise for marketing team. It includes details related to training topic, trainer, no. of trainees, date and estimated budget. Pitch your topic with ease and precision using this Enterprise Marketing Team Training And Development Program Budget Infographics PDF. This layout presents information on SEO Optimization, Social Networking, Brand Management. It is also available for immediate download and adjustment. So, changes can be made in the color, design, graphics or any other component to create a unique layout.
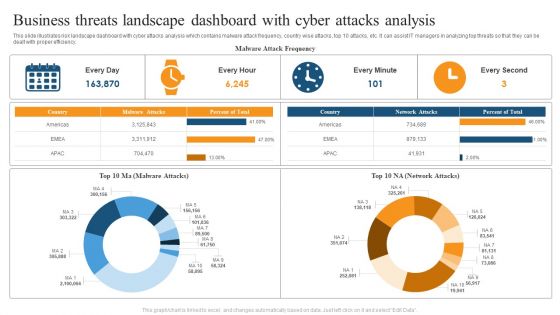
Business Threats Landscape Dashboard With Cyber Attacks Analysis Ppt Summary Brochure PDF
This slide illustrates risk landscape dashboard with cyber attacks analysis which contains malware attack frequency, country wise attacks, top 10 attacks, etc. It can assist IT managers in analyzing top threats so that they can be dealt with proper efficiency. Pitch your topic with ease and precision using this Business Threats Landscape Dashboard With Cyber Attacks Analysis Ppt Summary Brochure PDF. This layout presents information on Malware Attack Frequency, Every Minute, Every Second. It is also available for immediate download and adjustment. So, changes can be made in the color, design, graphics or any other component to create a unique layout.
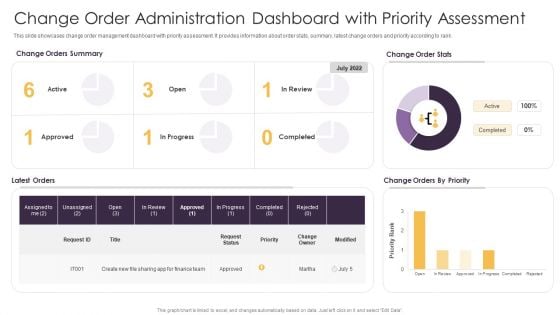
Change Order Administration Dashboard With Priority Assessment Ppt Portfolio Inspiration PDF
This slide showcases change order management dashboard with priority assessment. It provides information about order stats, summary, latest change orders and priority according to rank. Pitch your topic with ease and precision using this Change Order Administration Dashboard With Priority Assessment Ppt Portfolio Inspiration PDF. This layout presents information on Change Orders Priority, Change Order Stats, Change Orders Summary. It is also available for immediate download and adjustment. So, changes can be made in the color, design, graphics or any other component to create a unique layout.
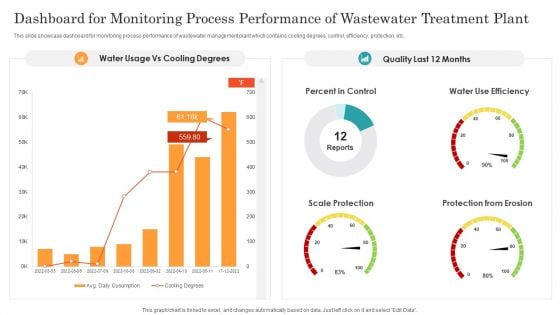
Dashboard For Monitoring Process Performance Of Wastewater Treatment Plant Ppt Infographic Template Demonstration PDF
This slide showcase dashboard for monitoring process performance of wastewater management plant which contains cooling degrees, control, efficiency, protection, etc. Showcasing this set of slides titled Dashboard For Monitoring Process Performance Of Wastewater Treatment Plant Ppt Infographic Template Demonstration PDF. The topics addressed in these templates are Percent Control, Water Use Efficiency, Scale Protection, Protection From Erosion. All the content presented in this PPT design is completely editable. Download it and make adjustments in color, background, font etc. as per your unique business setting.
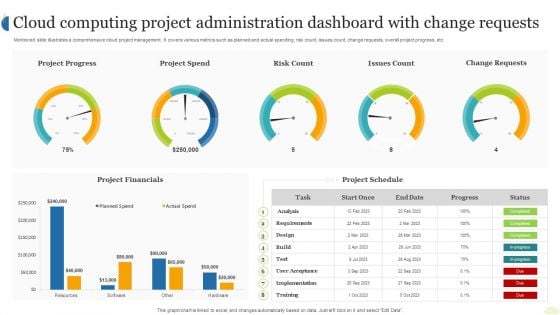
Cloud Computing Project Administration Dashboard With Change Requests Ppt Layouts Background Images PDF
Mentioned slide illustrates a comprehensive cloud project management. It covers various metrics such as planned and actual spending, risk count, issues count, change requests, overall project progress, etc. Showcasing this set of slides titled Cloud Computing Project Administration Dashboard With Change Requests Ppt Layouts Background Images PDF. The topics addressed in these templates are Project Financials, Project Spend, Project Progress. All the content presented in this PPT design is completely editable. Download it and make adjustments in color, background, font etc. as per your unique business setting.
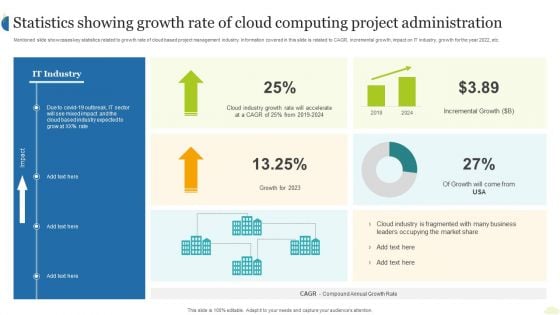
Statistics Showing Growth Rate Of Cloud Computing Project Administration Ppt Ideas Aids PDF
Mentioned slide showcases key statistics related to growth rate of cloud based project management industry. Information covered in this slide is related to CAGR, incremental growth, impact on IT industry, growth for the year 2022, etc. Showcasing this set of slides titled Statistics Showing Growth Rate Of Cloud Computing Project Administration Ppt Ideas Aids PDF. The topics addressed in these templates are IT Industry, Growth 2023, Incremental Growth. All the content presented in this PPT design is completely editable. Download it and make adjustments in color, background, font etc. as per your unique business setting.
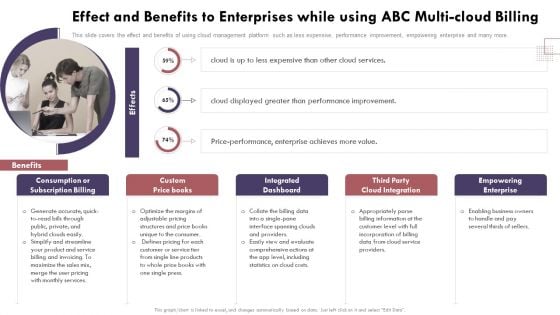
Effect And Benefits To Enterprises While Using Abc Cloud Computing Complexities And Solutions Slides PDF
This slide covers the effect and benefits of using cloud management platform such as less expensive, performance improvement, empowering enterprise and many more.Take your projects to the next level with our ultimate collection of Effect And Benefits To Enterprises While Using Abc Cloud Computing Complexities And Solutions Slides PDF. Slidegeeks has designed a range of layouts that are perfect for representing task or activity duration, keeping track of all your deadlines at a glance. Tailor these designs to your exact needs and give them a truly corporate look with your own brand colors they all make your projects stand out from the rest.
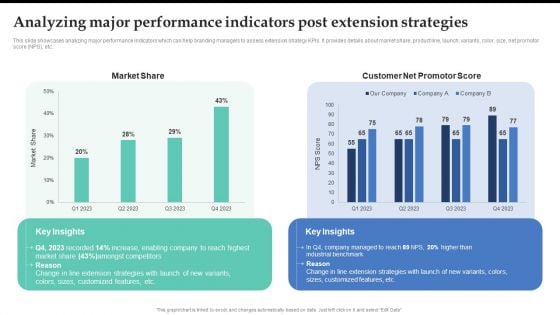
Analyzing Major Performance Indicators Post Extension Strategies Topics PDF
This slide showcases analyzing major performance indicators which can help branding managers to assess extension strategy KPIs. It provides details about market share, product line, launch, variants, color, size, net promotor score NPS, etc. From laying roadmaps to briefing everything in detail, our templates are perfect for you. You can set the stage with your presentation slides. All you have to do is download these easy-to-edit and customizable templates. Analyzing Major Performance Indicators Post Extension Strategies Topics PDF will help you deliver an outstanding performance that everyone would remember and praise you for. Do download this presentation today.
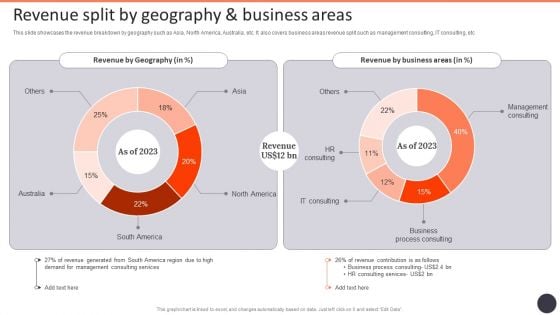
Business Strategy Consulting Solutions Company Outline Revenue Split By Geography And Business Areas Designs PDF
This slide showcases the revenue breakdown by geography such as Asia, North America, Australia, etc. It also covers business areas revenue split such as management consulting, IT consulting, etc. Take your projects to the next level with our ultimate collection of Business Strategy Consulting Solutions Company Outline Revenue Split By Geography And Business Areas Designs PDF. Slidegeeks has designed a range of layouts that are perfect for representing task or activity duration, keeping track of all your deadlines at a glance. Tailor these designs to your exact needs and give them a truly corporate look with your own brand colors they will make your projects stand out from the rest.
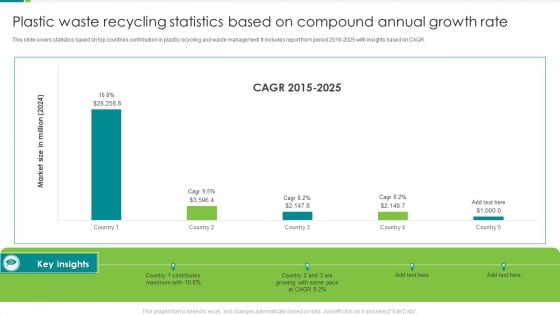
Plastic Waste Recycling Statistics Based On Compound Annual Growth Rate Inspiration PDF
This slide covers statistics based on top countries contribution in plastic recycling and waste management. It includes report from period 2019-2025 with insights based on CAGR. Pitch your topic with ease and precision using this Plastic Waste Recycling Statistics Based On Compound Annual Growth Rate Inspiration PDF. This layout presents information on Contributes Maximum, 2015 To 2025. It is also available for immediate download and adjustment. So, changes can be made in the color, design, graphics or any other component to create a unique layout.
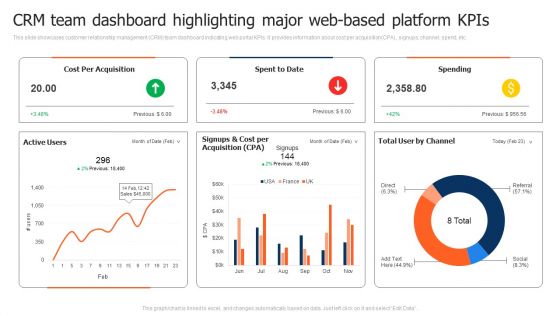
CRM Team Dashboard Highlighting Major Web Based Platform Kpis Template PDF
This slide showcases customer relationship management CRM team dashboard indicating web portal KPIs. It provides information about cost per acquisition CPA, signups, channel, spend, etc. Pitch your topic with ease and precision using this CRM Team Dashboard Highlighting Major Web Based Platform Kpis Template PDF. This layout presents information on CRM Team Dashboard Highlighting, Web Based Platform Kpis. It is also available for immediate download and adjustment. So, changes can be made in the color, design, graphics or any other component to create a unique layout.
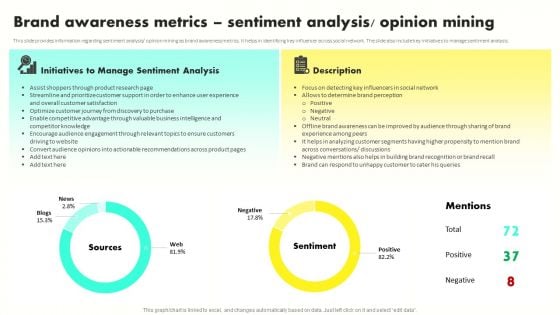
Developing Brand Awareness To Gain Customer Attention Brand Awareness Metrics Sentiment Analysisg Portrait PDF
This slide provides information regarding sentiment analysis opinion mining as brand awareness metrics. It helps in identifying key influencer across social network. The slide also include key initiatives to manage sentiment analysis. There are so many reasons you need a Developing Brand Awareness To Gain Customer Attention Brand Awareness Metrics Sentiment Analysisg Portrait PDF. The first reason is you can notspend time making everything from scratch, Thus, Slidegeeks has made presentation templates for you too. You can easily download these templates from our website easily.
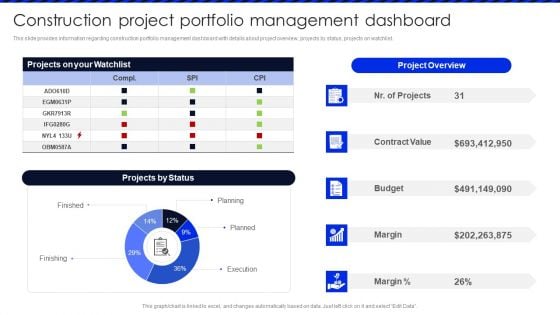
Embracing Construction Project Playbook Construction Project Portfolio Brochure PDF
This slide provides information regarding construction portfolio management dashboard with details about project overview, projects by status, projects on watchlist. From laying roadmaps to briefing everything in detail, our templates are perfect for you. You can set the stage with your presentation slides. All you have to do is download these easy-to-edit and customizable templates. Embracing Construction Project Playbook Construction Project Portfolio Brochure PDF will help you deliver an outstanding performance that everyone would remember and praise you for. Do download this presentation today.
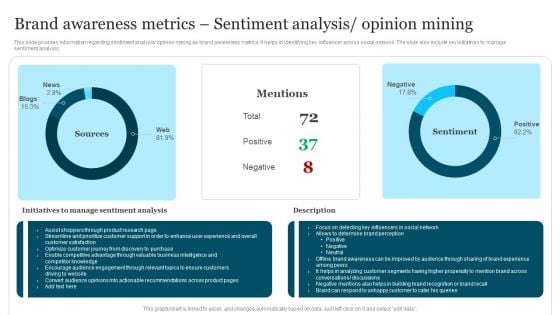
Improving Brand Recognition To Boost Brand Awareness Metrics Sentiment Analysis Guidelines PDF
This slide provides information regarding sentiment analysis or opinion mining as brand awareness metrics. It helps in identifying key influencer across social network. The slide also include key initiatives to manage sentiment analysis. Want to ace your presentation in front of a live audience Our Improving Brand Recognition To Boost Brand Awareness Metrics Sentiment Analysis Guidelines PDF can help you do that by engaging all the users towards you. Slidegeeks experts have put their efforts and expertise into creating these impeccable powerpoint presentations so that you can communicate your ideas clearly. Moreover, all the templates are customizable, and easy-to-edit and downloadable. Use these for both personal and commercial use.
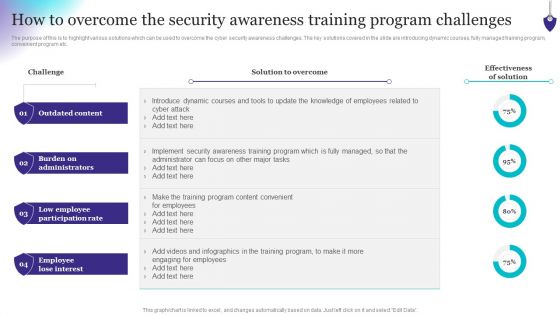
Organizing Security Awareness How To Overcome The Security Awareness Training Brochure PDF
The purpose of this is to highlight various solutions which can be used to overcome the cyber security awareness challenges. The key solutions covered in the slide are introducing dynamic courses, fully managed training program, convenient program etc. If your project calls for a presentation, then Slidegeeks is your go-to partner because we have professionally designed, easy-to-edit templates that are perfect for any presentation. After downloading, you can easily edit Organizing Security Awareness How To Overcome The Security Awareness Training Brochure PDF and make the changes accordingly. You can rearrange slides or fill them with different images. Check out all the handy templates.
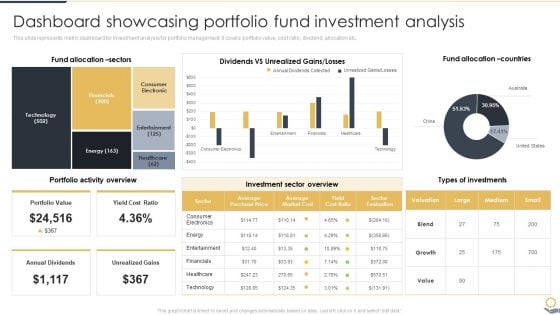
Dashboard Showcasing Portfolio Fund Investment Analysis Portfolio Investment Analysis Designs PDF
This slide represents metric dashboard for investment analysis for portfolio management. It covers portfolio value, cost ratio, dividend, allocation etc.Slidegeeks is one of the best resources for PowerPoint templates. You can download easily and regulate Dashboard Showcasing Portfolio Fund Investment Analysis Portfolio Investment Analysis Designs PDF for your personal presentations from our wonderful collection. A few clicks is all it takes to discover and get the most relevant and appropriate templates. Use our Templates to add a unique zing and appeal to your presentation and meetings. All the slides are easy to edit and you can use them even for advertisement purposes.
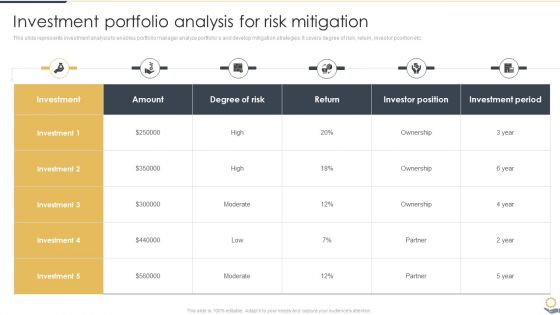
Investment Portfolio Analysis For Risk Mitigation Portfolio Investment Analysis Download PDF
This slide represents investment analysis to enables portfolio manager analyze portfolios and develop mitigation strategies. It covers degree of risk, return, investor position etc. Want to ace your presentation in front of a live audience Our Investment Portfolio Analysis For Risk Mitigation Portfolio Investment Analysis Download PDF can help you do that by engaging all the users towards you.. Slidegeeks experts have put their efforts and expertise into creating these impeccable powerpoint presentations so that you can communicate your ideas clearly. Moreover, all the templates are customizable, and easy-to-edit and downloadable. Use these for both personal and commercial use.
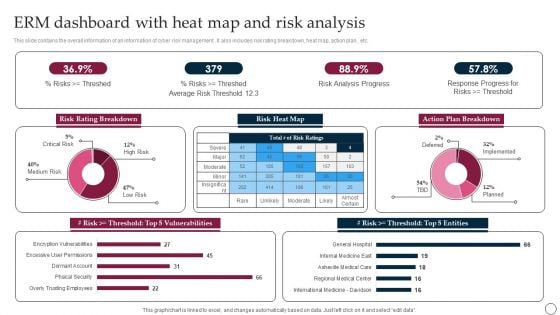
ERM Dashboard With Heat Map And Risk Analysis Ppt PowerPoint Presentation File Backgrounds PDF
This slide contains the overall information of an information of cyber risk management . It also includes risk rating breakdown, heat map, action plan , etc. Showcasing this set of slides titled ERM Dashboard With Heat Map And Risk Analysis Ppt PowerPoint Presentation File Backgrounds PDF. The topics addressed in these templates are Risk Rating Breakdown, Average Risk, Risk Analysis Progress. All the content presented in this PPT design is completely editable. Download it and make adjustments in color, background, font etc. as per your unique business setting.


 Continue with Email

 Home
Home


