Stakeholder Management Plan
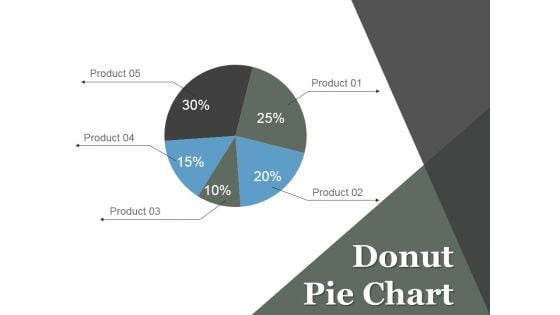
Donut Pie Chart Ppt PowerPoint Presentation Model
This is a donut pie chart ppt powerpoint presentation model. This is a five stage process. The stages in this process are finance, donut, marketing, product, chart, management.
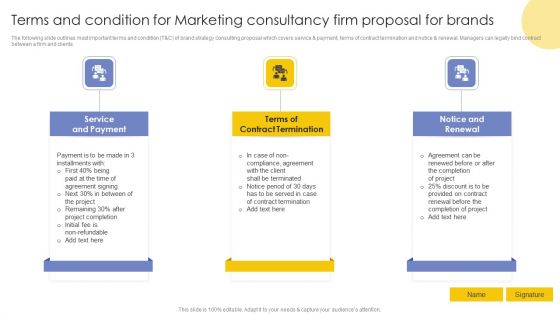
Terms And Condition For Marketing Consultancy Firm Proposal For Brands Ppt Pictures Design Inspiration PDF
The following slide outlines most important terms and condition T and C of brand strategy consulting proposal which covers service and payment, terms of contract termination and notice and renewal. Managers can legally bind contract between a firm and clients. Find highly impressive Terms And Condition For Marketing Consultancy Firm Proposal For Brands Ppt Pictures Design Inspiration PDF on Slidegeeks to deliver a meaningful presentation. You can save an ample amount of time using these presentation templates. No need to worry to prepare everything from scratch because Slidegeeks experts have already done a huge research and work for you. You need to download Terms And Condition For Marketing Consultancy Firm Proposal For Brands Ppt Pictures Design Inspiration PDF for your upcoming presentation. All the presentation templates are 100 percent editable and you can change the color and personalize the content accordingly. Download now.
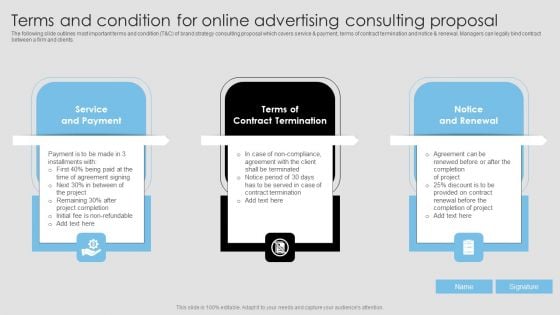
Terms And Condition For Online Advertising Consulting Proposal Pictures PDF
The following slide outlines most important terms and condition T and C of brand strategy consulting proposal which covers service and payment, terms of contract termination and notice and renewal. Managers can legally bind contract between a firm and clients. Find highly impressive Terms And Condition For Online Advertising Consulting Proposal Pictures PDF on Slidegeeks to deliver a meaningful presentation. You can save an ample amount of time using these presentation templates. No need to worry to prepare everything from scratch because Slidegeeks experts have already done a huge research and work for you. You need to download Terms And Condition For Online Advertising Consulting Proposal Pictures PDF for your upcoming presentation. All the presentation templates are 100 percent editable and you can change the color and personalize the content accordingly. Download now.
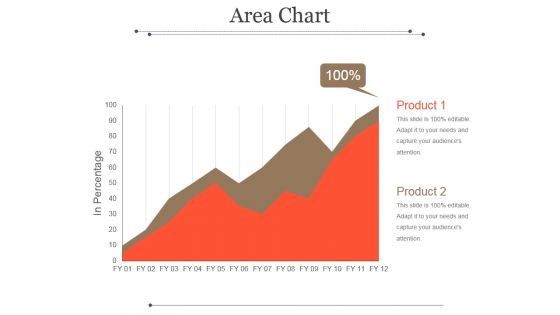
Area Chart Ppt PowerPoint Presentation Picture
This is a area chart ppt powerpoint presentation picture. This is a two stage process. The stages in this process are product, in percentage, graph, management, business.
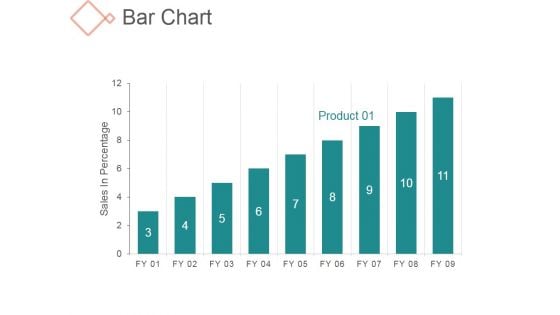
Bar Chart Ppt PowerPoint Presentation Styles
This is a bar chart ppt powerpoint presentation styles. This is a nine stage process. The stages in this process are business, management, sales in percentage, growth.
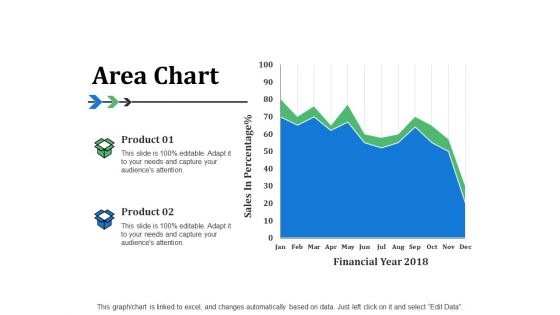
Area Chart Ppt PowerPoint Presentation Summary Backgrounds
This is a area chart ppt powerpoint presentation summary backgrounds. This is a two stage process. The stages in this process are percentage, financial, business, management.

Line Chart Ppt PowerPoint Presentation File Sample
This is a line chart ppt powerpoint presentation file sample. This is a two stage process. The stages in this process are finance, marketing, management, investment, analysis.
Pie Chart Ppt PowerPoint Presentation Icon Clipart
This is a pie chart ppt powerpoint presentation icon clipart. This is a four stage process. The stages in this process are finance, marketing, management, investment, analysis.
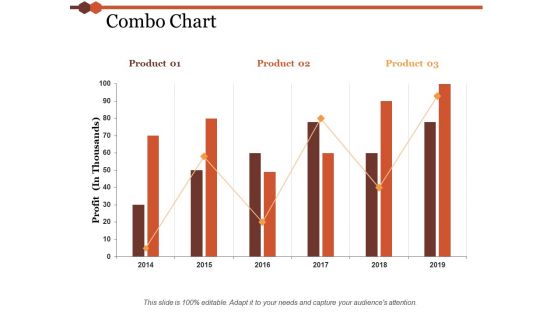
Combo Chart Ppt PowerPoint Presentation Model Professional
This is a combo chart ppt powerpoint presentation model professional. This is a three stage process. The stages in this process are finance, marketing, management, investment, analysis.
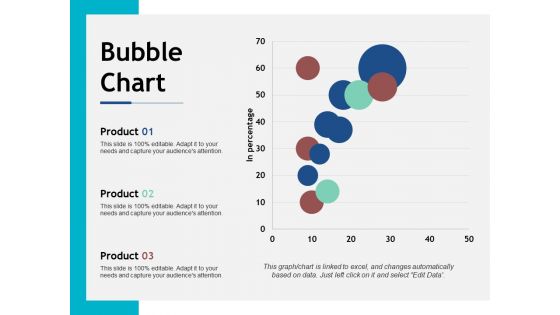
Bubble Chart Ppt PowerPoint Presentation Styles Show
This is a bubble chart ppt powerpoint presentation styles show. This is a three stage process. The stages in this process are finance, marketing, management, investment, analysis.
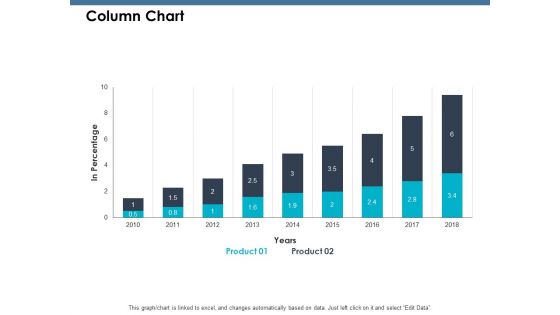
Column Chart Ppt PowerPoint Presentation Pictures Aids
This is a column chart ppt powerpoint presentation pictures aids. This is a two stage process. The stages in this process are Percentage, Product, Marketing, Management.
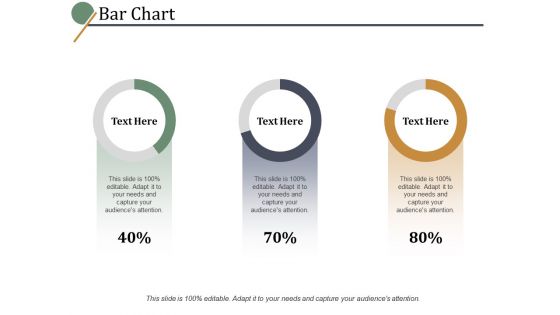
Bar Chart Ppt PowerPoint Presentation Professional Examples
This is a bar chart ppt powerpoint presentation professional examples. This is a four stage process. The stages in this process are percentage, marketing, management, product.
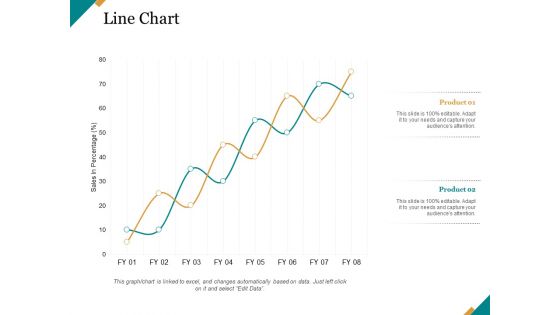
Line Chart Ppt PowerPoint Presentation Pictures Graphics
This is a line chart ppt powerpoint presentation pictures graphics. This is a two stage process. The stages in this process are finance, marketing, management, investment, analysis.
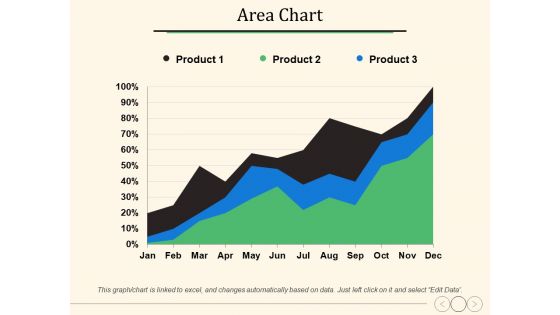
Area Chart Ppt PowerPoint Presentation Show Graphics
This is a area chart ppt powerpoint presentation show graphics. This is a three stage process. The stages in this process are percentage, product, marketing, management, business.
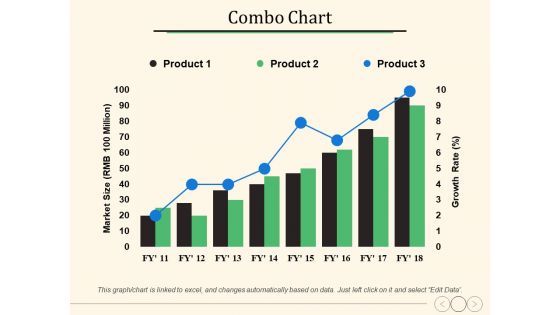
Combo Chart Ppt PowerPoint Presentation Slides Slideshow
This is a combo chart ppt powerpoint presentation slides slideshow. This is a three stage process. The stages in this process are percentage, product, marketing, management, business.
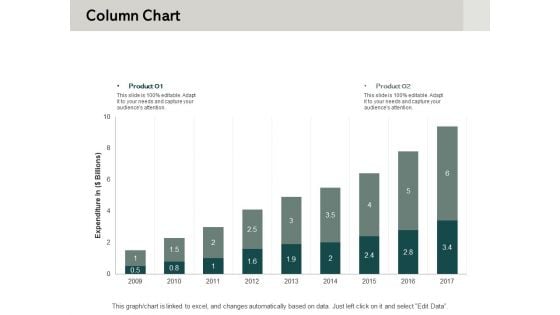
Column Chart Ppt PowerPoint Presentation Show Objects
This is a column chart ppt powerpoint presentation show objects. This is a two stage process. The stages in this process are percentage, product, business, management, marketing.
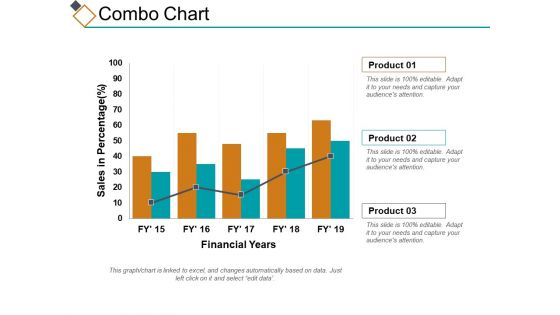
Combo Chart Ppt PowerPoint Presentation Styles Topics
This is a combo chart ppt powerpoint presentation styles topics. This is a three stage process. The stages in this process are percentage, product, business, management, marketing.
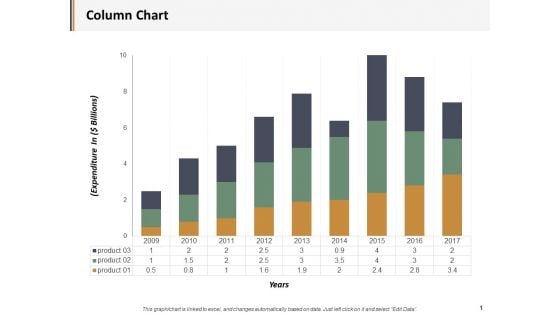
Column Chart Financial Ppt PowerPoint Presentation Information
This is a column chart financial ppt powerpoint presentation information. This is a three stage process. The stages in this process are business, management, marketing, percentage, product.
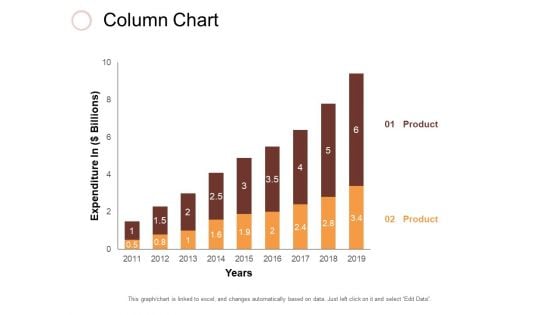
Column Chart Ppt PowerPoint Presentation Slides Clipart
This is a column chart ppt powerpoint presentation slides clipart. This is a two stage process. The stages in this process are business, management, marketing, percentage, product.
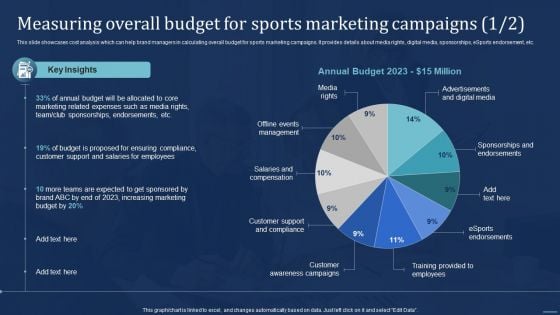
Integrating Sports Marketing Campaign Measuring Overall Budget For Sports Marketing Ideas PDF
This slide showcases cost analysis which can help brand managers in calculating overall budget for sports marketing campaigns. It provides details about media rights, digital media, sponsorships, eSports endorsement, etc. Whether you have daily or monthly meetings, a brilliant presentation is necessary. Integrating Sports Marketing Campaign Measuring Overall Budget For Sports Marketing Ideas PDF can be your best option for delivering a presentation. Represent everything in detail using Integrating Sports Marketing Campaign Measuring Overall Budget For Sports Marketing Ideas PDF and make yourself stand out in meetings. The template is versatile and follows a structure that will cater to your requirements. All the templates prepared by Slidegeeks are easy to download and edit. Our research experts have taken care of the corporate themes as well. So, give it a try and see the results.
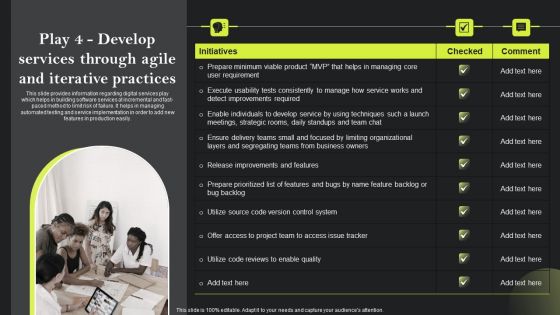
Playbook For Advancing Technology Play 4 Develop Services Through Agile And Iterative Portrait PDF
This slide provides information regarding digital services play which helps in building software services at incremental and fast-paced method to limit risk of failure. It helps in managing automated testing and service implementation in order to add new features in production easily. This modern and well-arranged Playbook For Advancing Technology Play 4 Develop Services Through Agile And Iterative Portrait PDF provides lots of creative possibilities. It is very simple to customize and edit with the Powerpoint Software. Just drag and drop your pictures into the shapes. All facets of this template can be edited with Powerpoint, no extra software is necessary. Add your own material, put your images in the places assigned for them, adjust the colors, and then you can show your slides to the world, with an animated slide included.
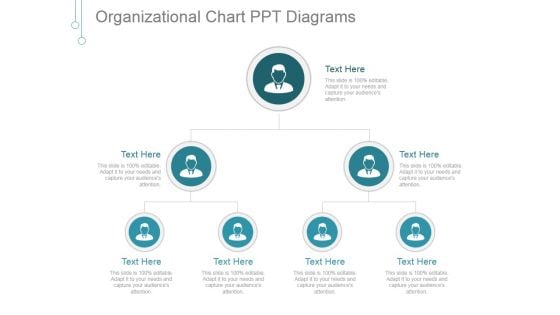
Organizational Chart Ppt PowerPoint Presentation Pictures
This is a organizational chart ppt powerpoint presentation pictures. This is a three stage process. The stages in this process are management, marketing, business, chart, organizational chart.
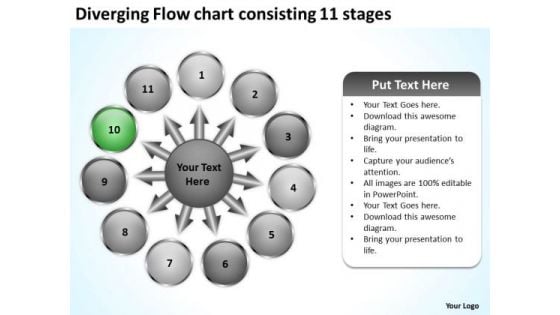
Diverging Flow Chart Consisting 11 Stages Ppt Circular Arrow Diagram PowerPoint Templates
We present our diverging flow chart consisting 11 stages ppt Circular Arrow Diagram PowerPoint templates.Use our Business PowerPoint Templates because you can see clearly through to the bigger bowl ahead. Time your jump to perfection and hit the nail on the head. Download and present our Circle Charts PowerPoint Templates because there are so many different pieces to the puzzle. Present our Arrows PowerPoint Templates because you have the process in your head, our template design showing will illuminate your thoughts. Download our Shapes PowerPoint Templates because you have the people in place, selected the team leaders and all are raring to go. Download our Flow charts PowerPoint Templates because you can Educate your team with the attention to be paid.Use these PowerPoint slides for presentations relating to Arrows, blank, business, central, centralized, chart, circle, circular, circulation concept, conceptual, converging, design, diagram, empty, executive, icon, idea illustration, management, map, mapping, moa, model, numbers, organization outwards, pointing, procedure, process, radial, radiating, relationship, resource sequence, sequential, seven, square, strategy, template. The prominent colors used in the PowerPoint template are Green, Gray, White. Presenters tell us our diverging flow chart consisting 11 stages ppt Circular Arrow Diagram PowerPoint templates are Striking. Presenters tell us our central PowerPoint templates and PPT Slides provide you with a vast range of viable options. Select the appropriate ones and just fill in your text. PowerPoint presentation experts tell us our diverging flow chart consisting 11 stages ppt Circular Arrow Diagram PowerPoint templates are Cheerful. We assure you our centralized PowerPoint templates and PPT Slides are Multicolored. Customers tell us our diverging flow chart consisting 11 stages ppt Circular Arrow Diagram PowerPoint templates are effectively colour coded to prioritise your plans They automatically highlight the sequence of events you desire. People tell us our circle PowerPoint templates and PPT Slides are Quaint. Make a huge difference with our Diverging Flow Chart Consisting 11 Stages Ppt Circular Arrow Diagram PowerPoint Templates. Create the work culture you desire.
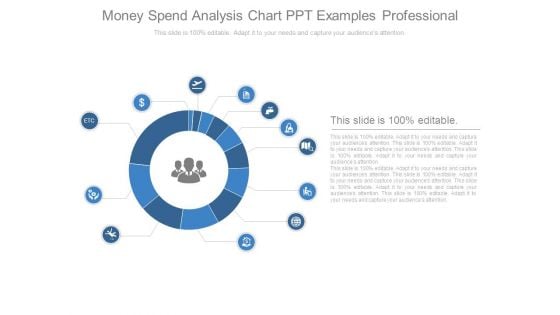
Money Spend Analysis Chart Ppt Examples Professional
This is a money spend analysis chart ppt examples professional. This is a twelve stage process. The stages in this process are marketing, business, icon, process, management.
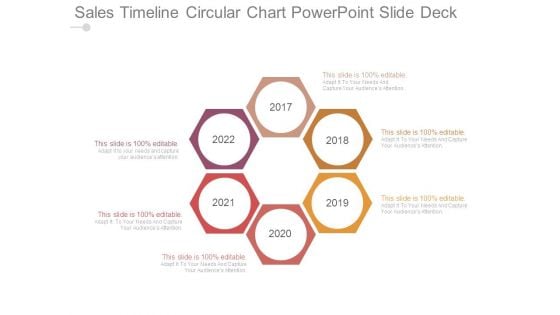
Sales Timeline Circular Chart Powerpoint Slide Deck
This is a sales timeline circular chart powerpoint slide deck. This is a six stage process. The stages in this process are process, analysis, management, marketing, business.
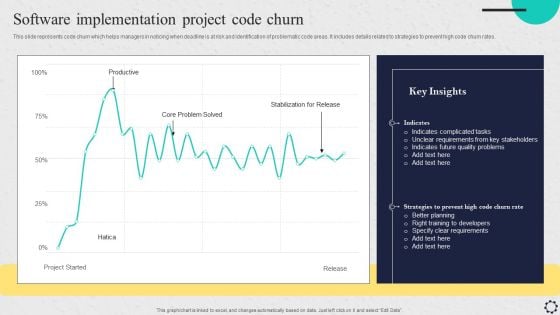
Software Implementation Project Code Churn Introduction PDF
This slide represents code churn which helps managers in noticing when deadline is at risk and identification of problematic code areas. It includes details related to strategies to prevent high code churn rates. This Software Implementation Project Code Churn Introduction PDF from Slidegeeks makes it easy to present information on your topic with precision. It provides customization options, so you can make changes to the colors, design, graphics, or any other component to create a unique layout. It is also available for immediate download, so you can begin using it right away. Slidegeeks has done good research to ensure that you have everything you need to make your presentation stand out. Make a name out there for a brilliant performance.
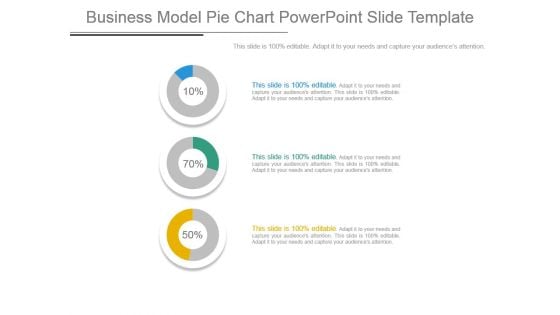
Business Model Pie Chart Powerpoint Slide Template
This is a business model pie chart powerpoint slide template. This is a three stage process. The stages in this process are business, finance, management, marketing, pie chart.
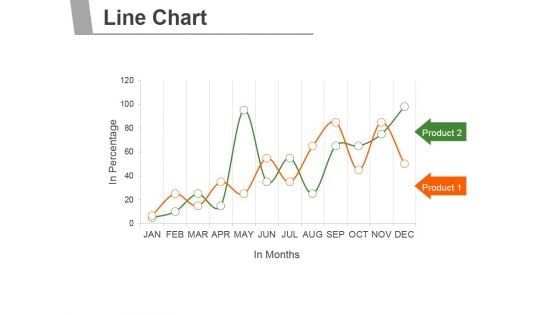
Line Chart Ppt PowerPoint Presentation Portfolio
This is a line chart ppt powerpoint presentation portfolio. This is a two stage process. The stages in this process are business, marketing, management, line chart, analysis.
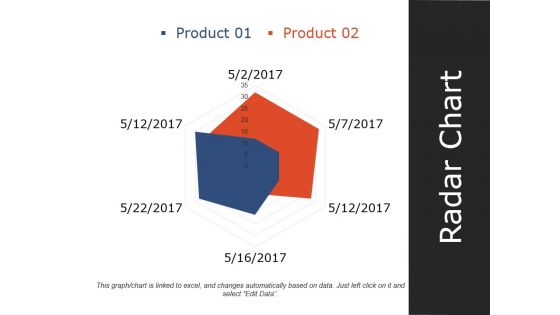
Radar Chart Ppt PowerPoint Presentation Infographics Slideshow
This is a radar chart ppt powerpoint presentation infographics slideshow. This is a two stage process. The stages in this process are product, radar chart, shape, management, marketing.
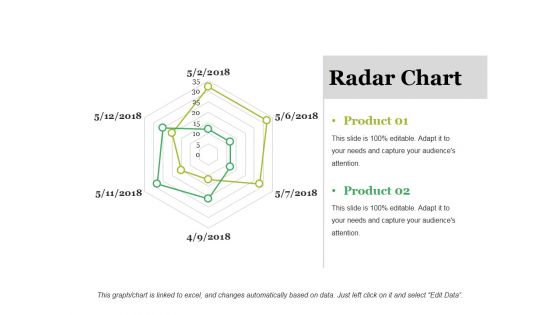
Radar Chart Ppt PowerPoint Presentation Inspiration Rules
This is a radar chart ppt powerpoint presentation inspiration rules. This is a two stage process. The stages in this process are radar chart, business, marketing, finance, management.
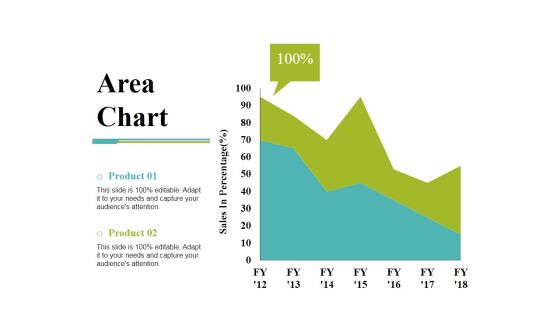
Area Chart Ppt PowerPoint Presentation File Slides
This is a area chart ppt powerpoint presentation file slides. This is a two stage process. The stages in this process are product, area chart, business, marketing, management.
Column Chart Ppt PowerPoint Presentation Icon Influencers
This is a column chart ppt powerpoint presentation icon influencers. This is a two stage process. The stages in this process are column chart, finance, marketing, management, investment.
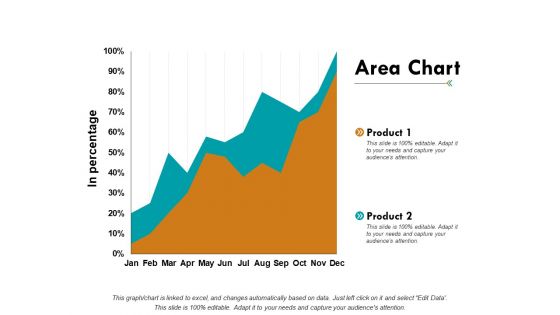
Area Chart Finanace Ppt PowerPoint Presentation Ideas
This is a area chart finanace ppt powerpoint presentation ideas. This is a two stage process. The stages in this process are area chart, finance, marketing, management, investment.
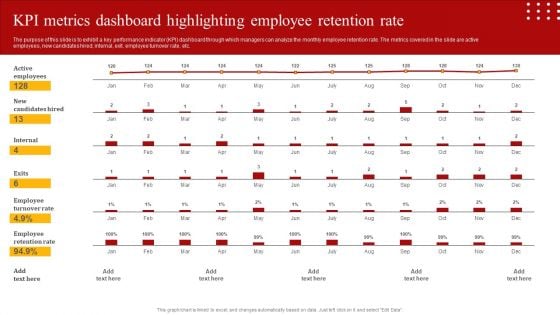
Staff Retention Techniques To Minimize Hiring Expenses KPI Metrics Dashboard Highlighting Employee Retention Template PDF
The purpose of this slide is to exhibit a key performance indicator KPI dashboard through which managers can analyze the monthly employee retention rate. The metrics covered in the slide are active employees, new candidates hired, internal, exit, employee turnover rate, etc. Do you have to make sure that everyone on your team knows about any specific topic I yes, then you should give Staff Retention Techniques To Minimize Hiring Expenses KPI Metrics Dashboard Highlighting Employee Retention Template PDF a try. Our experts have put a lot of knowledge and effort into creating this impeccable Staff Retention Techniques To Minimize Hiring Expenses KPI Metrics Dashboard Highlighting Employee Retention Template PDF. You can use this template for your upcoming presentations, as the slides are perfect to represent even the tiniest detail. You can download these templates from the Slidegeeks website and these are easy to edit. So grab these today.

Executive Summary Ppt PowerPoint Presentation Inspiration Maker
This is a executive summary ppt powerpoint presentation inspiration maker. This is a four stage process. The stages in this process are company s vision, promoters and shareholding, company s mission, background, capabilities.
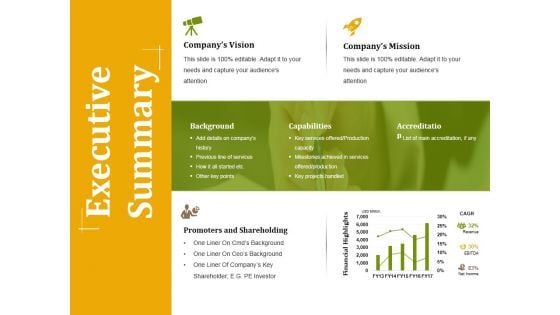
Executive Summary Ppt PowerPoint Presentation Professional Example
This is a executive summary ppt powerpoint presentation professional example. This is a four stage process. The stages in this process are background, capabilities, accreditation, promoters and shareholding, financial highlights.
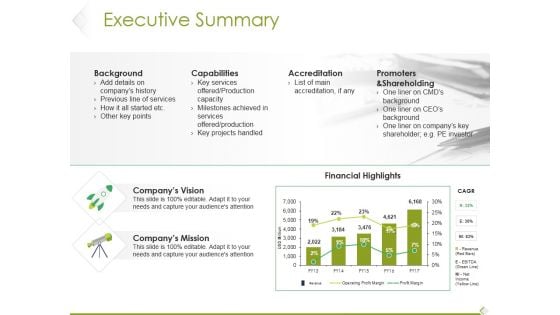
Executive Summary Ppt PowerPoint Presentation Model Show
This is a executive summary ppt powerpoint presentation model show. This is a five stage process. The stages in this process are background, capabilities, accreditation, promoters and shareholding, financial highlights.
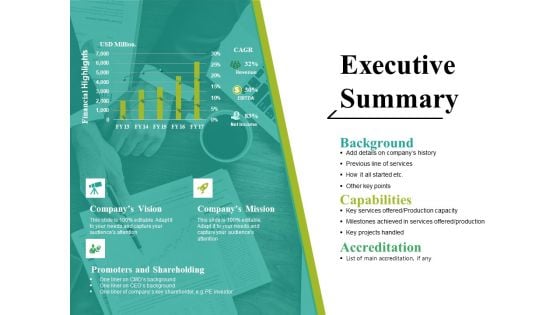
Executive Summary Ppt PowerPoint Presentation Summary Themes
This is a executive summary ppt powerpoint presentation summary themes. This is a three stage process. The stages in this process are background, capabilities, accreditation, company s vision, promoters and shareholding.
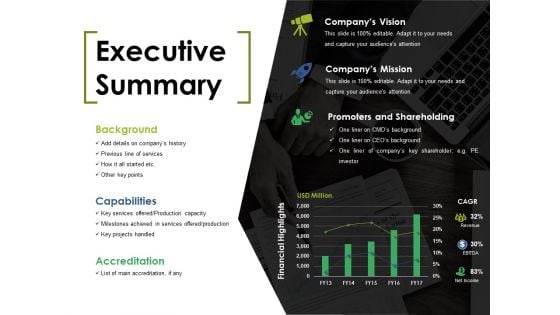
Executive Summary Ppt PowerPoint Presentation Summary Grid
This is a executive summary ppt powerpoint presentation summary grid. This is a three stage process. The stages in this process are background, capabilities, accreditation, company s mission, promoters and shareholding.
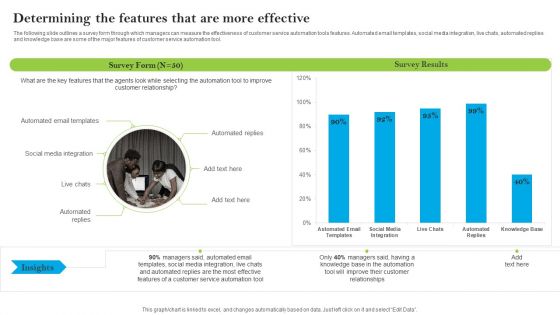
Introducing AI Tools Determining The Features That Are More Effective Ideas PDF
The following slide outlines a survey form through which managers can measure the effectiveness of customer service automation tools features. Automated email templates, social media integration, live chats, automated replies and knowledge base are some of the major features of customer service automation tool. Slidegeeks is here to make your presentations a breeze with Introducing AI Tools Determining The Features That Are More Effective Ideas PDF With our easy-to-use and customizable templates, you can focus on delivering your ideas rather than worrying about formatting. With a variety of designs to choose from, youre sure to find one that suits your needs. And with animations and unique photos, illustrations, and fonts, you can make your presentation pop. So whether youre giving a sales pitch or presenting to the board, make sure to check out Slidegeeks first.
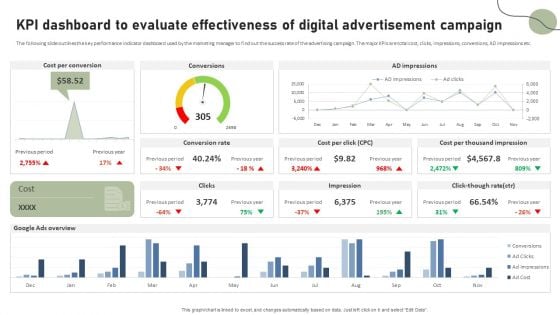
KPI Dashboard To Evaluate Effectiveness Of Digital Advertisement Campaign Pictures PDF
The following slide outlines the key performance indicator dashboard used by the marketing manager to find out the success rate of the advertising campaign. The major KPIs are total cost, clicks, impressions, conversions, AD impressions etc. Do you have to make sure that everyone on your team knows about any specific topic I yes, then you should give KPI Dashboard To Evaluate Effectiveness Of Digital Advertisement Campaign Pictures PDF a try. Our experts have put a lot of knowledge and effort into creating this impeccable KPI Dashboard To Evaluate Effectiveness Of Digital Advertisement Campaign Pictures PDF. You can use this template for your upcoming presentations, as the slides are perfect to represent even the tiniest detail. You can download these templates from the Slidegeeks website and these are easy to edit. So grab these today.
Cyber Security Event And Incident Flow Diagram Icons PDF
This slide represents the flow diagram showing the procedure of managing cyber security incidents in order to minimize its impact on business operations. It starts with detection of cyber security incident and ends with response to crisis situation. Coming up with a presentation necessitates that the majority of the effort goes into the content and the message you intend to convey. The visuals of a PowerPoint presentation can only be effective if it supplements and supports the story that is being told. Keeping this in mind our experts created Cyber Security Event And Incident Flow Diagram Icons PDF to reduce the time that goes into designing the presentation. This way, you can concentrate on the message while our designers take care of providing you with the right template for the situation.
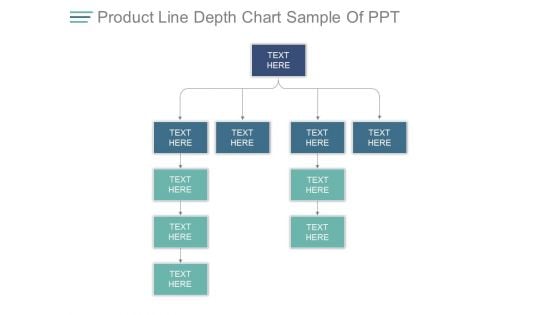
Product Line Depth Chart Sample Of Ppt
This is a product line depth chart sample of ppt. This is a three stage process. The stages in this process are business, marketing, management, process.
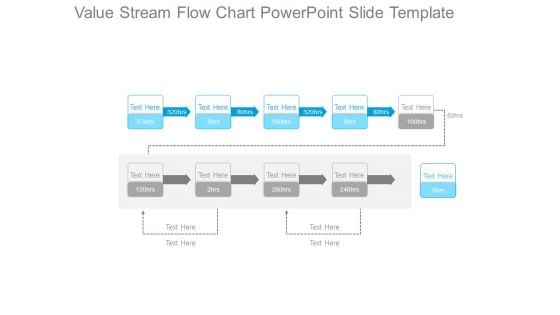
Value Stream Flow Chart Powerpoint Slide Template
This is a value stream flow chart powerpoint slide template. This is a ten stage process. The stages in this process are business, marketing, process, arrows, management.
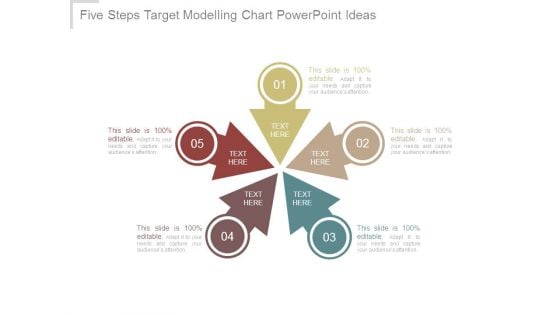
Five Steps Target Modelling Chart Powerpoint Ideas
This is a five steps target modelling chart powerpoint ideas. This is a five stage process. The stages in this process are business, process, marketing, arrows, management.
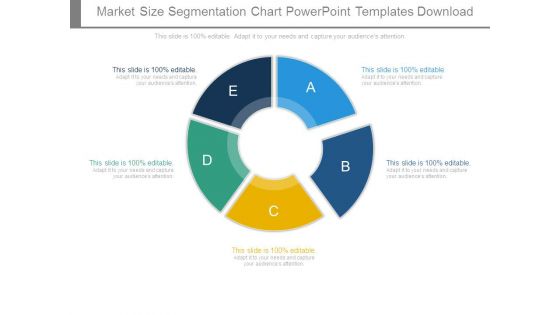
Market Size Segmentation Chart Powerpoint Templates Download
This is a market size segmentation chart powerpoint templates download. This is a five stage process. The stages in this process are business, marketing, process, management, diagram.
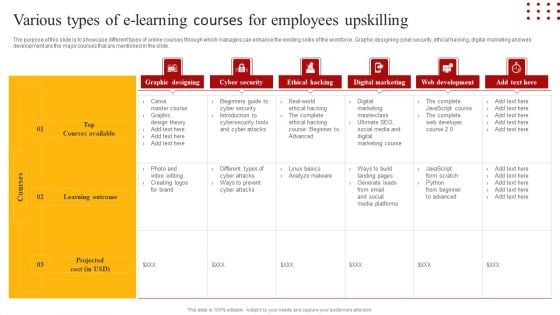
Staff Retention Techniques To Minimize Hiring Expenses Various Types Of E-Learning Courses For Employees Slides PDF
The purpose of this slide is to showcase different types of online courses through which managers can enhance the existing skills of the workforce. Graphic designing cyber security, ethical hacking, digital marketing and web development are the major courses that are mentioned in the slide. Retrieve professionally designed Staff Retention Techniques To Minimize Hiring Expenses Various Types Of E-Learning Courses For Employees Slides PDF to effectively convey your message and captivate your listeners. Save time by selecting pre made slideshows that are appropriate for various topics, from business to educational purposes. These themes come in many different styles, from creative to corporate, and all of them are easily adjustable and can be edited quickly. Access them as PowerPoint templates or as Google Slides themes. You do not have to go on a hunt for the perfect presentation because Slidegeeks got you covered from everywhere.
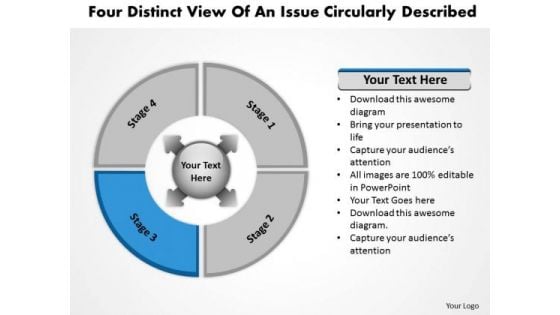
View Of An Issue Circularly Described Flow Diagram PowerPoint Templates
We present our view of an issue circularly described Flow Diagram PowerPoint templates.Use our Business PowerPoint Templates because it will demonstrate the strength of character under severe stress. Shine the torch ahead and bring the light to shine on all. Download our Arrows PowerPoint Templates because you have the people in place, selected the team leaders and all are raring to go. Use our Shapes PowerPoint Templates because this shows plans to increase the strength of your business relationships. Download and present our Process and Flows PowerPoint Templates because it can illustrate your chain of ideas focusing on that aspect or resource in order to enhance the quality of your product. Download and present our Circle Charts PowerPoint Templates because our template will illustrate what you want to say.Use these PowerPoint slides for presentations relating to 4, Abstract, Arrow, Blank, Business, Chart, Circular, Circulation, Concept, Conceptual, Cycle, Design, Diagram, Empty, Executive, Four, Icon, Illustration, Management, Model, Numbers, Organization, Procedure, Process, Resource, Sequence, Sequential, Strategy, Template. The prominent colors used in the PowerPoint template are Blue, Gray, Black. Customers tell us our view of an issue circularly described Flow Diagram PowerPoint templates are Magical. PowerPoint presentation experts tell us our Chart PowerPoint templates and PPT Slides are Flirty. We assure you our view of an issue circularly described Flow Diagram PowerPoint templates are Cheerful. Customers tell us our Business PowerPoint templates and PPT Slides are Wonderful. We assure you our view of an issue circularly described Flow Diagram PowerPoint templates are Dynamic. People tell us our Concept PowerPoint templates and PPT Slides are Functional. Create the aroma with our View Of An Issue Circularly Described Flow Diagram PowerPoint Templates. Draw the crowds to your views.
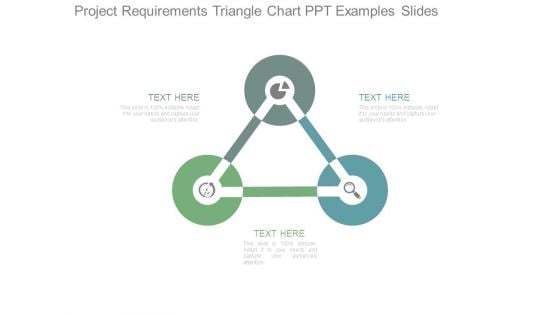
Project Requirements Triangle Chart Ppt Examples Slides
This is a project requirements triangle chart ppt examples slides. This is a three stage process. The stages in this process are triangle, business, marketing, management, icons, diagram.
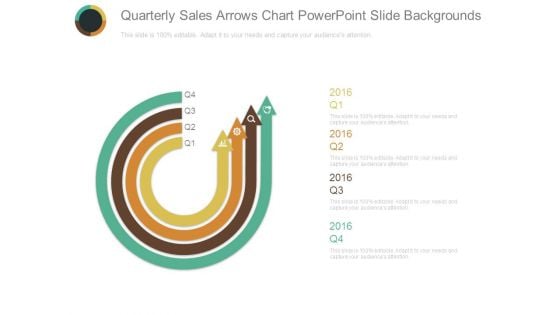
Quarterly Sales Arrows Chart Powerpoint Slide Backgrounds
This is a quarterly sales arrows chart powerpoint slide backgrounds. This is a four stage process. The stages in this process are arrows, business, management, marketing, icons.

Win Loss Analysis Chart Powerpoint Presentation Templates
This is a win loss analysis chart powerpoint presentation templates. This is a two stage process. The stages in this process are business, management, marketing, sales, funnel.
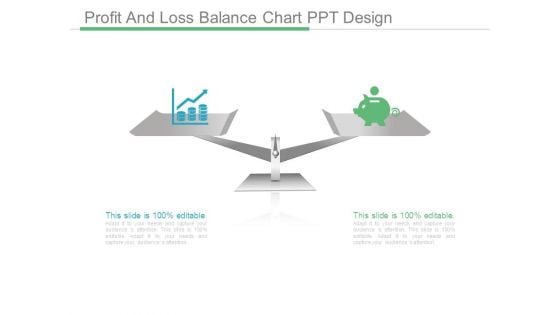
Profit And Loss Balance Chart Ppt Design
This is a profit and loss balance chart ppt design. This is a two stage process. The stages in this process are business, management, success, presentation, marketing.
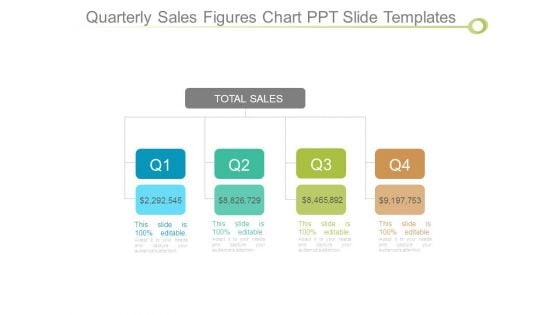
Quarterly Sales Figures Chart Ppt Slide Templates
This is a quarterly sales figures chart ppt slide templates. This is a four stage process. The stages in this process are total sales, business, management, marketing, success.
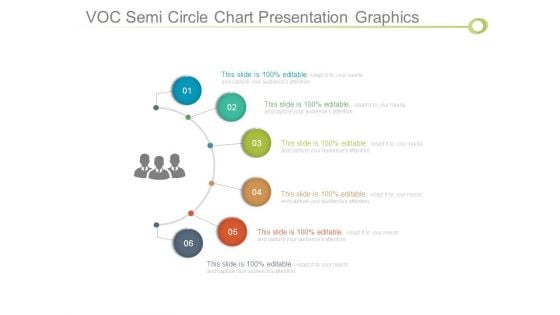
Voc Semi Circle Chart Presentation Graphics
This is a voc semi circle chart presentation graphics. This is a six stage process. The stages in this process are business, marketing, management, success, diagram.
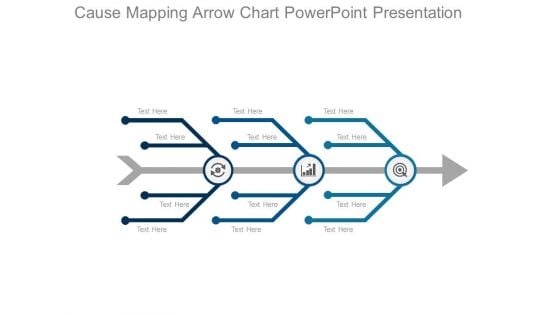
Cause Mapping Arrow Chart Powerpoint Presentation
This is a cause mapping arrow chart powerpoint presentation. This is a three stage process. The stages in this process are arrows, icons, business, marketing, management.
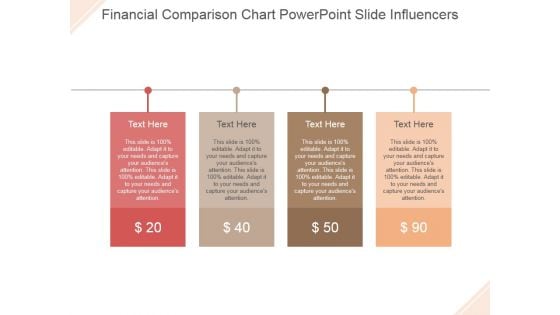
Financial Comparison Chart Ppt PowerPoint Presentation Styles
This is a financial comparison chart ppt powerpoint presentation styles. This is a four stage process. The stage in this process are dollar, business, symbol, finance, management.
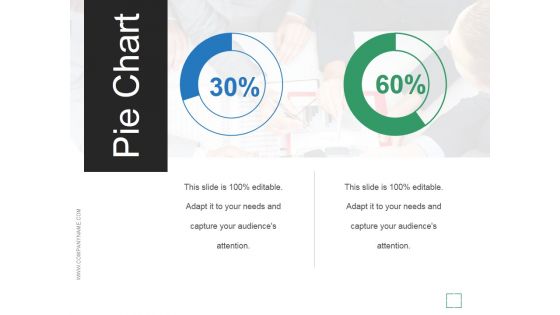
Pie Chart Ppt PowerPoint Presentation Sample
This is a pie chart ppt powerpoint presentation sample. This is a two stage process. The stages in this process are business, marketing, finance, analysis, management.
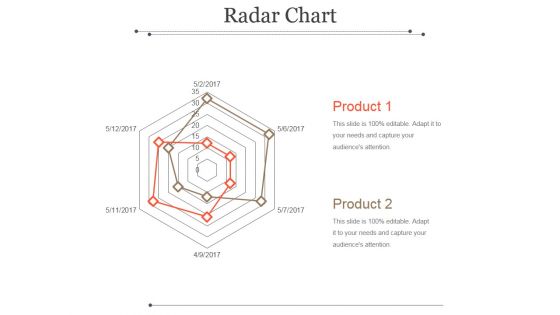
Radar Chart Ppt PowerPoint Presentation Show
This is a radar chart ppt powerpoint presentation show. This is a two stage process. The stages in this process are product, management, business, marketing.

Hierarchy Chart Ppt PowerPoint Presentation Show
This is a hierarchy chart ppt powerpoint presentation show. This is a three stage process. The stages in this process are business, marketing, management, step.
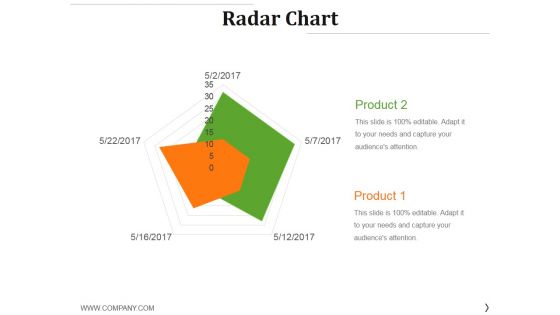
Radar Chart Ppt PowerPoint Presentation Slides Graphics
This is a radar chart ppt powerpoint presentation slides graphics. This is a two stage process. The stages in this process are product, shapes, management, business, marketing.


 Continue with Email

 Home
Home


