Stakeholder Management Plan
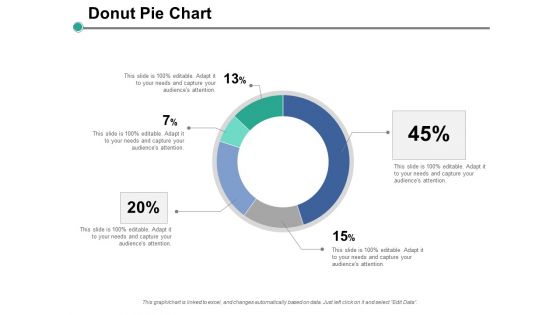
Donut Pie Chart Ppt PowerPoint Presentation Layouts Backgrounds
This is a donut pie chart ppt powerpoint presentation layouts backgrounds. This is a five stage process. The stages in this process are finance, marketing, management, investment, analysis.
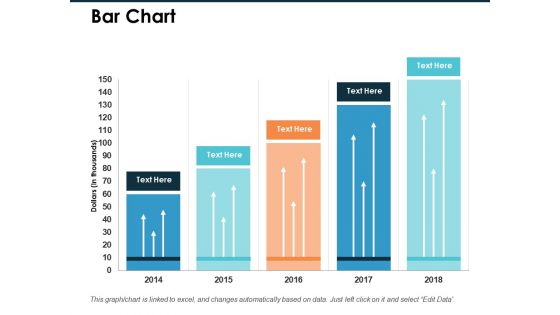
Bar Chart Financial Ppt PowerPoint Presentation Pictures Files
This is a bar chart financial ppt powerpoint presentation pictures files. This is a five stage process. The stages in this process are finance, marketing, management, investment, analysis.
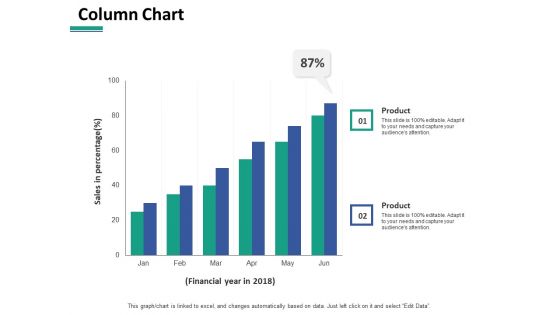
Column Chart Ppt PowerPoint Presentation Slides Example Topics
This is a column chart ppt powerpoint presentation slides example topics. This is a two stage process. The stages in this process are finance, marketing, management, investment, analysis.
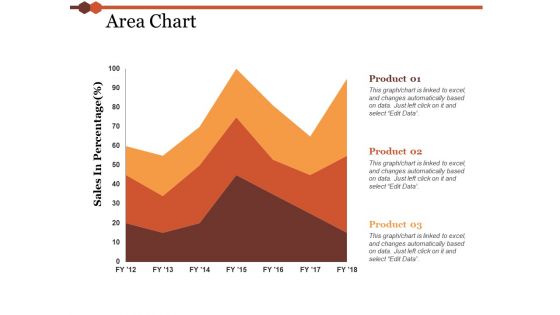
Area Chart Financial Ppt PowerPoint Presentation Layouts Slide
This is a area chart financial ppt powerpoint presentation layouts slide. This is a three stage process. The stages in this process are finance, marketing, management, investment, analysis.
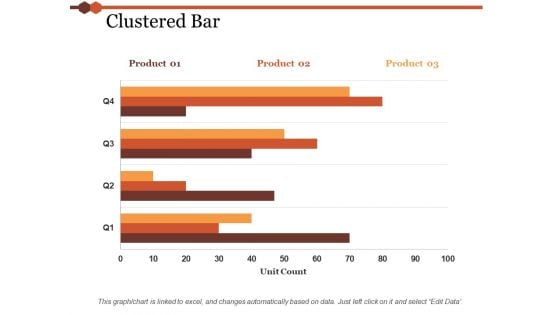
Clustered Bar Chart Ppt PowerPoint Presentation Layouts Infographics
This is a clustered bar chart ppt powerpoint presentation layouts infographics. This is a three stage process. The stages in this process are finance, marketing, management, investment, analysis.
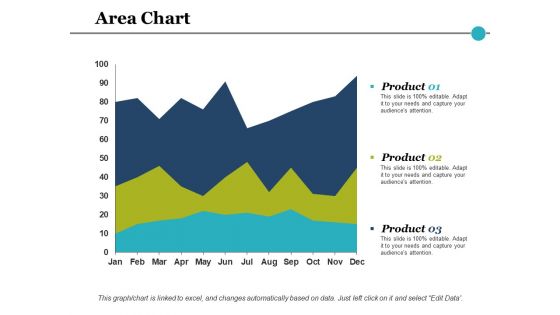
Area Chart Financial Ppt PowerPoint Presentation Inspiration Topics
This is a area chart financial ppt powerpoint presentation inspiration topics. This is a three stage process. The stages in this process are finance, marketing, management, investment, analysis.
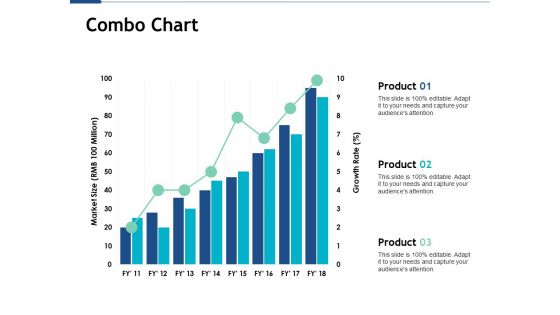
Combo Chart Ppt PowerPoint Presentation Visual Aids Pictures
This is a combo chart ppt powerpoint presentation visual aids pictures. This is a three stage process. The stages in this process are finance, marketing, management, investment, analysis.
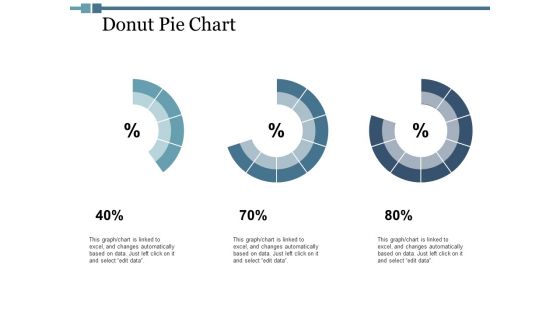
Donut Pie Chart Ppt PowerPoint Presentation Inspiration Brochure
This is a donut pie chart ppt powerpoint presentation inspiration brochure. This is a three stage process. The stages in this process are finance, marketing, management, investment, analysis.
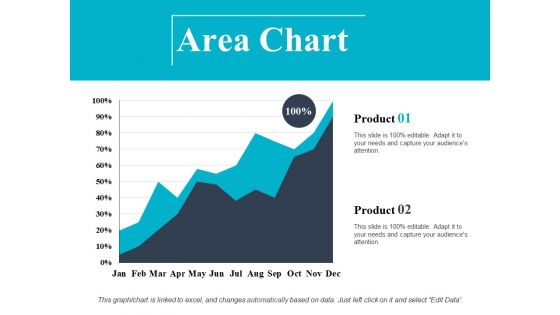
Area Chart Finance Ppt PowerPoint Presentation Slides Layout
This is a area chart finance ppt powerpoint presentation slides layout. This is a two stage process. The stages in this process are finance, marketing, management, investment, analysis.
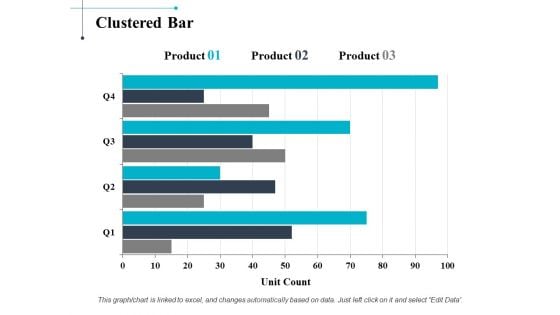
Clustered Bar Chart Ppt PowerPoint Presentation Professional Good
This is a clustered bar chart ppt powerpoint presentation professional good. This is a three stage process. The stages in this process are finance, marketing, management, investment, analysis.
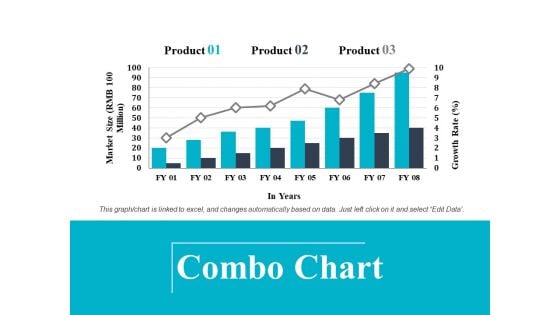
Combo Chart Ppt PowerPoint Presentation Visual Aids Files
This is a combo chart ppt powerpoint presentation visual aids files. This is a three stage process. The stages in this process are finance, marketing, management, investment, analysis.

Area Chart Financial Ppt PowerPoint Presentation Model Background
This is a area chart financial ppt powerpoint presentation model background. This is a two stage process. The stages in this process are finance, marketing, management, investment, analysis.
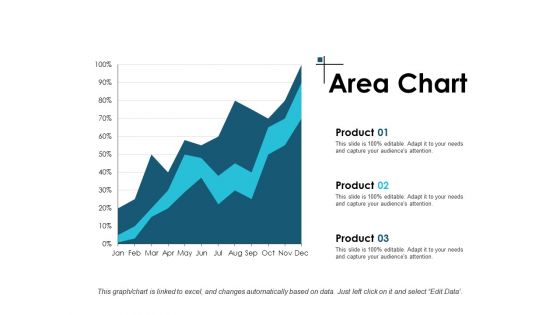
Area Chart Investment Ppt PowerPoint Presentation Infographics Summary
This is a area chart investment ppt powerpoint presentation infographics summary. This is a three stage process. The stages in this process are finance, marketing, management, investment, analysis.
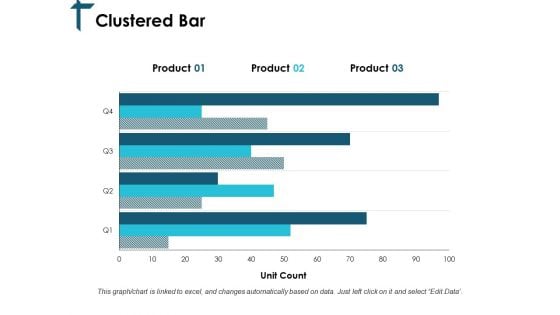
Clustered Bar Chart Ppt PowerPoint Presentation Summary Templates
This is a clustered bar chart ppt powerpoint presentation summary templates. This is a three stage process. The stages in this process are finance, marketing, management, investment, analysis.
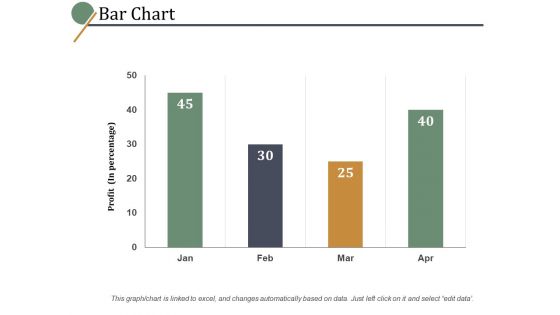
Bar Chart Slide Ppt PowerPoint Presentation Summary Example File
This is a bar chart slide ppt powerpoint presentation summary example file. This is a three stage process. The stages in this process are percentage, marketing, management, product.
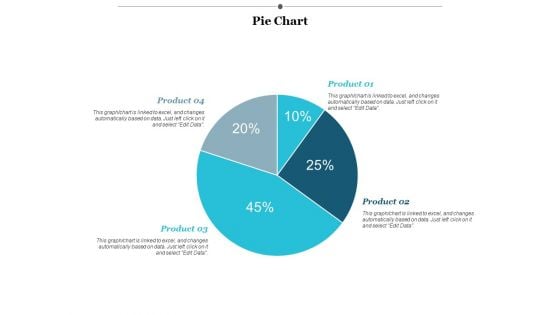
Pie Chart Finance Ppt PowerPoint Presentation Layouts Designs
This is a Pie Chart Finance Ppt PowerPoint Presentation Layouts Designs. This is a four stage process. The stages in this process are finance, marketing, management, investment, analysis.
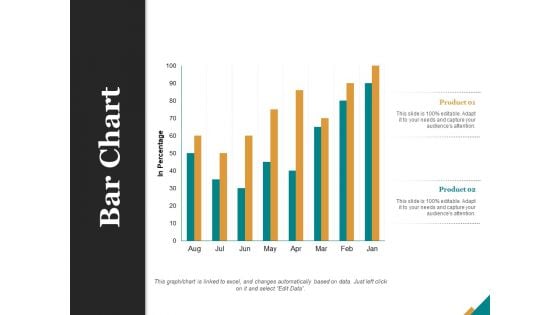
Bar Chart Finance Ppt PowerPoint Presentation Portfolio Model
This is a bar chart finance ppt powerpoint presentation portfolio model. This is a two stage process. The stages in this process are finance, marketing, management, investment, analysis.
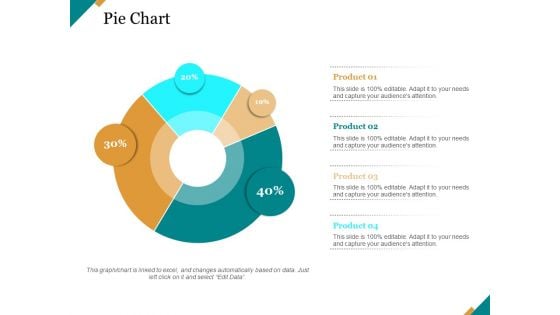
Pie Chart Finance Ppt PowerPoint Presentation Model Ideas
This is a pie chart finance ppt powerpoint presentation model ideas. This is a four stage process. The stages in this process are finance, marketing, management, investment, analysis.
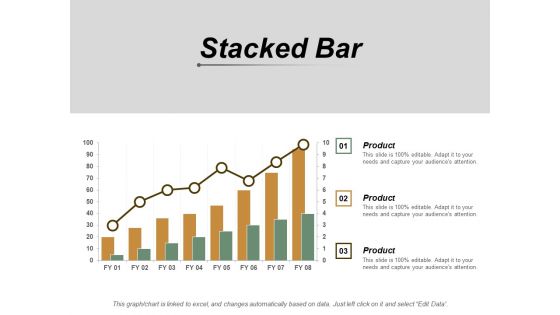
Stacked Bar Chart Ppt PowerPoint Presentation Gallery Outfit
This is a stacked bar chart ppt powerpoint presentation gallery outfit. This is a three stage process. The stages in this process are finance, marketing, management, investment, analysis.
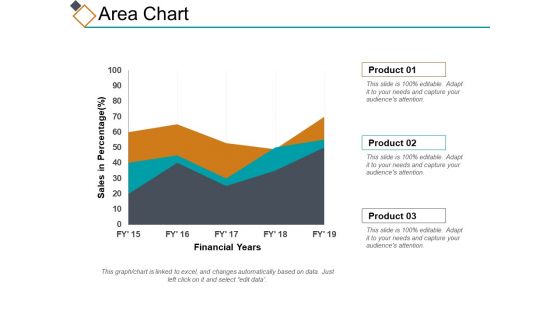
Area Chart Ppt PowerPoint Presentation File Design Inspiration
This is a area chart ppt powerpoint presentation file design inspiration. This is a three stage process. The stages in this process are percentage, product, business, management, marketing.
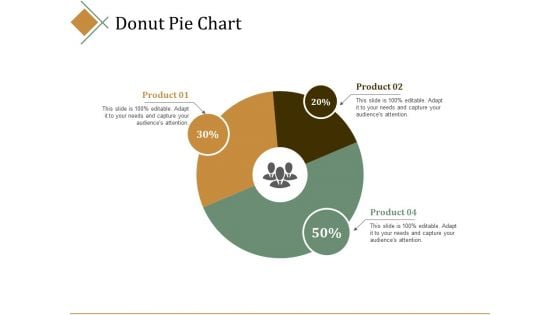
Donut Pie Chart Ppt PowerPoint Presentation Inspiration Elements
This is a donut pie chart ppt powerpoint presentation inspiration elements. This is a three stage process. The stages in this process are percentage, product, business, management, marketing.

Combo Chart Financial Ppt PowerPoint Presentation Layouts Layouts
This is a combo chart financial ppt powerpoint presentation layouts layouts. This is a three stage process. The stages in this process are finance, marketing, management, investment, analysis.
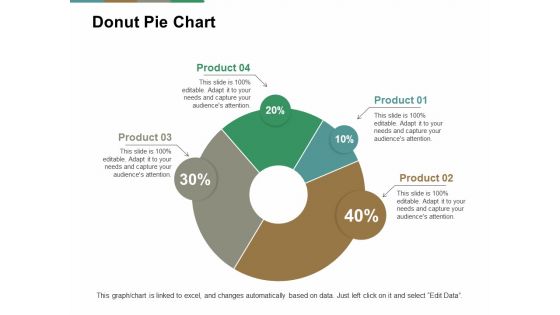
Donut Pie Chart Ppt PowerPoint Presentation Pictures Summary
This is a donut pie chart ppt powerpoint presentation pictures summary. This is a four stage process. The stages in this process are percentage, product, business, management, marketing.

Area Chart Financial Ppt PowerPoint Presentation Styles Templates
This is a area chart financial ppt powerpoint presentation styles templates. This is a two stage process. The stages in this process are finance, marketing, management, investment, analysis.
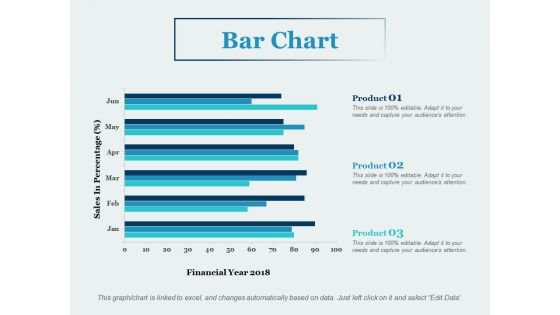
Bar Chart Product Ppt PowerPoint Presentation Summary Diagrams
This is a bar chart product ppt powerpoint presentation summary diagrams. This is a three stage process. The stages in this process are business, management, marketing, percentage, product.
Pie Chart Product Ppt PowerPoint Presentation Gallery Icon
This is a pie chart product ppt powerpoint presentation gallery icon. This is a five stage process. The stages in this process are percentage, product, management, marketing, business.
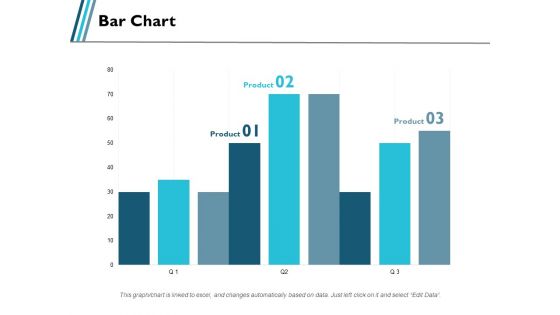
Bar Chart Product Ppt PowerPoint Presentation Portfolio Visuals
This is a bar chart product ppt powerpoint presentation portfolio visuals. This is a three stage process. The stages in this process are business, management, marketing, percentage, product.
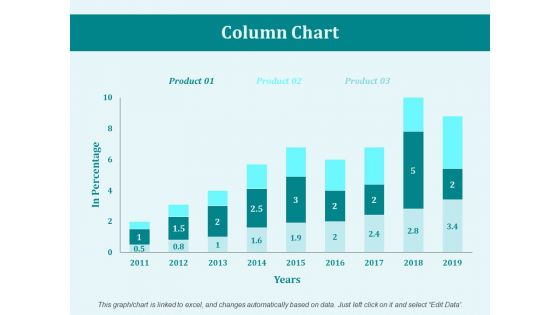
Column Chart Marketing Ppt PowerPoint Presentation Summary Images
This is a column chart marketing ppt powerpoint presentation summary images. This is a three stage process. The stages in this process are business, management, marketing, product, percentage.
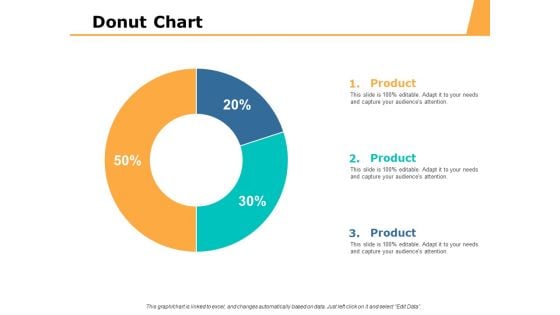
Pie Chart Percentage Ppt PowerPoint Presentation Inspiration Slides
This is a pie chart percentage ppt powerpoint presentation inspiration slides. This is a three stage process. The stages in this process are finance, marketing, management, investment, analysis.
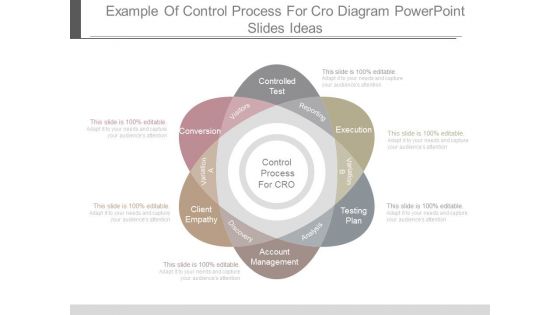
Example Of Control Process For Cro Diagram Powerpoint Slides Ideas
This is a example of control process for cro diagram powerpoint slides ideas. This is a six stage process. The stages in this process are control process for cro, controlled test, execution, testing plan, account management, client empathy, conversion, reporting, variation b, analysis, discovery, variation a, visitors.
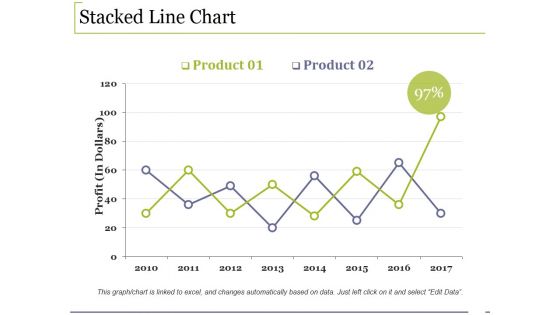
Stacked Line Chart Ppt PowerPoint Presentation Ideas Styles
This is a stacked line chart ppt powerpoint presentation ideas styles. This is a two stage process. The stages in this process are growth, finance, analysis, management, business.
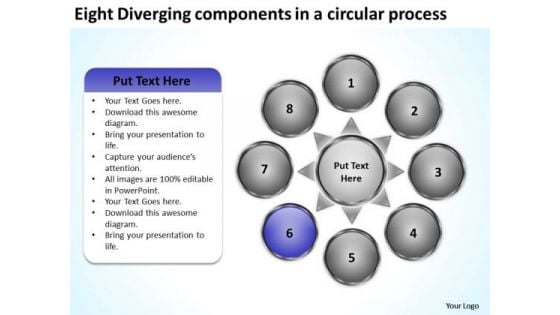
Eight Diverging Components A Circular Process Circular Pie Chart PowerPoint Slides
We present our eight diverging components a circular process Circular Pie Chart PowerPoint Slides.Use our Business PowerPoint Templates because you can Flutter your wings and enchant the world. Impress them with the innate attractiveness of your thoughts and words. Use our Circle Charts PowerPoint Templates because you are the star of your enlightened team. Download and present our Arrows PowerPoint Templates because the key criteria for necessary infrastructure are at your finger tips. Radiate this knowledge to the group and see their eyes light up. Use our Shapes PowerPoint Templates because the structure of our templates allows you to effectively highlight the key issues concerning the growth of your business. Use our Flow charts PowerPoint Templates because this template contains the material to highlight the key issues of your presentation.Use these PowerPoint slides for presentations relating to Arrows, blank, business, central, centralized, chart, circle, circular, circulation concept, conceptual, converging, design, diagram, empty, executive, icon, idea illustration, management, map, mapping, moa, model, numbers, organization outwards, pointing, procedure, process, radial, radiating, relationship, resource sequence, sequential, seven, square, strategy, template. The prominent colors used in the PowerPoint template are Blue, Gray, White. Presenters tell us our eight diverging components a circular process Circular Pie Chart PowerPoint Slides are Breathtaking. Presenters tell us our business PowerPoint templates and PPT Slides have awesome images to get your point across. PowerPoint presentation experts tell us our eight diverging components a circular process Circular Pie Chart PowerPoint Slides are Adorable. We assure you our chart PowerPoint templates and PPT Slides are Excellent. Customers tell us our eight diverging components a circular process Circular Pie Chart PowerPoint Slides are Fabulous. People tell us our chart PowerPoint templates and PPT Slides are effectively colour coded to prioritise your plans They automatically highlight the sequence of events you desire. Supervise your team with our Eight Diverging Components A Circular Process Circular Pie Chart PowerPoint Slides. Download without worries with our money back guaranteee.
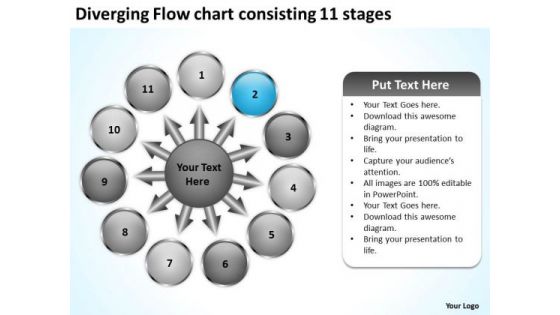
Diverging Flow Chart Consisting 11 Stages Business Circular Process Diagram PowerPoint Slides
We present our diverging flow chart consisting 11 stages business Circular Process Diagram PowerPoint Slides.Download our Business PowerPoint Templates because spell out your advertising plans to increase market share. The feedback has been positive and productive. Download our Circle Charts PowerPoint Templates because this amazing layout demonstrates how they all combine to form the final product. Use our Arrows PowerPoint Templates because this diagram helps you to harness the opportunities, celebrate your performance till date and focus on greater growth and expansion in coming years. Download and present our Shapes PowerPoint Templates because there is a crucial aspect that requires extra attention. Present our Flow charts PowerPoint Templates because knowledge is power goes the popular saying.Use these PowerPoint slides for presentations relating to Arrows, blank, business, central, centralized, chart, circle, circular, circulation concept, conceptual, converging, design, diagram, empty, executive, icon, idea illustration, management, map, mapping, moa, model, numbers, organization outwards, pointing, procedure, process, radial, radiating, relationship, resource sequence, sequential, seven, square, strategy, template. The prominent colors used in the PowerPoint template are Blue, Gray, White. Presenters tell us our diverging flow chart consisting 11 stages business Circular Process Diagram PowerPoint Slides are Detailed. Presenters tell us our business PowerPoint templates and PPT Slides are Luxuriant. PowerPoint presentation experts tell us our diverging flow chart consisting 11 stages business Circular Process Diagram PowerPoint Slides are Whimsical. We assure you our central PowerPoint templates and PPT Slides are Fun. Customers tell us our diverging flow chart consisting 11 stages business Circular Process Diagram PowerPoint Slides are Elegant. People tell us our central PowerPoint templates and PPT Slides are designed by professionals Convince the audience of the feasibility of your ideas. Ensure comprehension with our Diverging Flow Chart Consisting 11 Stages Business Circular Process Diagram PowerPoint Slides.
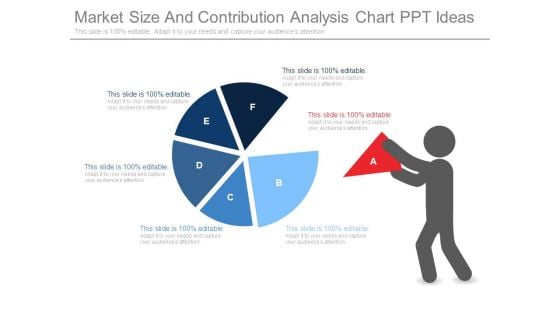
Market Size And Contribution Analysis Chart Ppt Ideas
This is a market size and contribution analysis chart ppt ideas. This is a six stage process. The stages in this process are business, marketing, contribution, management, ideas.
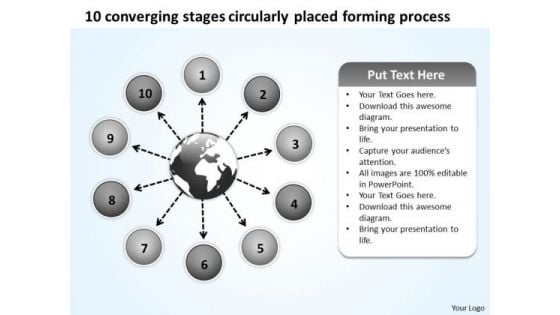
Circularly Placed Forming Process Relative Flow Arrow Diagram PowerPoint Templates
We present our circularly placed forming process Relative Flow Arrow Diagram PowerPoint templates.Present our Process and flows PowerPoint Templates because you know what it takes to keep it fit and healthy. Download our Business PowerPoint Templates because this template can project the path to sucess that you have charted. Download and present our Marketing PowerPoint Templates because Your success is our commitment. Our PowerPoint Templates and Slides will ensure you reach your goal. Present our Flow charts PowerPoint Templates because it can illustrate your chain of ideas focusing on that aspect or resource in order to enhance the quality of your product. Use our Shapes PowerPoint Templates because this layout helps you to see satisfaction spread across the room as they unravel your gifted views.Use these PowerPoint slides for presentations relating to Arrows, business, central, centralized, chart, circle, circular, circulation, concept, conceptual, converging, design, diagram, executive, icon, idea, illustration, management, mapping, model, numbers, organization, outwards, pointing, procedure, process, radial, radiating, relationship, resource, sequence, sequential, seven, square, strategy. The prominent colors used in the PowerPoint template are Purple, White, Gray. People tell us our circularly placed forming process Relative Flow Arrow Diagram PowerPoint templates are Swanky. We assure you our circle PowerPoint templates and PPT Slides are Clever. PowerPoint presentation experts tell us our circularly placed forming process Relative Flow Arrow Diagram PowerPoint templates are Majestic. You can be sure our circular PowerPoint templates and PPT Slides are Flirty. Professionals tell us our circularly placed forming process Relative Flow Arrow Diagram PowerPoint templates are readymade to fit into any presentation structure. Use our centralized PowerPoint templates and PPT Slides are Striking. Oversee plans with our Circularly Placed Forming Process Relative Flow Arrow Diagram PowerPoint Templates. Download without worries with our money back guaranteee.
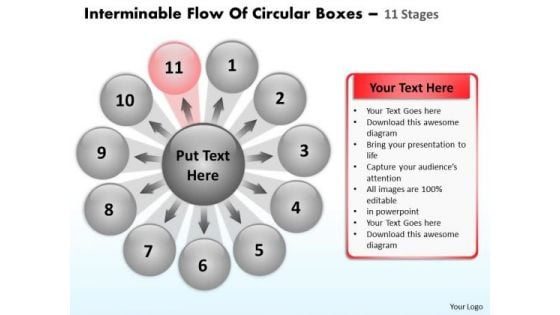
Flow Of Circular Boxes 11 Stages Process Diagram PowerPoint Slides
We present our flow of circular boxes 11 stages Process Diagram PowerPoint Slides.Use our Arrows PowerPoint Templates because clear thnking is your strength, transmit your thoughts to your eager team. Present our Circle Charts PowerPoint Templates because this an appropriate template to get your ideas across to your target audience. Download our Process and Flows PowerPoint Templates because chain reactions are the element of teamwork which add value to your efforts. Use our Business PowerPoint Templates because Our PowerPoint Templates and Slides are designed to help you succeed. They have all the ingredients you need. Use our Shapes PowerPoint Templates because you have the ideas and plans on how to achieve success.Use these PowerPoint slides for presentations relating to Arrows, Blank, Business, Central, Centralized, Chart, Circle, Circular, Circulation, Concept, Conceptual, Converging, Design, Diagram, Empty, Executive, Icon, Idea, Illustration, Management, Map, Mapping, Moa, Model, Numbers, Organization, Outwards, Pointing, Procedure, Process, Radial, Radiating, Relationship, Resource, Sequence, Sequential, Seven, Square, Strategy. The prominent colors used in the PowerPoint template are Red, Gray, Black. Professionals tell us our flow of circular boxes 11 stages Process Diagram PowerPoint Slides will impress their bosses and teams. You can be sure our Circular PowerPoint templates and PPT Slides are Beautiful. Customers tell us our flow of circular boxes 11 stages Process Diagram PowerPoint Slides are Zippy. Professionals tell us our Chart PowerPoint templates and PPT Slides are Fancy. People tell us our flow of circular boxes 11 stages Process Diagram PowerPoint Slides are Nostalgic. People tell us our Circle PowerPoint templates and PPT Slides are designed by a team of presentation professionals. Present like a wizard with our Flow Of Circular Boxes 11 Stages Process Diagram PowerPoint Slides. You will come out on top.
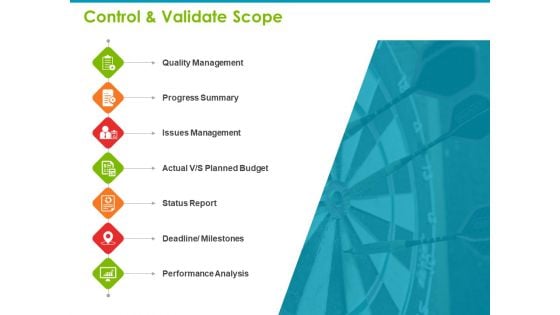
Project Capabilities Control And Validate Scope Ppt Summary Visuals PDF
Presenting this set of slides with name project capabilities control and validate scope ppt summary visuals pdf. This is a seven stage process. The stages in this process are quality management, progress summary, issues management, status report, performance analysis, deadline or milestones. This is a completely editable PowerPoint presentation and is available for immediate download. Download now and impress your audience.
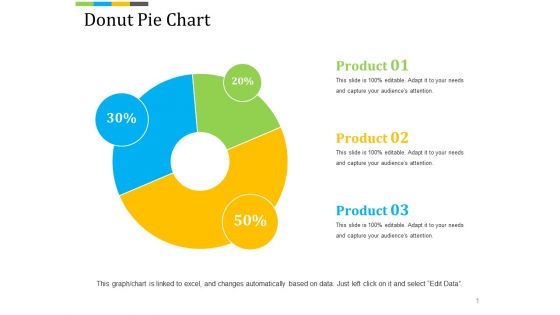
Donut Pie Chart Ppt PowerPoint Presentation Slides Outfit
This is a donut pie chart ppt powerpoint presentation slides outfit. This is a three stage process. The stages in this process are product, percentage, business, process, management.
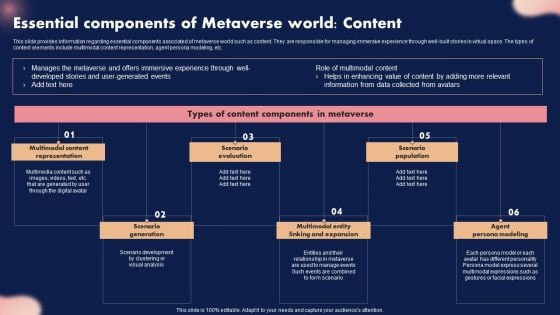
Essential Components Of Metaverse World Content Ppt Show Background Images PDF
This slide provides information regarding essential components associated of metaverse world such as content. They are responsible for managing immersive experience through well-built stories in virtual space. The types of content elements include multimodal content representation, agent persona modeling, etc. If you are looking for a format to display your unique thoughts, then the professionally designed Essential Components Of Metaverse World Content Ppt Show Background Images PDF is the one for you. You can use it as a Google Slides template or a PowerPoint template. Incorporate impressive visuals, symbols, images, and other charts. Modify or reorganize the text boxes as you desire. Experiment with shade schemes and font pairings. Alter, share or cooperate with other people on your work. Download Essential Components Of Metaverse World Content Ppt Show Background Images PDF and find out how to give a successful presentation. Present a perfect display to your team and make your presentation unforgettable.
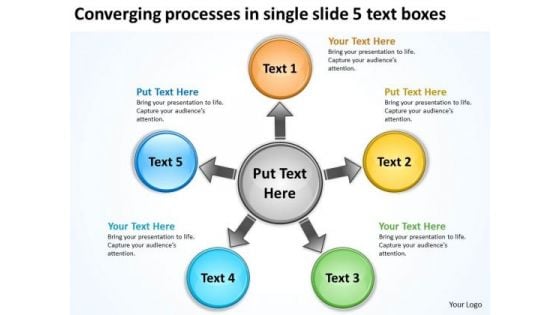
Processes In Single Slide 5 Text Boxes Arrows Diagram Software PowerPoint Templates
We present our processes in single slide 5 text boxes Arrows Diagram Software PowerPoint templates.Download our Circle Charts PowerPoint Templates because it expound on why you have discarded some plans as you went along to the apex and came out with the final selection which you know will make you and your team shine. Present our Arrows PowerPoint Templates because colours generate instant reactions in our brains. Use our Business PowerPoint Templates because it illustrates the city with a lasting tryst with resilience. You epitomise the qualities that give your city its fame. Download and present our Shapes PowerPoint Templates because it provides visual depictions of the flow of activities. Present our Flow Charts PowerPoint Templates because this slide brings grey areas to the table and explain in detail you assessment of the need for care to ensure continued smooth progress.Use these PowerPoint slides for presentations relating to 5, abstract, arrows, blank, business, central, centralized, chart, circle, circular, circulation, concept, conceptual, converging, design, diagram, empty, executive, five, icon, idea, illustration, management, map, mapping, mba, model, numbers, organization, outwards, pointing, procedure, process, radial, radiating, relationship, resource, sequence, sequential, square, strategy, template. The prominent colors used in the PowerPoint template are Yellow, Green, Blue. Customers tell us our processes in single slide 5 text boxes Arrows Diagram Software PowerPoint templates are Stunning. PowerPoint presentation experts tell us our circle PowerPoint templates and PPT Slides are Sparkling. People tell us our processes in single slide 5 text boxes Arrows Diagram Software PowerPoint templates are One-of-a-kind. People tell us our business PowerPoint templates and PPT Slides are visually appealing. Customers tell us our processes in single slide 5 text boxes Arrows Diagram Software PowerPoint templates are Stylish. People tell us our central PowerPoint templates and PPT Slides are Dynamic. Experience the striking graphics of our Processes In Single Slide 5 Text Boxes Arrows Diagram Software PowerPoint Templates. They bring good quality to the table.
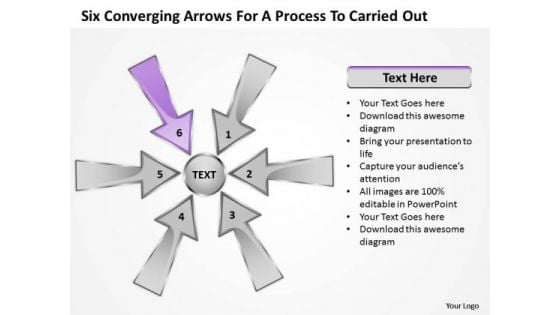
Six Coverging Arrows For Process To Carried Out Circular Cycle PowerPoint Templates
We present our six coverging arrows for process to carried out circular Cycle PowerPoint templates.Present our Arrows PowerPoint Templates because you have the plans ready for them to absorb and understand. Use our Circle Charts PowerPoint Templates because it highlights the important timelines and milestones of this exciting journey. Download our Shapes PowerPoint Templates because you can illustrate your ideas and imprint them in the minds of your team with this template. Present our Business PowerPoint Templates because this template helps you to grab the attention of your listeners. Present our Flow Charts PowerPoint Templates because getting it done may not be enough.Use these PowerPoint slides for presentations relating to 6, abstract, arrows, blank, business, central, centralized, chart, circle, circular, circulation, concept, conceptual, converging, design, diagram, empty, executive, icon, idea, illustration, management, map, mapping, mba, model, numbers, organization, outwards, pointing, procedure, process, radial, radiating, relationship, resource, sequence, sequential, six, square, strategy, template. The prominent colors used in the PowerPoint template are Purple, Gray, Black. Presenters tell us our six coverging arrows for process to carried out circular Cycle PowerPoint templates are Bold. The feedback we get is that our business PowerPoint templates and PPT Slides are Fantastic. Presenters tell us our six coverging arrows for process to carried out circular Cycle PowerPoint templates are Flirty. You can be sure our business PowerPoint templates and PPT Slides are Stylish. People tell us our six coverging arrows for process to carried out circular Cycle PowerPoint templates are Fashionable. PowerPoint presentation experts tell us our central PowerPoint templates and PPT Slides are Spectacular. Battle it out with our Six Coverging Arrows For Process To Carried Out Circular Cycle PowerPoint Templates. You will come out on top.
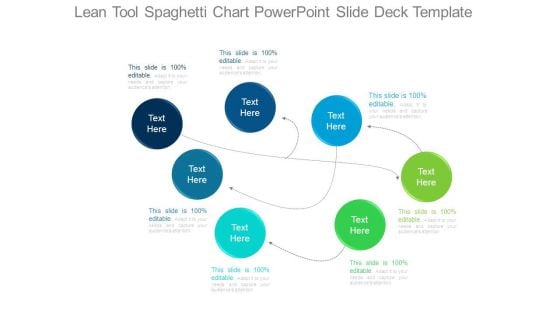
Lean Tool Spaghetti Chart Powerpoint Slide Deck Template
This is a lean tool spaghetti chart powerpoint slide deck template. This is a seven stage process. The stages in this process are business, marketing, arrows, management.
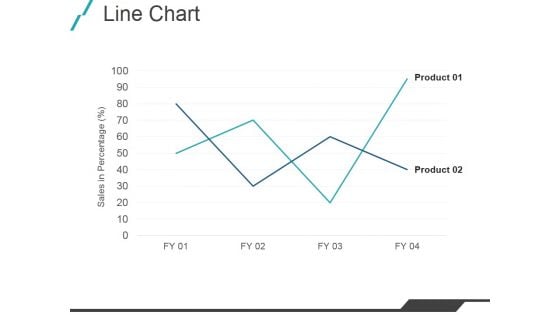
Line Chart Ppt PowerPoint Presentation Model Example File
This is a line chart ppt powerpoint presentation model example file. This is a two stage process. The stages in this process are product, graph, growth, management.

Line Chart Ppt PowerPoint Presentation Professional Slide Download
This is a line chart ppt powerpoint presentation professional slide download. This is a two stage process. The stages in this process are growth, business, management, marketing.
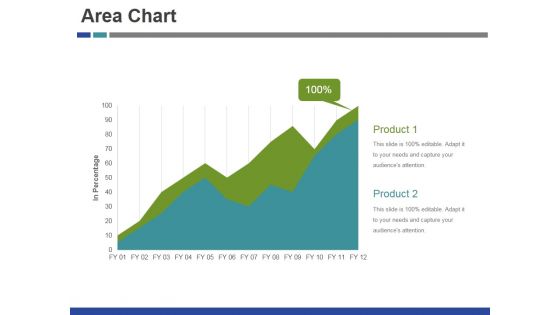
Area Chart Ppt PowerPoint Presentation Infographic Template Show
This is a area chart ppt powerpoint presentation infographic template show. This is a two stage process. The stages in this process are product, marketing, management, business, success.
Bar Chart Ppt PowerPoint Presentation Icon Infographic Template
This is a bar chart ppt powerpoint presentation icon infographic template. This is a nine stage process. The stages in this process are product, marketing, management, business, success.
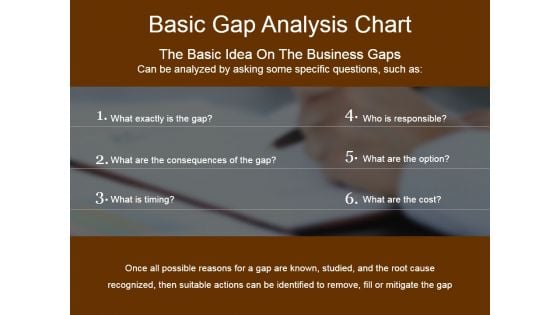
Basic Gap Analysis Chart Ppt PowerPoint Presentation Professional Portfolio
This is a basic gap analysis chart ppt powerpoint presentation professional portfolio. This is a six stage process. The stages in this process are business, step, marketing, management.
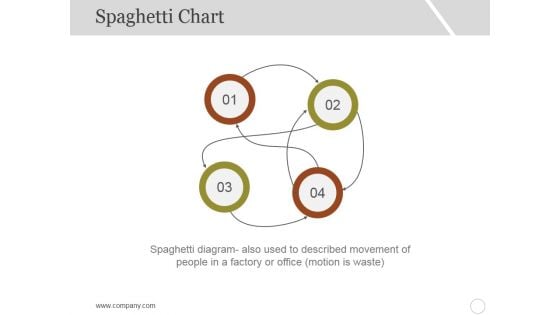
Spaghetti Chart Template 2 Ppt PowerPoint Presentation Inspiration Professional
This is a spaghetti chart template 2 ppt powerpoint presentation inspiration professional. This is a four stage process. The stages in this process are business, marketing, management, numbering.
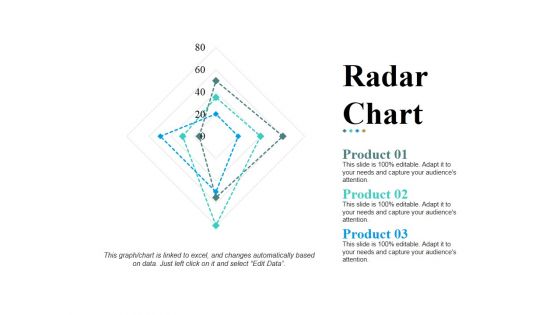
Radar Chart Ppt PowerPoint Presentation Pictures Design Templates
This is a radar chart ppt powerpoint presentation pictures design templates. This is a three stage process. The stages in this process are product, shapes, business, marketing, management.
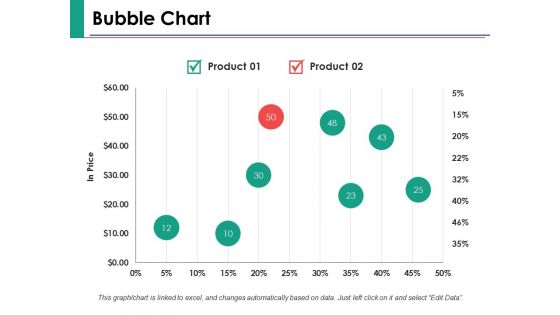
Bubble Chart Finance Ppt PowerPoint Presentation Ideas Graphics
This is a bubble chart finance ppt powerpoint presentation ideas graphics. This is a two stage process. The stages in this process are finance, marketing, management, investment, analysis.
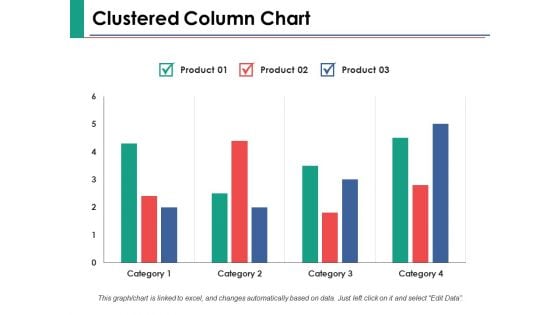
Clustered Column Chart Ppt PowerPoint Presentation Show Samples
This is a clustered column chart ppt powerpoint presentation show samples. This is a three stage process. The stages in this process are finance, marketing, management, investment, analysis.
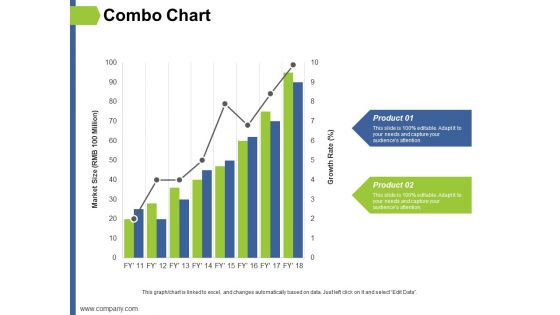
Combo Chart Ppt PowerPoint Presentation Layouts Example Topics
This is a combo chart ppt powerpoint presentation layouts example topics. This is a two stage process. The stages in this process are finance, marketing, management, investment, analysis.
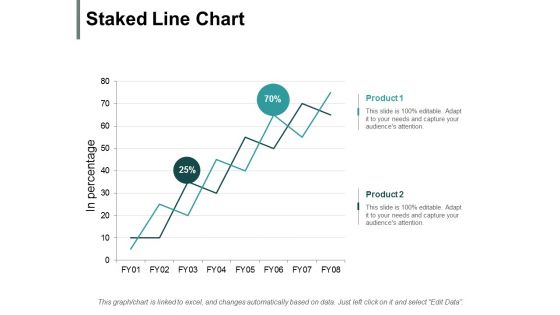
Staked Line Chart Ppt PowerPoint Presentation Ideas Influencers
This is a staked line chart ppt powerpoint presentation ideas influencers. This is a two stage process. The stages in this process are finance, marketing, management, investment, analysis.
Scatter Chart Ppt PowerPoint Presentation Icon Background Images
This is a scatter chart ppt powerpoint presentation icon background images. This is a one stage process. The stages in this process are percentage, product, business, marketing, management.
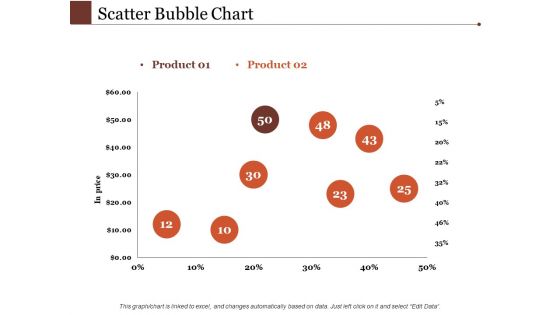
Scatter Bubble Chart Ppt PowerPoint Presentation Inspiration Demonstration
This is a scatter bubble chart ppt powerpoint presentation inspiration demonstration. This is a two stage process. The stages in this process are percentage, product, business, management, marketing.
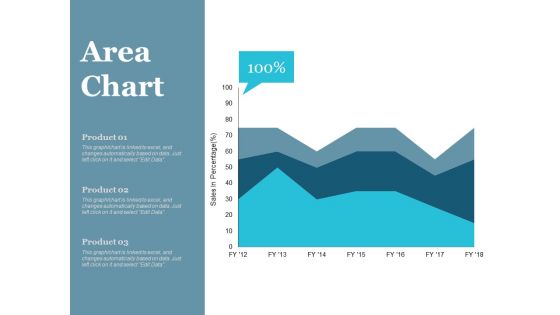
Area Chart Finance Ppt PowerPoint Presentation Infographics Deck
This is a area chart finance ppt powerpoint presentation infographics deck. This is a three stage process. The stages in this process are finance, marketing, management, investment, analysis.
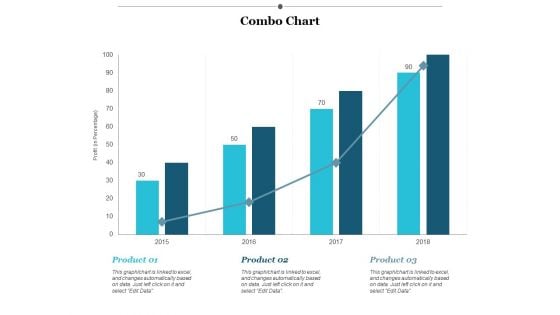
Combo Chart Finance Ppt PowerPoint Presentation Styles Example
This is a combo chart finance ppt powerpoint presentation styles example. This is a three stage process. The stages in this process are finance, marketing, management, investment, analysis.
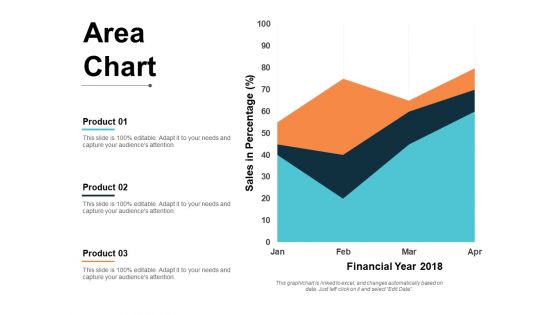
area chart finance ppt powerpoint presentation pictures format
This is a area chart finance ppt powerpoint presentation pictures format. This is a three stage process. The stages in this process are finance, marketing, management, investment, analysis.
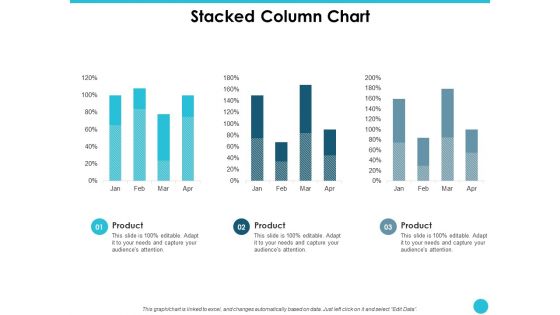
Stacked Column Chart Ppt PowerPoint Presentation Professional Diagrams
This is a stacked column chart ppt powerpoint presentation professional diagrams. This is a three stage process. The stages in this process are percentage, product, management, marketing.
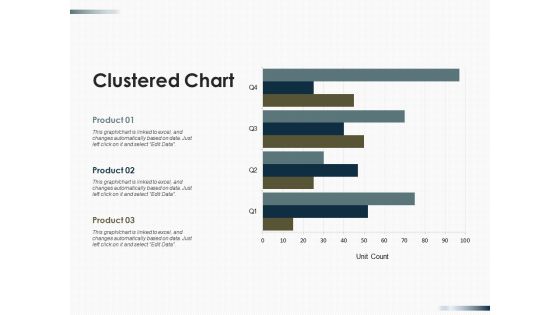
Clustered Chart Finance Ppt PowerPoint Presentation Summary Guide
This is a clustered chart finance ppt powerpoint presentation summary guide. This is a three stage process. The stages in this process are finance, marketing, management, investment, analysis.


 Continue with Email

 Home
Home


