Standards
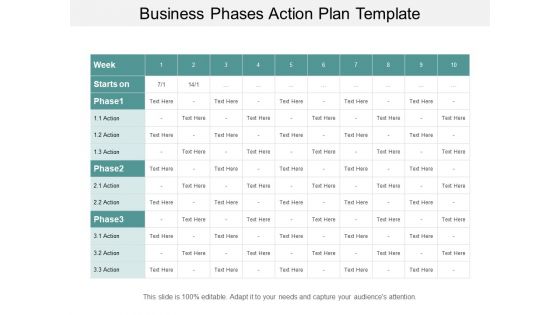
Business Phases Action Plan Template Ppt PowerPoint Presentation Show File Formats
This is a business phases action plan template ppt powerpoint presentation show file formats. This is a three stage process. The stages in this process are hared value, shared merit, shared worth.
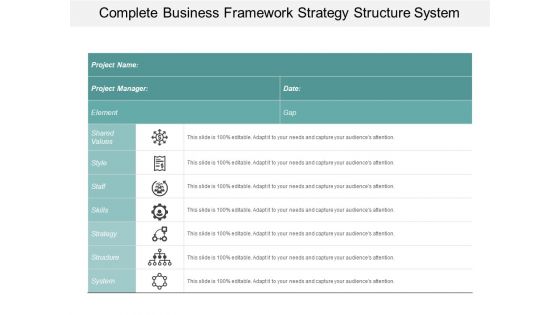
Complete Business Framework Strategy Structure System Ppt PowerPoint Presentation Ideas Templates
This is a complete business framework strategy structure system ppt powerpoint presentation ideas templates. This is a seven stage process. The stages in this process are hared value, shared merit, shared worth.
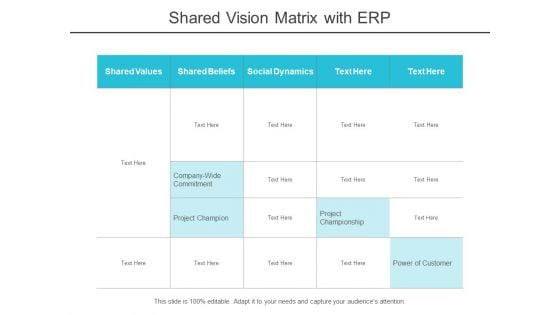
Shared Vision Matrix With Erp Ppt PowerPoint Presentation Infographics Background Images
This is a shared vision matrix with erp ppt powerpoint presentation infographics background images. This is a five stage process. The stages in this process are hared value, shared merit, shared worth.
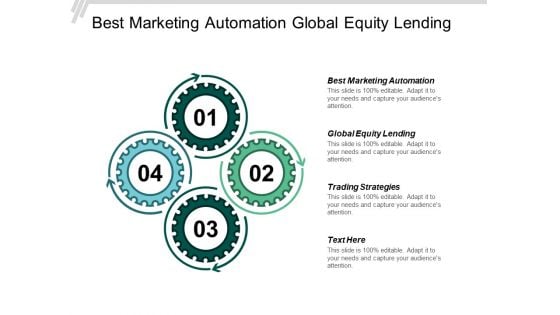
Best Marketing Automation Global Equity Lending Trading Strategies Ppt PowerPoint Presentation Portfolio Diagrams
This is a best marketing automation global equity lending trading strategies ppt powerpoint presentation portfolio diagrams. This is a four stage process. The stages in this process are best marketing automation, global equity lending, trading strategies.
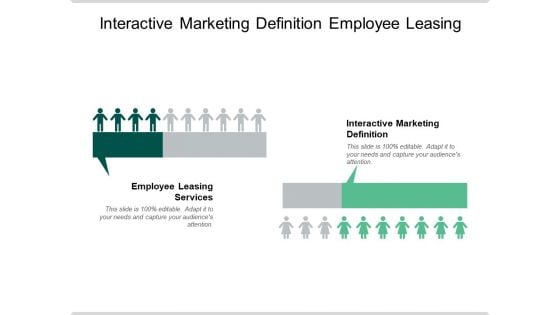
Interactive Marketing Definition Employee Leasing Services Contract Template Ppt PowerPoint Presentation Styles Ideas
This is a interactive marketing definition employee leasing services contract template ppt powerpoint presentation styles ideas. This is a two stage process. The stages in this process are interactive marketing definition, employee leasing services, contract template.
Linking Strategies Web Marketing Plan Business Business Research Ppt PowerPoint Presentation Example File
This is a linking strategies web marketing plan business business research ppt powerpoint presentation example file. This is a one stage process. The stages in this process are linking strategies, web marketing plan, business business research.
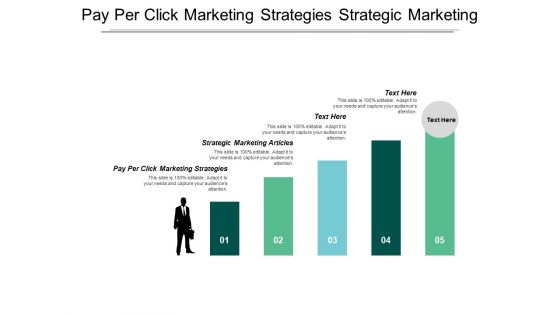
Pay Per Click Marketing Strategies Strategic Marketing Articles Ppt PowerPoint Presentation Pictures Slideshow
This is a pay per click marketing strategies strategic marketing articles ppt powerpoint presentation pictures slideshow. This is a five stage process. The stages in this process are pay per click marketing strategies, strategic marketing articles.
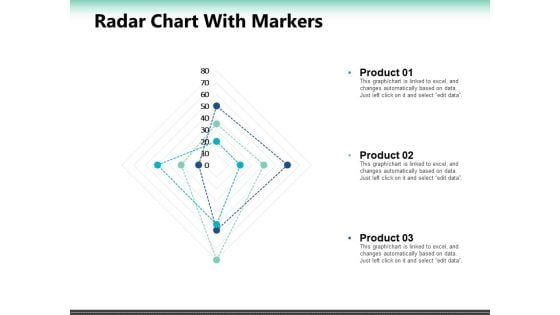
Radar Chart With Markers Ppt PowerPoint Presentation Summary Slide Portrait
This is a radar chart with markers ppt powerpoint presentation summary slide portrait. This is a seven stage process. The stages in this process are percentage, product, business, marketing.
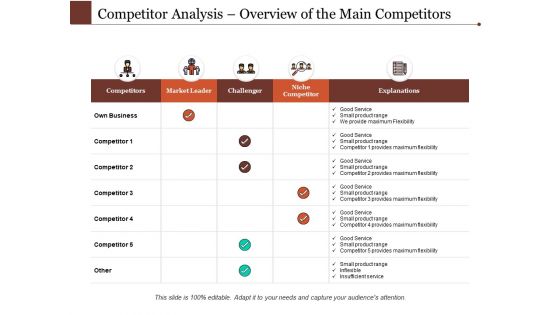
Competitor Analysis Overview Of The Main Competitors Ppt PowerPoint Presentation Model Clipart
This is a competitor analysis overview of the main competitors ppt powerpoint presentation model clipart. This is a five stage process. The stages in this process are competitors, market leader, challenger.
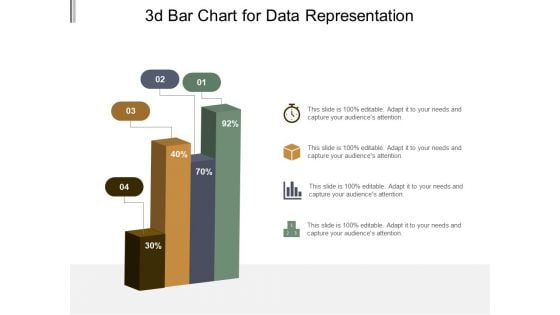
3D Bar Chart For Data Representation Ppt PowerPoint Presentation Model Graphic Tips
This is a 3d bar chart for data representation ppt powerpoint presentation model graphic tips. This is a four stage process. The stages in this process are art, colouring, paint brush.
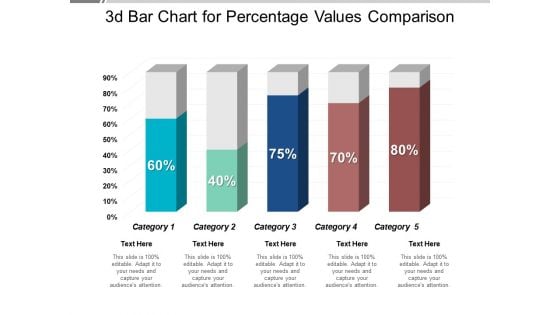
3D Bar Chart For Percentage Values Comparison Ppt PowerPoint Presentation Professional Visual Aids
This is a 3d bar chart for percentage values comparison ppt powerpoint presentation professional visual aids. This is a five stage process. The stages in this process are art, colouring, paint brush.
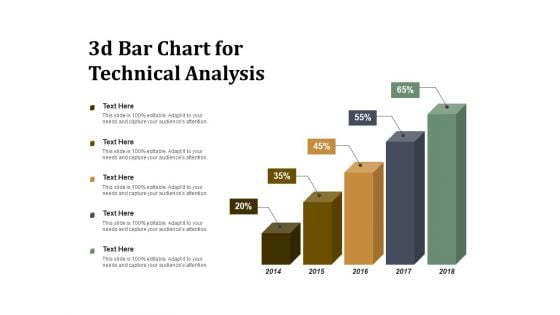
3D Bar Chart For Technical Analysis Ppt PowerPoint Presentation Summary Visuals
This is a 3d bar chart for technical analysis ppt powerpoint presentation summary visuals. This is a five stage process. The stages in this process are art, colouring, paint brush.
3D Bar Chart To Display Data Ppt PowerPoint Presentation Icon Design Inspiration
This is a 3d bar chart to display data ppt powerpoint presentation icon design inspiration. This is a four stage process. The stages in this process are art, colouring, paint brush.
3D Chart For Graphical Display Of Data Ppt PowerPoint Presentation Styles Icon
This is a 3d chart for graphical display of data ppt powerpoint presentation styles icon. This is a four stage process. The stages in this process are art, colouring, paint brush.
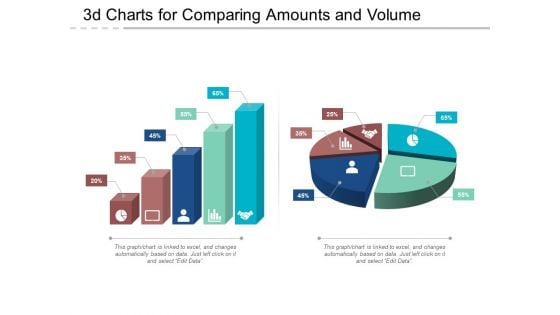
3D Charts For Comparing Amounts And Volume Ppt PowerPoint Presentation Show Deck
This is a 3d charts for comparing amounts and volume ppt powerpoint presentation show deck. This is a five stage process. The stages in this process are art, colouring, paint brush.
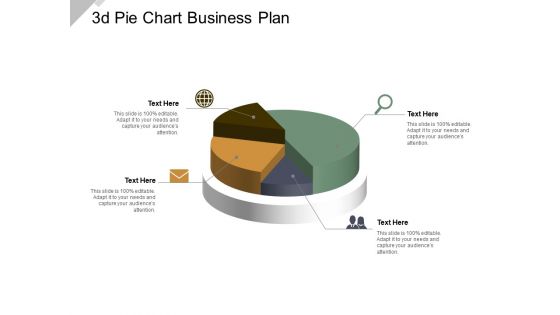
3D Pie Chart Business Plan Ppt PowerPoint Presentation Model Guidelines
This is a 3d pie chart business plan ppt powerpoint presentation model guidelines. This is a four stage process. The stages in this process are art, colouring, paint brush.
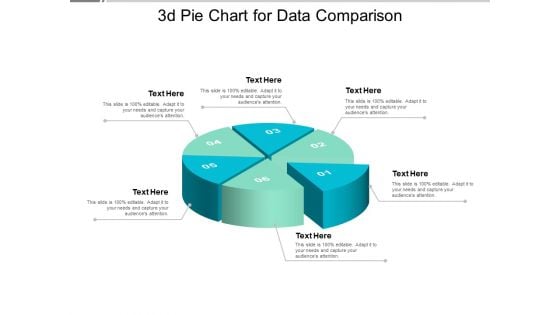
3D Pie Chart For Data Comparison Ppt PowerPoint Presentation Model Design Ideas
This is a 3d pie chart for data comparison ppt powerpoint presentation model design ideas. This is a six stage process. The stages in this process are art, colouring, paint brush.
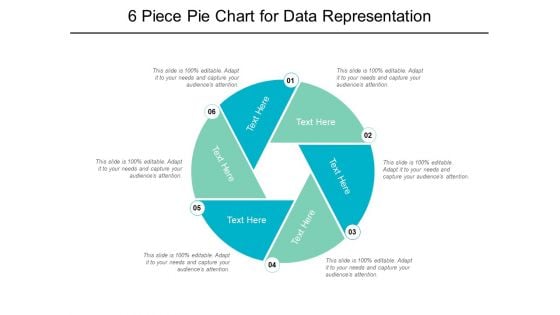
6 Piece Pie Chart For Data Representation Ppt PowerPoint Presentation Professional Brochure
This is a 6 piece pie chart for data representation ppt powerpoint presentation professional brochure. This is a six stage process. The stages in this process are 6 piece pie chart, 6 segment pie chart, 6 parts pie chart.
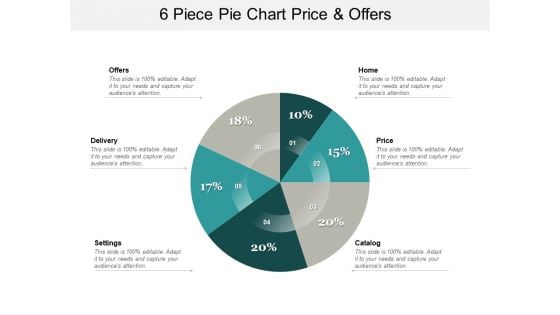
6 Piece Pie Chart Price And Offers Ppt PowerPoint Presentation Ideas Layout
This is a 6 piece pie chart price and offers ppt powerpoint presentation ideas layout. This is a six stage process. The stages in this process are 6 piece pie chart, 6 segment pie chart, 6 parts pie chart.
6 Segments Pie Chart For Data Representation Ppt PowerPoint Presentation Icon Graphics
This is a 6 segments pie chart for data representation ppt powerpoint presentation icon graphics. This is a six stage process. The stages in this process are 6 piece pie chart, 6 segment pie chart, 6 parts pie chart.
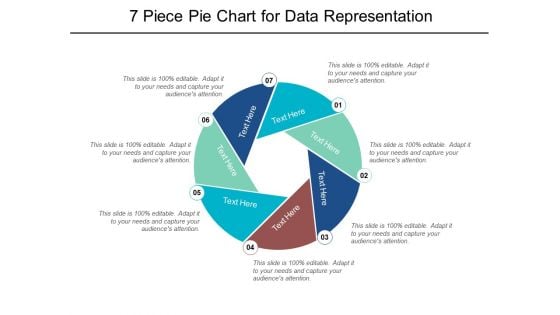
7 Piece Pie Chart For Data Representation Ppt PowerPoint Presentation Portfolio Graphics
This is a 7 piece pie chart for data representation ppt powerpoint presentation portfolio graphics. This is a seven stage process. The stages in this process are 6 piece pie chart, 6 segment pie chart, 6 parts pie chart.
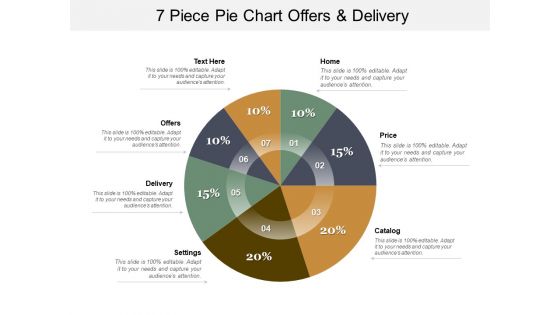
7 Piece Pie Chart Offers And Delivery Ppt PowerPoint Presentation Infographics Samples
This is a 7 piece pie chart offers and delivery ppt powerpoint presentation infographics samples. This is a seven stage process. The stages in this process are 6 piece pie chart, 6 segment pie chart, 6 parts pie chart.
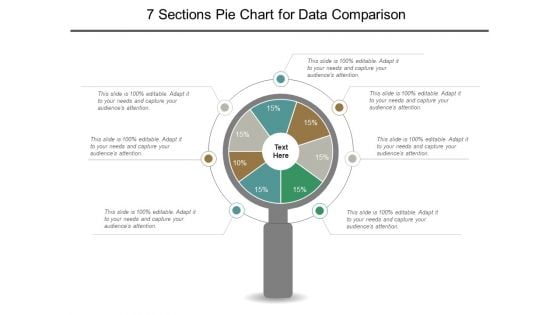
7 Sections Pie Chart For Data Comparison Ppt PowerPoint Presentation File Graphics Template
This is a 7 sections pie chart for data comparison ppt powerpoint presentation file graphics template. This is a seven stage process. The stages in this process are 6 piece pie chart, 6 segment pie chart, 6 parts pie chart.
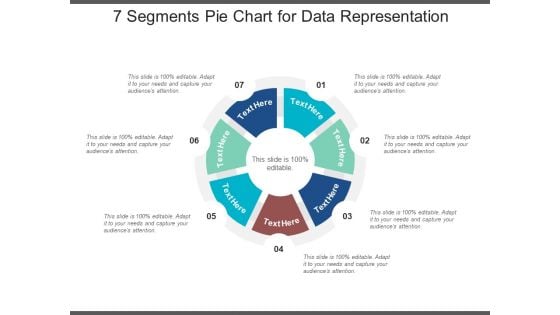
7 Segments Pie Chart For Data Representation Ppt PowerPoint Presentation Styles Summary
This is a 7 segments pie chart for data representation ppt powerpoint presentation styles summary. This is a seven stage process. The stages in this process are 6 piece pie chart, 6 segment pie chart, 6 parts pie chart.
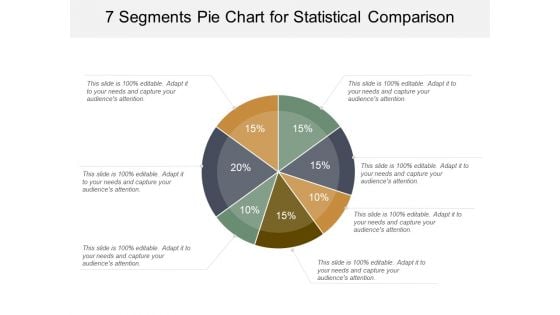
7 Segments Pie Chart For Statistical Comparison Ppt PowerPoint Presentation Gallery Visual Aids
This is a 7 segments pie chart for statistical comparison ppt powerpoint presentation gallery visual aids. This is a seven stage process. The stages in this process are 6 piece pie chart, 6 segment pie chart, 6 parts pie chart.
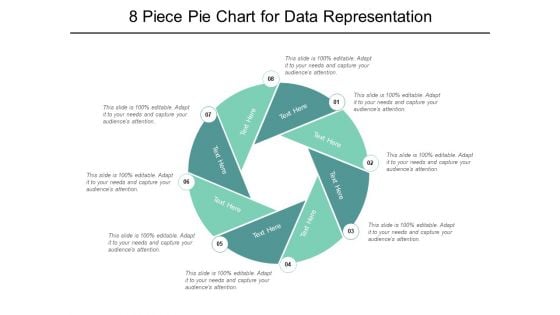
8 Piece Pie Chart For Data Representation Ppt PowerPoint Presentation Ideas
This is a 8 piece pie chart for data representation ppt powerpoint presentation ideas. This is a eight stage process. The stages in this process are 6 piece pie chart, 6 segment pie chart, 6 parts pie chart.

8 Piece Pie Chart Price Offers And Delivery Ppt PowerPoint Presentation Layouts Skills
This is a 8 piece pie chart price offers and delivery ppt powerpoint presentation layouts skills. This is a eight stage process. The stages in this process are 6 piece pie chart, 6 segment pie chart, 6 parts pie chart.
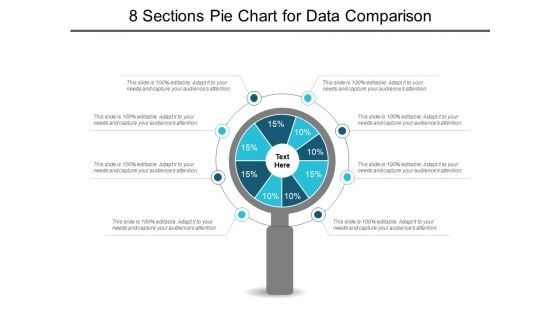
8 Sections Pie Chart For Data Comparison Ppt PowerPoint Presentation Show Slideshow
This is a 8 sections pie chart for data comparison ppt powerpoint presentation show slideshow. This is a eight stage process. The stages in this process are 6 piece pie chart, 6 segment pie chart, 6 parts pie chart.
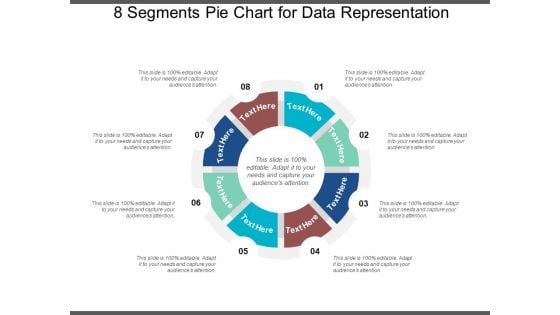
8 Segments Pie Chart For Data Representation Ppt PowerPoint Presentation Infographics Design Templates
This is a 8 segments pie chart for data representation ppt powerpoint presentation infographics design templates. This is a eight stage process. The stages in this process are 6 piece pie chart, 6 segment pie chart, 6 parts pie chart.
Eight Sections Pie Chart For Percentage Data Analysis Ppt PowerPoint Presentation Styles Icons
This is a eight sections pie chart for percentage data analysis ppt powerpoint presentation styles icons. This is a eight stage process. The stages in this process are 6 piece pie chart, 6 segment pie chart, 6 parts pie chart.
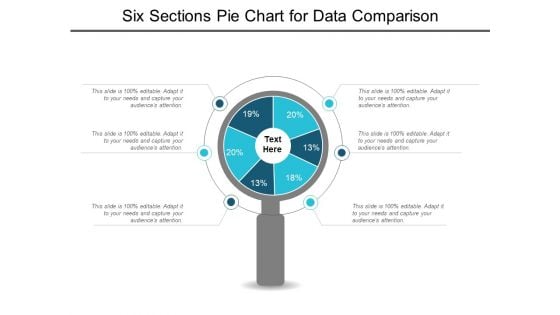
Six Sections Pie Chart For Data Comparison Ppt PowerPoint Presentation Styles Graphics Example
This is a six sections pie chart for data comparison ppt powerpoint presentation styles graphics example. This is a six stage process. The stages in this process are 6 piece pie chart, 6 segment pie chart, 6 parts pie chart.
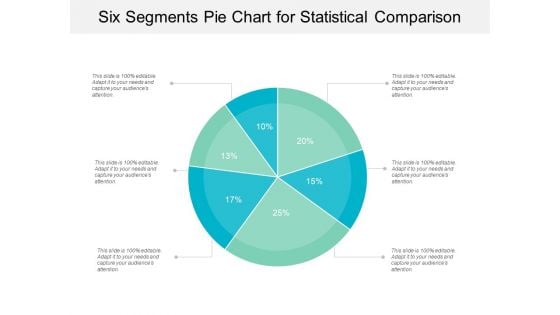
Six Segments Pie Chart For Statistical Comparison Ppt PowerPoint Presentation Gallery Background
This is a six segments pie chart for statistical comparison ppt powerpoint presentation gallery background. This is a six stage process. The stages in this process are 6 piece pie chart, 6 segment pie chart, 6 parts pie chart.
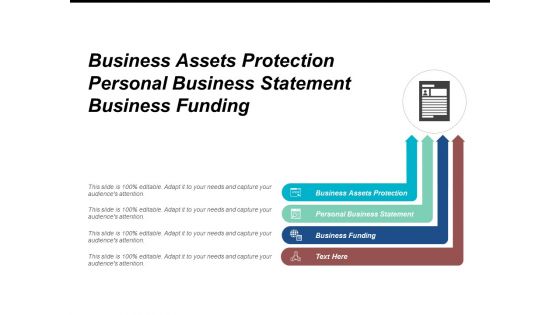
Business Assets Protection Personal Business Statement Business Funding Ppt PowerPoint Presentation Pictures Portfolio
This is a business assets protection personal business statement business funding ppt powerpoint presentation pictures portfolio. This is a four stage process. The stages in this process are business assets protection, personal business statement, business funding.
Business Funding Model Corporate Business Intelligence Operational Performance Ppt PowerPoint Presentation Styles Layout Ideas
This is a business funding model corporate business intelligence operational performance ppt powerpoint presentation styles layout ideas. This is a one stage process. The stages in this process are business funding model, corporate business intelligence, operational performance.
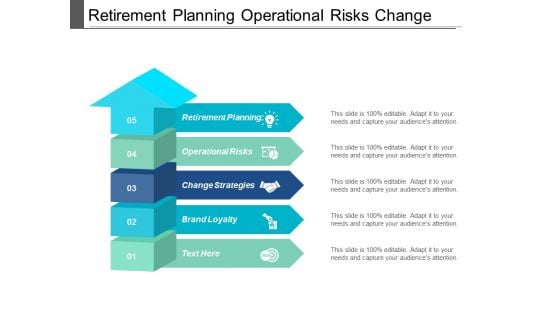
Retirement Planning Operational Risks Change Strategies Brand Loyalty Ppt PowerPoint Presentation Gallery Influencers
This is a retirement planning operational risks change strategies brand loyalty ppt powerpoint presentation gallery influencers. This is a five stage process. The stages in this process are retirement planning, operational risks, change strategies, brand loyalty.
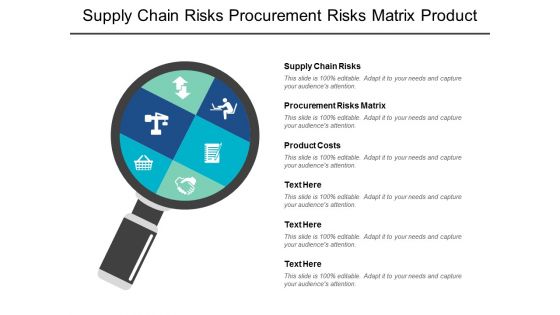
Supply Chain Risks Procurement Risks Matrix Product Costs Ppt PowerPoint Presentation Outline Visuals
This is a supply chain risks procurement risks matrix product costs ppt powerpoint presentation outline visuals. This is a one stage process. The stages in this process are supply chain risks, procurement risks matrix, product costs.
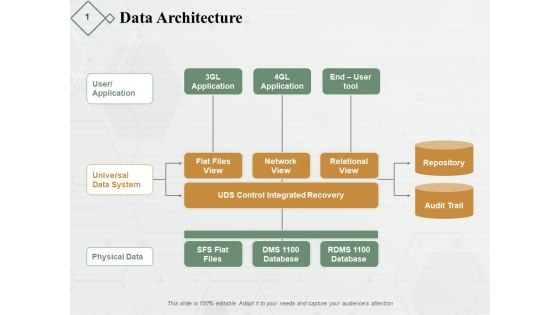
Data Architecture Ppt PowerPoint Presentation Layouts Shapes
This is a data architecture ppt powerpoint presentation layouts shapes. This is a three stage process. The stages in this process are network view, repository, audit trail, physical data, flat files view.
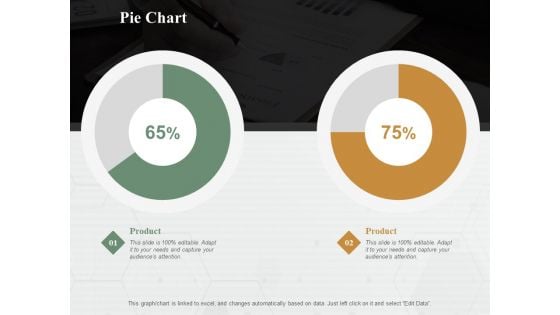
Pie Chart Finance Ppt PowerPoint Presentation Diagram Lists
This is a pie chart finance ppt powerpoint presentation diagram lists. This is a two stage process. The stages in this process are pie chart, finance, marketing, analysis, business.
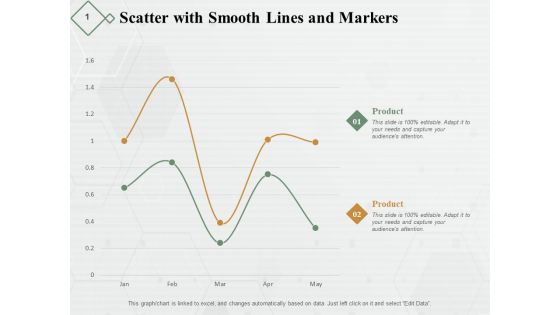
Scatter With Smooth Lines And Markers Ppt PowerPoint Presentation Diagram Lists
This is a scatter with smooth lines and markers ppt powerpoint presentation diagram lists. This is a two stage process. The stages in this process are finance, marketing, analysis, business, investment.
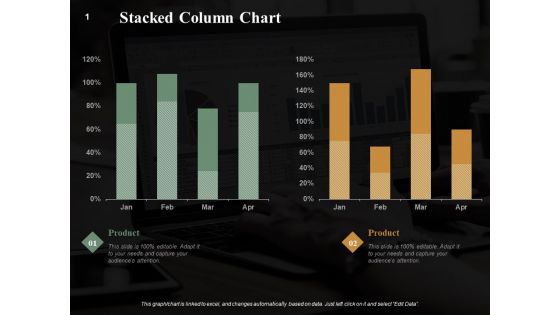
Stacked Column Chart Finance Ppt PowerPoint Presentation Summary Graphics Example
This is a stacked column chart finance ppt powerpoint presentation summary graphics example. This is a two stage process. The stages in this process are stacked column chart, marketing, analysis, business, investment.
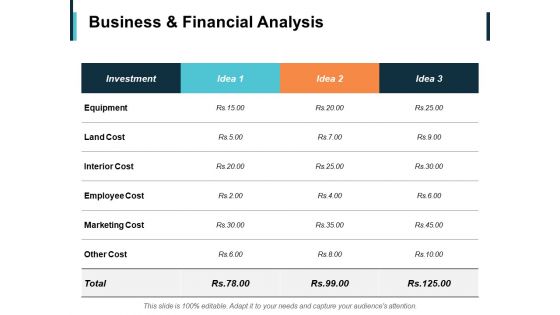
Business And Financial Analysis Ppt PowerPoint Presentation Styles Summary
This is a business and financial analysis ppt powerpoint presentation styles summary. This is a four stage process. The stages in this process are investment, equipment, marketing cost, employee cost, interior cost.
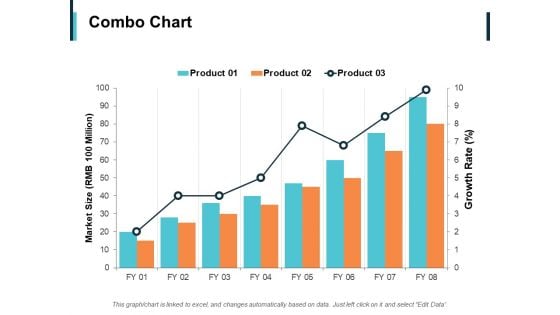
Combo Chart Finance Ppt PowerPoint Presentation Infographic Template Outline
This is a combo chart finance ppt powerpoint presentation infographic template outline. This is a three stage process. The stages in this process are combo chart, finance, analysis, business, investment.
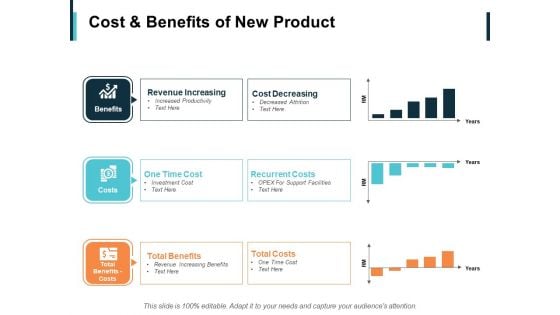
Cost And Benefits Of New Product Ppt PowerPoint Presentation Inspiration Diagrams
This is a cost and benefits of new product ppt powerpoint presentation inspiration diagrams. This is a three stage process. The stages in this process are recurrent costs, cost decreasing, revenue increasing, benefits, costs.
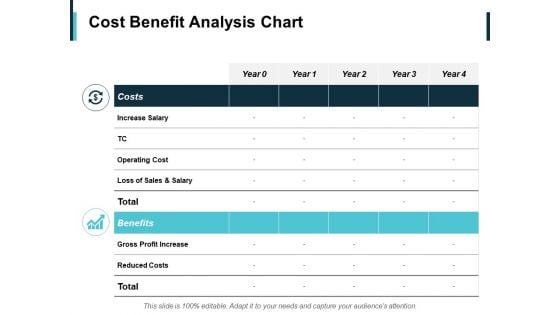
Cost Benefit Analysis Chart Ppt PowerPoint Presentation Ideas Shapes
This is a cost benefit analysis chart ppt powerpoint presentation ideas shapes. This is a two stage process. The stages in this process are reduced costs, operating cost, benefits, costs, increase salary.
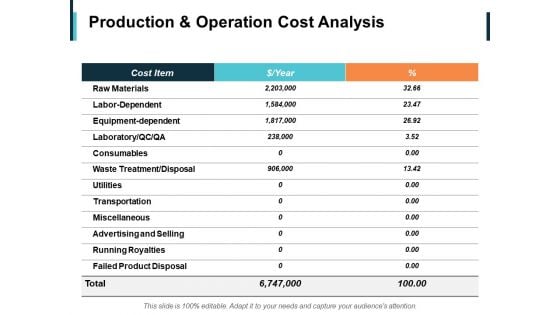
Production And Operation Cost Analysis Ppt PowerPoint Presentation Infographics Samples
This is a production and operation cost analysis ppt powerpoint presentation infographics samples. This is a three stage process. The stages in this process are utilities, transportation, miscellaneous, advertising and selling, running royalties.

Puzzle Problum Solution Ppt PowerPoint Presentation Summary Graphic Tips
This is a puzzle problum solution ppt powerpoint presentation summary graphic tips. This is a four stage process. The stages in this process are arrow, success, marketing, strategy, competition .

2X2 Business Growth Matrix Ppt PowerPoint Presentation Pictures Graphics Tutorials
This is a 2x2 business growth matrix ppt powerpoint presentation pictures graphics tutorials. This is a four stage process. The stages in this process are 2x2 matrix, 2x2 table.
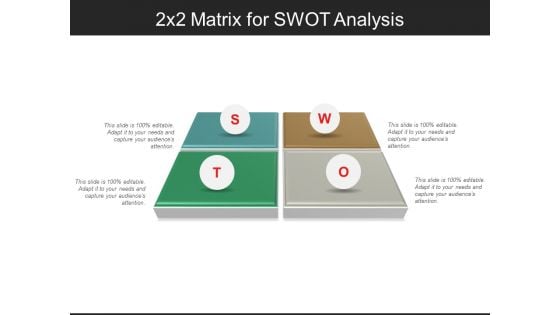
2X2 Matrix For Swot Analysis Ppt PowerPoint Presentation Infographics Background Designs
This is a 2x2 matrix for swot analysis ppt powerpoint presentation infographics background designs. This is a four stage process. The stages in this process are 2x2 matrix, 2x2 table.
2X2 Puzzle Matrix For Market Segmentation Ppt PowerPoint Presentation Show Files
This is a 2x2 puzzle matrix for market segmentation ppt powerpoint presentation show files. This is a four stage process. The stages in this process are 2x2 matrix, 2x2 table.
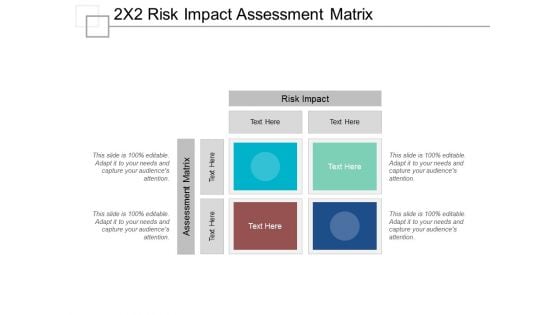
2X2 Risk Impact Assessment Matrix Ppt PowerPoint Presentation Gallery Skills
This is a 2x2 risk impact assessment matrix ppt powerpoint presentation gallery skills. This is a four stage process. The stages in this process are 2x2 matrix, 2x2 table.
3X3 Business Growth Matrix Ppt PowerPoint Presentation Icon Graphics Template
This is a 3x3 business growth matrix ppt powerpoint presentation icon graphics template. This is a three stage process. The stages in this process are 2x2 matrix, 2x2 table.
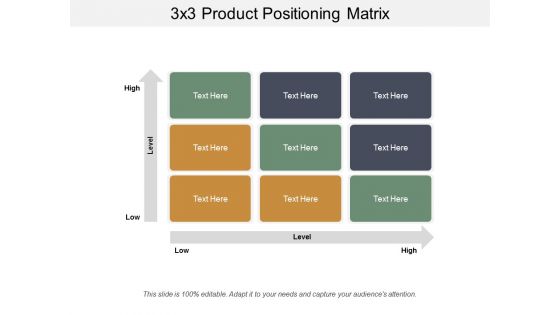
3X3 Product Positioning Matrix Ppt PowerPoint Presentation File Design Inspiration
This is a 3x3 product positioning matrix ppt powerpoint presentation file design inspiration. This is a three stage process. The stages in this process are 2x2 matrix, 2x2 table.
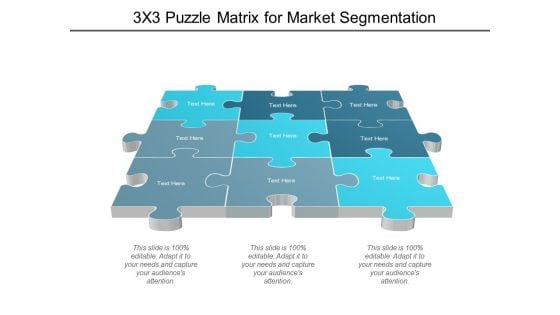
3X3 Puzzle Matrix For Market Segmentation Ppt PowerPoint Presentation Styles Templates
This is a 3x3 puzzle matrix for market segmentation ppt powerpoint presentation styles templates. This is a three stage process. The stages in this process are 2x2 matrix, 2x2 table.
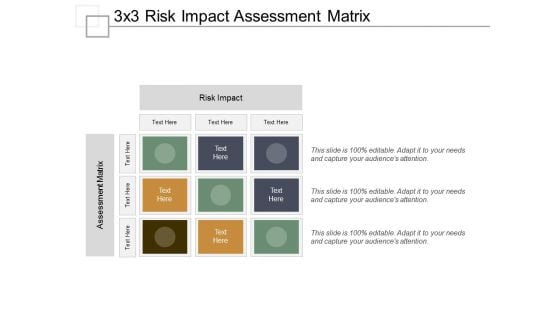
3x3 risk impact assessment matrix ppt powerpoint presentation styles images
This is a 3x3 risk impact assessment matrix ppt powerpoint presentation styles images. This is a three stage process. The stages in this process are 2x2 matrix, 2x2 table.
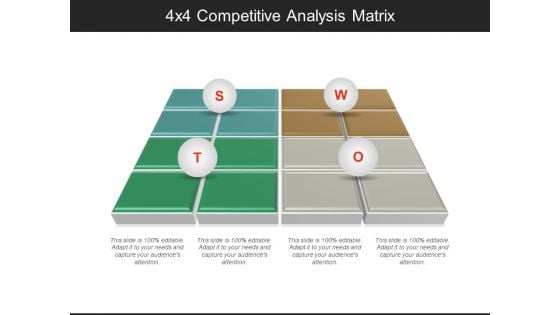
4x4 competitive analysis matrix ppt powerpoint presentation outline graphics pictures
This is a 4x4 competitive analysis matrix ppt powerpoint presentation outline graphics pictures. This is a four stage process. The stages in this process are 2x2 matrix, 2x2 table.

4x4 puzzle matrix for competitive analysis ppt powerpoint presentation outline graphics
This is a 4x4 puzzle matrix for competitive analysis ppt powerpoint presentation outline graphics. This is a four stage process. The stages in this process are 2x2 matrix, 2x2 table.

4x4 risk impact assessment matrix ppt powerpoint presentation file deck
This is a 4x4 risk impact assessment matrix ppt powerpoint presentation file deck. This is a four stage process. The stages in this process are 2x2 matrix, 2x2 table.
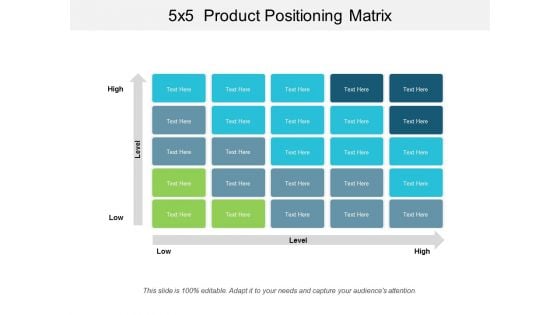
5x5 product positioning matrix ppt powerpoint presentation styles format ideas
This is a 5x5 product positioning matrix ppt powerpoint presentation styles format ideas. This is a five stage process. The stages in this process are 2x2 matrix, 2x2 table.
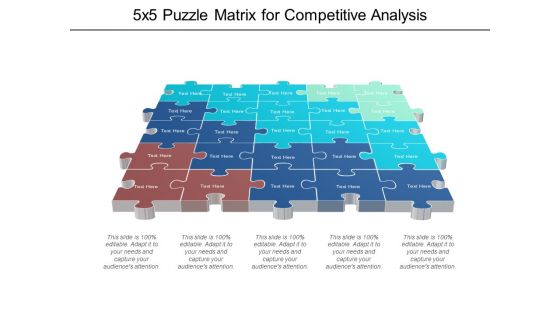
5X5 Puzzle Matrix For Competitive Analysis Ppt PowerPoint Presentation Summary Microsoft
This is a 5x5 puzzle matrix for competitive analysis ppt powerpoint presentation summary microsoft. This is a five stage process. The stages in this process are 2x2 matrix, 2x2 table.
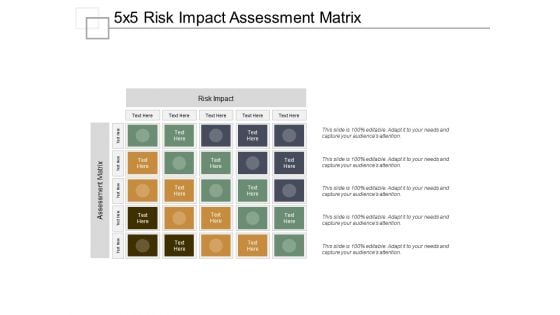
5X5 Risk Impact Assessment Matrix Ppt PowerPoint Presentation Ideas Graphics Pictures
This is a 5x5 risk impact assessment matrix ppt powerpoint presentation ideas graphics pictures. This is a five stage process. The stages in this process are 2x2 matrix, 2x2 table.


 Continue with Email

 Home
Home


