Standards
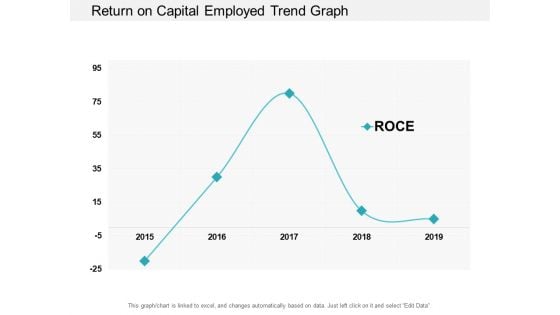
Return On Capital Employed Trend Graph Ppt PowerPoint Presentation Professional Example Topics
This is a return on capital employed trend graph ppt powerpoint presentation professional example topics. This is a one stage process. The stages in this process are accounting ratio, roce, return on capital employed.
Business Conference And Meeting Vector Icon Ppt PowerPoint Presentation Infographics Graphics Design
This is a business conference and meeting vector icon ppt powerpoint presentation infographics graphics design. This is a three stage process. The stages in this process are team meeting icon, members meeting icon, group meeting icon.
Business Conversation Group Meeting Vector Icon Ppt PowerPoint Presentation File Aids
This is a business conversation group meeting vector icon ppt powerpoint presentation file aids. This is a six stage process. The stages in this process are team meeting icon, members meeting icon, group meeting icon.
Business Training For Employee Development Vector Icon Ppt PowerPoint Presentation Portfolio Themes
This is a business training for employee development vector icon ppt powerpoint presentation portfolio themes. This is a four stage process. The stages in this process are team meeting icon, members meeting icon, group meeting icon.
Coaching And Training Vector Icon Ppt PowerPoint Presentation Outline Format Ideas
This is a coaching and training vector icon ppt powerpoint presentation outline format ideas. This is a four stage process. The stages in this process are team meeting icon, members meeting icon, group meeting icon.
Executive Meeting Around The Table Icon Ppt PowerPoint Presentation Inspiration Images
This is a executive meeting around the table icon ppt powerpoint presentation inspiration images. This is a four stage process. The stages in this process are team meeting icon, members meeting icon, group meeting icon.
Office Meeting And Conversation Vector Icon Ppt PowerPoint Presentation Infographics Picture
This is a office meeting and conversation vector icon ppt powerpoint presentation infographics picture. This is a four stage process. The stages in this process are team meeting icon, members meeting icon, group meeting icon.
Office Staff Sitting In Meeting Room Vector Icon Ppt PowerPoint Presentation Summary Shapes
This is a office staff sitting in meeting room vector icon ppt powerpoint presentation summary shapes. This is a three stage process. The stages in this process are team meeting icon, members meeting icon, group meeting icon.
Staff Conference Training And Coaching Icon Ppt PowerPoint Presentation Clipart
This is a staff conference training and coaching icon ppt powerpoint presentation clipart. This is a four stage process. The stages in this process are team meeting icon, members meeting icon, group meeting icon.
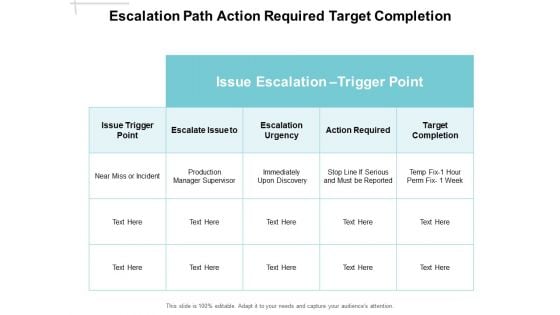
Escalation Path Action Required Target Completion Ppt PowerPoint Presentation Infographic Template Clipart
This is a escalation path action required target completion ppt powerpoint presentation infographic template clipart. This is a five stage process. The stages in this process are 5 step escalation, 5 stages escalation, business.
Five Growth Arrow Steps To Monitor Progress With Icons Ppt PowerPoint Presentation Layouts Diagrams
This is a five growth arrow steps to monitor progress with icons ppt powerpoint presentation layouts diagrams. This is a five stage process. The stages in this process are 5 step escalation, 5 stages escalation, business.

Five Growth Steps Strategy Is Focus Ppt PowerPoint Presentation Portfolio Structure
This is a five growth steps strategy is focus ppt powerpoint presentation portfolio structure. This is a five stage process. The stages in this process are 5 step escalation, 5 stages escalation, business.
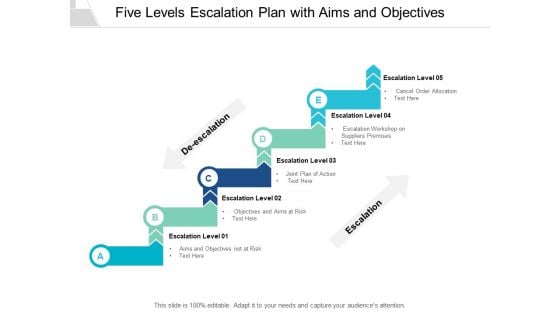
Five Levels Escalation Plan With Aims And Objectives Ppt PowerPoint Presentation Outline Picture
This is a five levels escalation plan with aims and objectives ppt powerpoint presentation outline picture. This is a five stage process. The stages in this process are 5 step escalation, 5 stages escalation, business.
Five Stages Escalation Plan Strategize Research With Icons Ppt PowerPoint Presentation Icon Graphics Pictures
This is a five stages escalation plan strategize research with icons ppt powerpoint presentation icon graphics pictures. This is a five stage process. The stages in this process are 5 step escalation, 5 stages escalation, business.
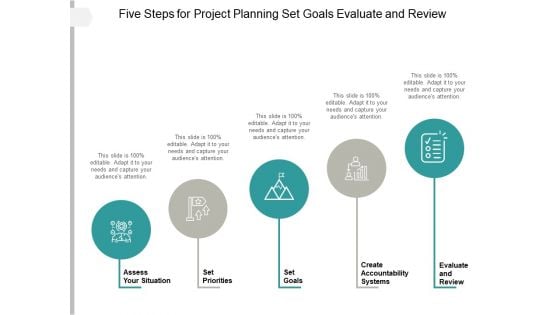
Five Steps For Project Planning Set Goals Evaluate And Review Ppt PowerPoint Presentation Outline Files
This is a five steps for project planning set goals evaluate and review ppt powerpoint presentation outline files. This is a five stage process. The stages in this process are 5 step escalation, 5 stages escalation, business.
Burger Fast Food Clipart With Text Holders Ppt PowerPoint Presentation Layouts Structure
This is a burger fast food clipart with text holders ppt powerpoint presentation layouts structure. This is a four stage process. The stages in this process are junk food, junk diet, unhealthy food.
Burger Meal With Juice Beach Side View Ppt PowerPoint Presentation Summary Icons
This is a burger meal with juice beach side view ppt powerpoint presentation summary icons. This is a four stage process. The stages in this process are junk food, junk diet, unhealthy food.
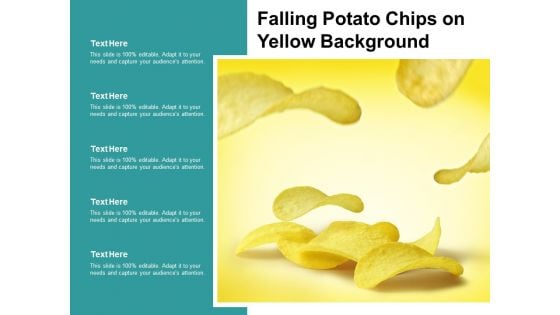
Falling Potato Chips On Yellow Background Ppt PowerPoint Presentation Slides Show
This is a falling potato chips on yellow background ppt powerpoint presentation slides show. This is a five stage process. The stages in this process are junk food, junk diet, unhealthy food.

Fast Food Delicious Pizza Picture Ppt PowerPoint Presentation Gallery Topics
This is a fast food delicious pizza picture ppt powerpoint presentation gallery topics. This is a four stage process. The stages in this process are junk food, junk diet, unhealthy food.
Fast Food French Fries Clipart With Text Holders Ppt PowerPoint Presentation Slides Deck
This is a fast food french fries clipart with text holders ppt powerpoint presentation slides deck. This is a four stage process. The stages in this process are junk food, junk diet, unhealthy food.
Fast Food Hot Dog Clipart With Text Holders Ppt PowerPoint Presentation Design Ideas
This is a fast food hot dog clipart with text holders ppt powerpoint presentation design ideas. This is a five stage process. The stages in this process are junk food, junk diet, unhealthy food.
Fast Food Hot Pizza In Box Ppt PowerPoint Presentation Styles Graphics Design
This is a fast food hot pizza in box ppt powerpoint presentation styles graphics design. This is a four stage process. The stages in this process are junk food, junk diet, unhealthy food.
Fast Food Meal Burger With Fries And Cold Drink Ppt PowerPoint Presentation Slides File Formats
This is a fast food meal burger with fries and cold drink ppt powerpoint presentation slides file formats. This is a four stage process. The stages in this process are junk food, junk diet, unhealthy food.
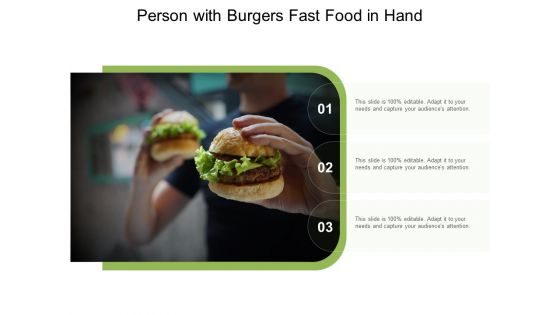
Person With Burgers Fast Food In Hand Ppt PowerPoint Presentation Model Pictures
This is a person with burgers fast food in hand ppt powerpoint presentation model pictures. This is a three stage process. The stages in this process are junk food, junk diet, unhealthy food.

Sweet Cookies With White Sugar Sprinkle Ppt PowerPoint Presentation Pictures Smartart
This is a sweet cookies with white sugar sprinkle ppt powerpoint presentation pictures smartart. This is a five stage process. The stages in this process are junk food, junk diet, unhealthy food.
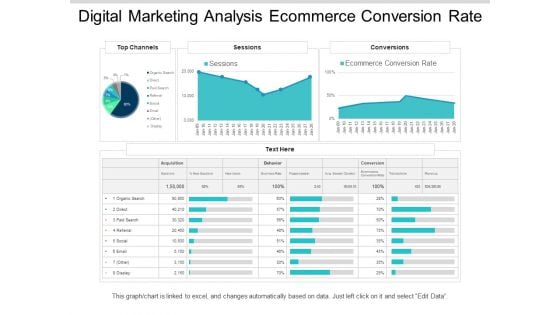
Digital Marketing Analysis Ecommerce Conversion Rate Ppt PowerPoint Presentation Outline Example File
This is a digital marketing analysis ecommerce conversion rate ppt powerpoint presentation outline example file. This is a three stage process. The stages in this process are digital analytics, digital dashboard, marketing.
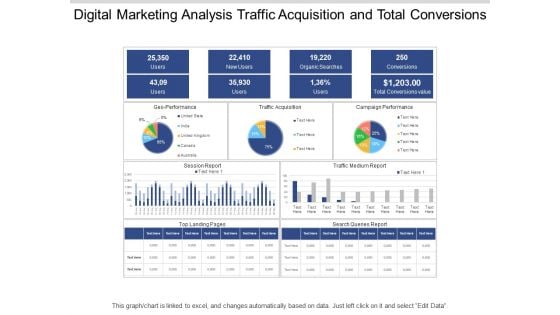
Digital Marketing Analysis Traffic Acquisition And Total Conversions Ppt PowerPoint Presentation Pictures Layouts
This is a digital marketing analysis traffic acquisition and total conversions ppt powerpoint presentation pictures layouts. This is a three stage process. The stages in this process are digital analytics, digital dashboard, marketing.
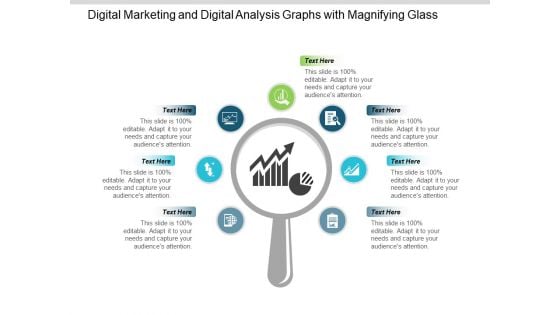
Digital Marketing And Digital Analysis Graphs With Magnifying Glass Ppt PowerPoint Presentation Portfolio Show
This is a digital marketing and digital analysis graphs with magnifying glass ppt powerpoint presentation portfolio show. This is a seven stage process. The stages in this process are digital analytics, digital dashboard, marketing.
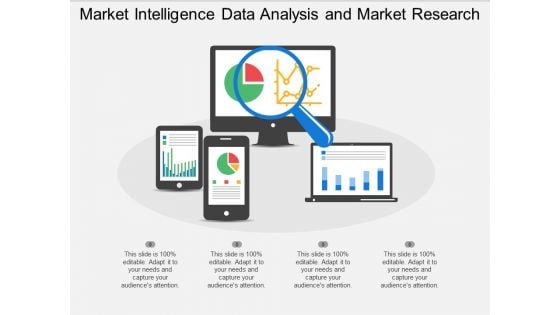
Market Intelligence Data Analysis And Market Research Ppt PowerPoint Presentation Professional Templates
This is a market intelligence data analysis and market research ppt powerpoint presentation professional templates. This is a four stage process. The stages in this process are digital analytics, digital dashboard, marketing.
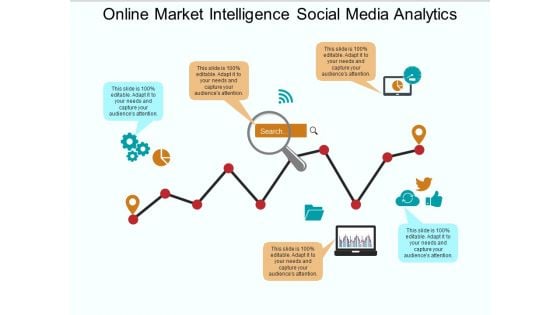
Online Market Intelligence Social Media Analytics Ppt PowerPoint Presentation Infographics Themes
This is a online market intelligence social media analytics ppt powerpoint presentation infographics themes. This is a five stage process. The stages in this process are digital analytics, digital dashboard, marketing.
Web Analytics Charts Visits Bounce Rate Page Views Ppt PowerPoint Presentation Icon Layouts
This is a web analytics charts visits bounce rate page views ppt powerpoint presentation icon layouts. This is a six stage process. The stages in this process are digital analytics, digital dashboard, marketing.
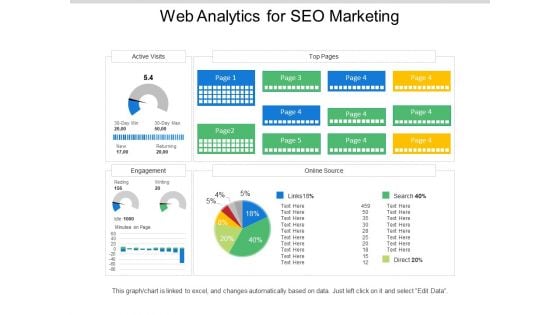
Web Analytics For Seo Marketing Ppt PowerPoint Presentation Examples
This is a web analytics for seo marketing ppt powerpoint presentation examples. This is a five stage process. The stages in this process are digital analytics, digital dashboard, marketing.
Web Analytics Icons Computer Screen With Data Charts Ppt PowerPoint Presentation Ideas Outline
This is a web analytics icons computer screen with data charts ppt powerpoint presentation ideas outline. This is a four stage process. The stages in this process are digital analytics, digital dashboard, marketing.
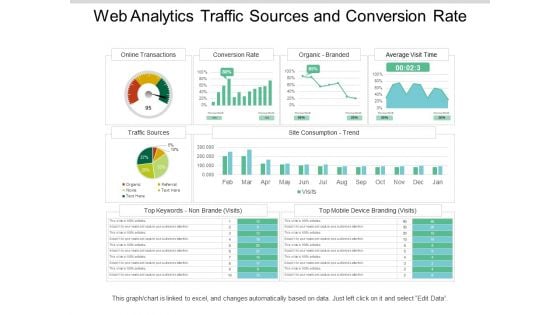
Web Analytics Traffic Sources And Conversion Rate Ppt PowerPoint Presentation Picture
This is a web analytics traffic sources and conversion rate ppt powerpoint presentation picture. This is a four stage process. The stages in this process are digital analytics, digital dashboard, marketing.
Web Marketing Analytics Bounce Rate Goal Conversion Ppt PowerPoint Presentation Inspiration Icon
This is a web marketing analytics bounce rate goal conversion ppt powerpoint presentation inspiration icon. This is a six stage process. The stages in this process are digital analytics, digital dashboard, marketing.
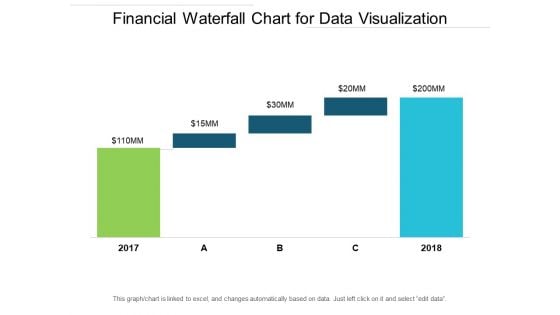
Financial Waterfall Chart For Data Visualization Ppt PowerPoint Presentation Ideas Elements
This is a financial waterfall chart for data visualization ppt powerpoint presentation ideas elements. This is a five stage process. The stages in this process are sales waterfall, waterfall chart, business.
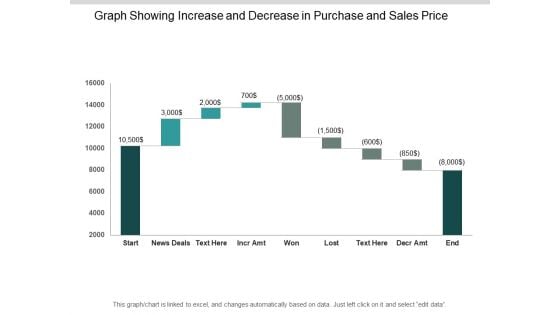
Graph Showing Increase And Decrease In Purchase And Sales Price Ppt PowerPoint Presentation Outline Gallery
This is a graph showing increase and decrease in purchase and sales price ppt powerpoint presentation outline gallery. This is a nine stage process. The stages in this process are sales waterfall, waterfall chart, business.
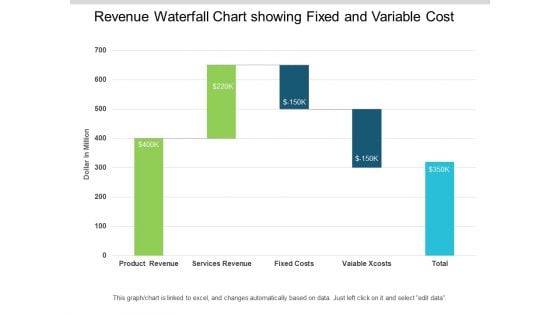
Revenue Waterfall Chart Showing Fixed And Variable Cost Ppt PowerPoint Presentation Infographic Template Images
This is a revenue waterfall chart showing fixed and variable cost ppt powerpoint presentation infographic template images. This is a five stage process. The stages in this process are sales waterfall, waterfall chart, business.
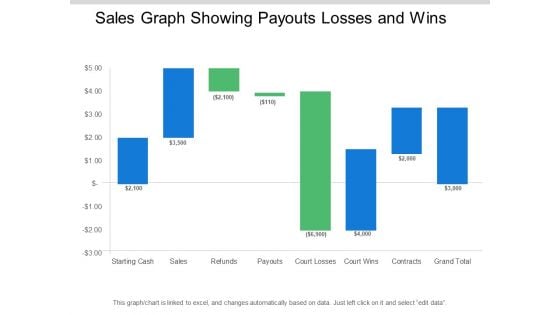
Sales Graph Showing Payouts Losses And Wins Ppt PowerPoint Presentation Pictures Designs Download
This is a sales graph showing payouts losses and wins ppt powerpoint presentation pictures designs download. This is a eight stage process. The stages in this process are sales waterfall, waterfall chart, business.
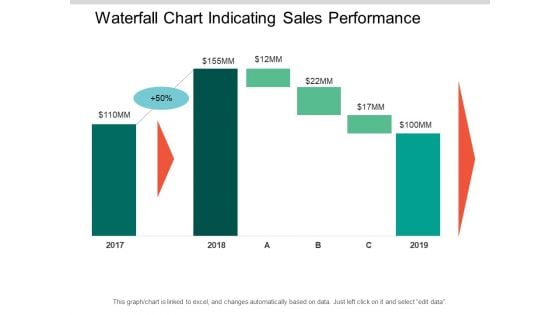
Waterfall Chart Indicating Sales Performance Ppt PowerPoint Presentation Outline Templates
This is a waterfall chart indicating sales performance ppt powerpoint presentation outline templates. This is a seven stage process. The stages in this process are sales waterfall, waterfall chart, business.
Waterfall Chart Showing Effective Pricing And Profitability Insight Ppt PowerPoint Presentation Icon Graphics
This is a waterfall chart showing effective pricing and profitability insight ppt powerpoint presentation icon graphics. This is a seven stage process. The stages in this process are sales waterfall, waterfall chart, business.
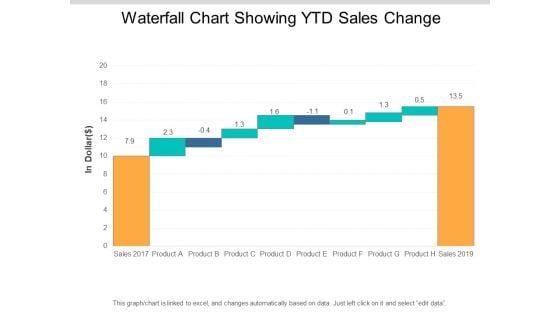
Waterfall Chart Showing Ytd Sales Change Ppt PowerPoint Presentation Professional Format
This is a waterfall chart showing ytd sales change ppt powerpoint presentation professional format. This is a ten stage process. The stages in this process are sales waterfall, waterfall chart, business.
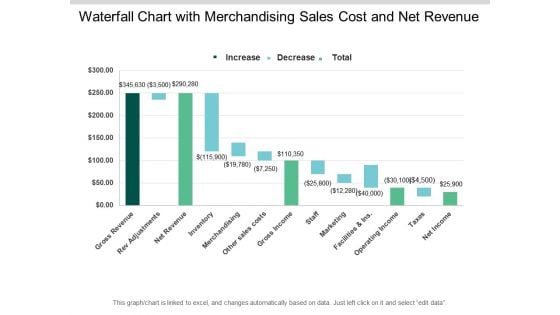
Waterfall Chart With Merchandising Sales Cost And Net Revenue Ppt PowerPoint Presentation Summary Show
This is a waterfall chart with merchandising sales cost and net revenue ppt powerpoint presentation summary show. This is a three stage process. The stages in this process are sales waterfall, waterfall chart, business.
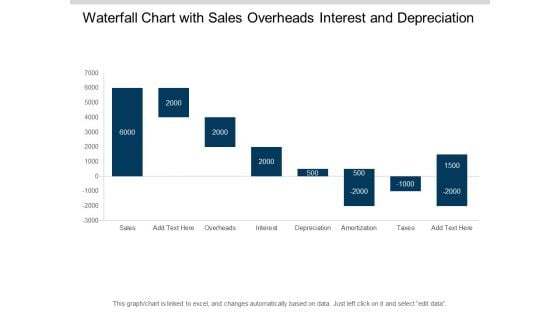
Waterfall Chart With Sales Overheads Interest And Depreciation Ppt PowerPoint Presentation File Display
This is a waterfall chart with sales overheads interest and depreciation ppt powerpoint presentation file display. This is a eight stage process. The stages in this process are sales waterfall, waterfall chart, business.
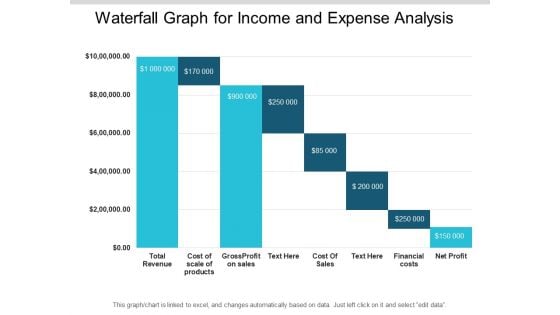
Waterfall Graph For Income And Expense Analysis Ppt PowerPoint Presentation File Deck
This is a waterfall graph for income and expense analysis ppt powerpoint presentation file deck. This is a eight stage process. The stages in this process are sales waterfall, waterfall chart, business.
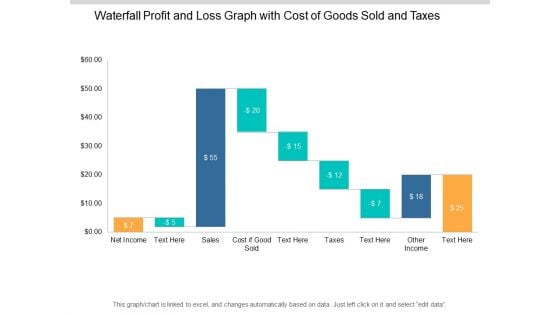
Waterfall Profit And Loss Graph With Cost Of Goods Sold And Taxes Ppt PowerPoint Presentation Show Slideshow
This is a waterfall profit and loss graph with cost of goods sold and taxes ppt powerpoint presentation show slideshow. This is a nine stage process. The stages in this process are sales waterfall, waterfall chart, business.

Educational Technology For Effective Teaching Knowledge Application And Evaluation Ppt PowerPoint Presentation Pictures Portfolio
This is a educational technology for effective teaching knowledge application and evaluation ppt powerpoint presentation pictures portfolio. This is a three stage process. The stages in this process are visual aids, communication, business.
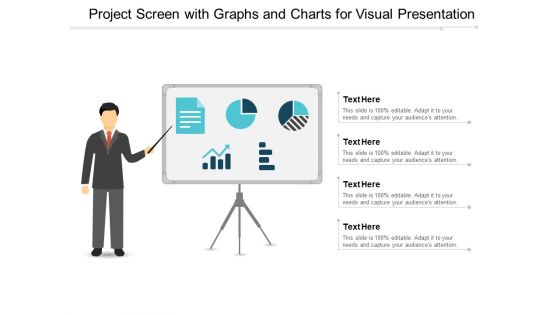
Project Screen With Graphs And Charts For Visual Presentation Ppt PowerPoint Presentation Gallery Design Inspiration
This is a project screen with graphs and charts for visual presentation ppt powerpoint presentation gallery design inspiration. This is a four stage process. The stages in this process are visual aids, communication, business.
Research And Findings Display In Visual Form Ppt PowerPoint Presentation Layouts Files
This is a research and findings display in visual form ppt powerpoint presentation layouts files. This is a three stage process. The stages in this process are visual aids, communication, business.
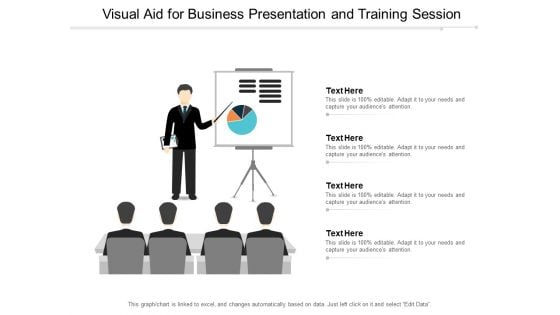
Visual Aid For Business Presentation And Training Session Ppt PowerPoint Presentation Model Design Ideas
This is a visual aid for business presentation and training session ppt powerpoint presentation model design ideas. This is a four stage process. The stages in this process are visual aids, communication, business.

Visual Aid To Streamline Workflow Prototype Develop And Test Ppt PowerPoint Presentation Styles Graphics Design
This is a visual aid to streamline workflow prototype develop and test ppt powerpoint presentation styles graphics design. This is a five stage process. The stages in this process are visual aids, communication, business.
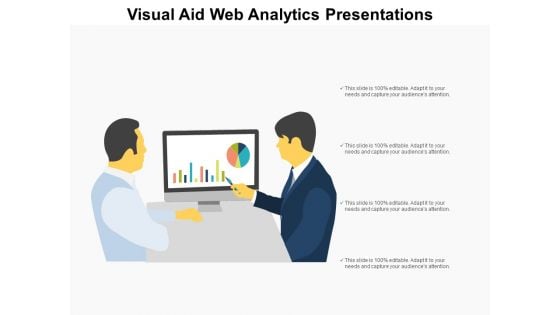
Visual Aid Web Analytics Presentations Ppt PowerPoint Presentation Infographics Elements
This is a visual aid web analytics presentations ppt powerpoint presentation infographics elements. This is a four stage process. The stages in this process are visual aids, communication, business.
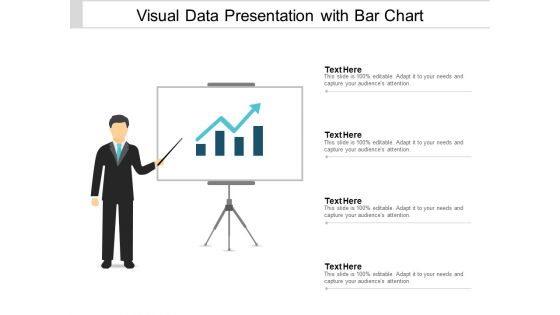
Visual Data Presentation With Bar Chart Ppt PowerPoint Presentation Portfolio Brochure
This is a visual data presentation with bar chart ppt powerpoint presentation portfolio brochure. This is a four stage process. The stages in this process are visual aids, communication, business.
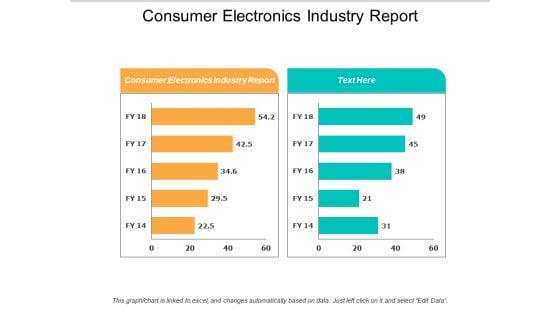
Consumer Electronics Industry Report Ppt PowerPoint Presentation Model Elements Cpb
This is a consumer electronics industry report ppt powerpoint presentation model elements cpb. This is a two stage process. The stages in this process are consumer electronics industry report.
Predictive Analytics Sales Operational Planning Ppt PowerPoint Presentation Icon Grid Cpb
This is a predictive analytics sales operational planning ppt powerpoint presentation icon grid cpb. This is a three stage process. The stages in this process are predictive analytics sales operational planning.
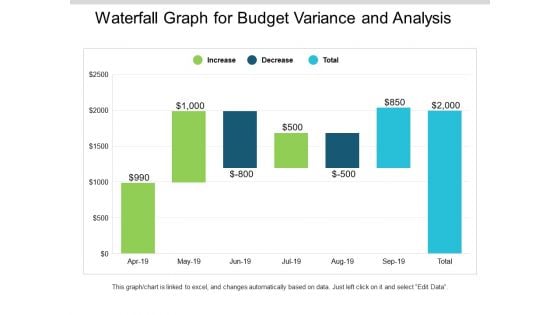
Waterfall Graph For Budget Variance And Analysis Ppt PowerPoint Presentation Slides Mockup
This is a waterfall graph for budget variance and analysis ppt powerpoint presentation slides mockup. This is a three stage process. The stages in this process are profit and loss, balance sheet, income statement, benefit and loss.
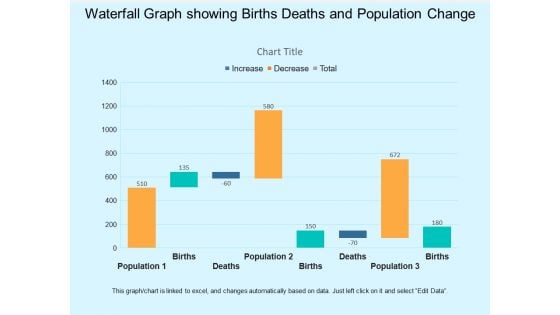
Waterfall Graph Showing Births Deaths And Population Change Ppt PowerPoint Presentation Infographic Template Visual Aids
This is a waterfall graph showing births deaths and population change ppt powerpoint presentation infographic template visual aids. This is a three stage process. The stages in this process are profit and loss, balance sheet, income statement, benefit and loss.
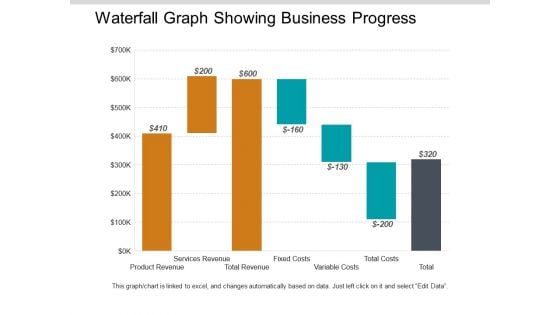
Waterfall Graph Showing Business Progress Ppt PowerPoint Presentation Styles Model
This is a waterfall graph showing business progress ppt powerpoint presentation styles model. This is a three stage process. The stages in this process are profit and loss, balance sheet, income statement, benefit and loss.
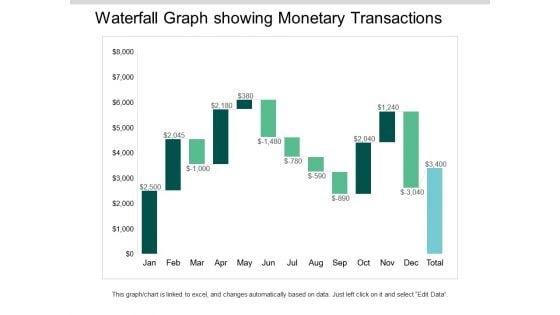
Waterfall Graph Showing Monetary Transactions Ppt PowerPoint Presentation Ideas Visuals
This is a waterfall graph showing monetary transactions ppt powerpoint presentation ideas visuals. This is a three stage process. The stages in this process are profit and loss, balance sheet, income statement, benefit and loss.
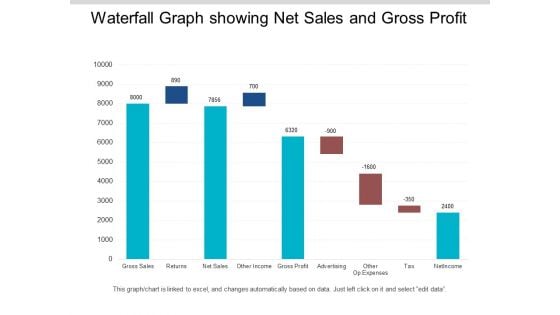
Waterfall Graph Showing Net Sales And Gross Profit Ppt PowerPoint Presentation Infographics Format
This is a waterfall graph showing net sales and gross profit ppt powerpoint presentation infographics format. This is a three stage process. The stages in this process are profit and loss, balance sheet, income statement, benefit and loss.


 Continue with Email

 Home
Home


