Statistics
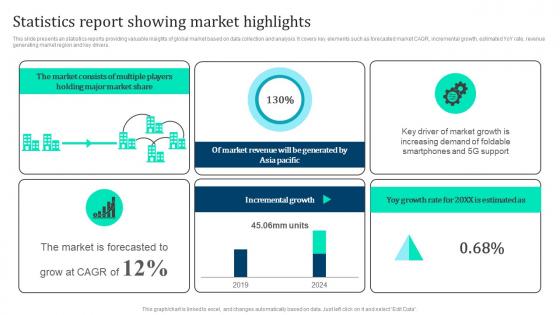
Statistics Report Showing Marketing Intelligence Guide Data Gathering Slides Pdf
This slide presents an statistics reports providing valuable insights of global market based on data collection and analysis. It covers key elements such as forecasted market CAGR, incremental growth, estimated YoY rate, revenue generating market region and key drivers. Get a simple yet stunning designed Statistics Report Showing Marketing Intelligence Guide Data Gathering Slides Pdf. It is the best one to establish the tone in your meetings. It is an excellent way to make your presentations highly effective. So, download this PPT today from Slidegeeks and see the positive impacts. Our easy to edit Statistics Report Showing Marketing Intelligence Guide Data Gathering Slides Pdf can be your go to option for all upcoming conferences and meetings. So, what are you waiting for Grab this template today. This slide presents an statistics reports providing valuable insights of global market based on data collection and analysis. It covers key elements such as forecasted market CAGR, incremental growth, estimated YoY rate, revenue generating market region and key drivers.

Business Statistics Success PowerPoint Themes And PowerPoint Slides 0711
Microsoft PowerPoint Theme and Slide with business statistics Customize our Business Statistics Success PowerPoint Themes And PowerPoint Slides 0711 to your thoughts. Display for all the essential you.
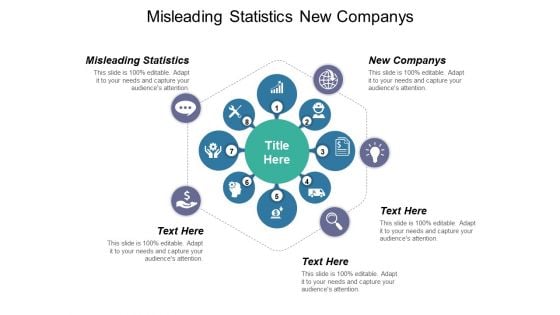
Misleading Statistics New Companys Ppt PowerPoint Presentation Summary Mockup
This is a misleading statistics new companys ppt powerpoint presentation summary mockup. This is a five stage process. The stages in this process are misleading statistics, new companys.
Web Tracking Statistics Ppt PowerPoint Presentation Model Summary Cpb
This is a web tracking statistics ppt powerpoint presentation model summary cpb. This is a four stage process. The stages in this process are web tracking statistics.
Business Travel Statistics Ppt PowerPoint Presentation Icon Information Cpb
This is a business travel statistics ppt powerpoint presentation icon information cpb. This is a two stage process. The stages in this process are business travel statistics.
Sales Statistics Ppt Powerpoint Presentation Portfolio Introduction Cpb
This is a sales statistics ppt powerpoint presentation portfolio introduction cpb. This is a three stage process. The stages in this process are sales statistics.
Ad Campaign Statistics Ppt PowerPoint Presentation Gallery Smartart Cpb
This is a ad campaign statistics ppt powerpoint presentation gallery smartart cpb. This is a five stage process. The stages in this process are ad campaign statistics.
Quantitative Analysis Statistics Ppt PowerPoint Presentation Layouts Layouts Cpb
This is a quantitative analysis statistics ppt powerpoint presentation layouts layouts cpb. This is a eight stage process. The stages in this process are quantitative analysis statistics.
Local Business Statistics Ppt Powerpoint Presentation Visuals Cpb
This is a local business statistics ppt powerpoint presentation visuals cpb. This is a four stage process. The stages in this process are local business statistics.
Employee Wellness Statistics Ppt PowerPoint Presentation Outline Gridlines
This is a employee wellness statistics ppt powerpoint presentation outline gridlines. This is a five stage process. The stages in this process are employee wellness statistics.

Branding Statistics Ppt Powerpoint Presentation Ideas Layouts Cpb
This is a branding statistics ppt powerpoint presentation ideas layouts cpb. This is a five stage process. The stages in this process are branding statistics.
Tracking Statistics Ppt Powerpoint Presentation Infographic Template Graphic Images
This is a tracking statistics ppt powerpoint presentation infographic template graphic images. This is a eight stage process. The stages in this process are tracking statistics.
Automotive Industry Statistics Ppt PowerPoint Presentation Inspiration Graphics Design Cpb
This is a automotive industry statistics ppt powerpoint presentation inspiration graphics design cpb. This is a three stage process. The stages in this process are automotive industry statistics.
Product Sales Statistics Ppt PowerPoint Presentation Icon Background Cpb
This is a product sales statistics ppt powerpoint presentation icon background cpb. This is a three stage process. The stages in this process are product sales statistics.
Employee Engagement Retention Statistics Ppt PowerPoint Presentation Gallery Deck
This is a employee engagement retention statistics ppt powerpoint presentation gallery deck. This is a four stage process. The stages in this process are employee engagement retention statistics.
Business Success Statistics Ppt Powerpoint Presentation Icon Pictures Cpb
This is a business success statistics ppt powerpoint presentation icon pictures cpb. This is a three stage process. The stages in this process are business success statistics.
Economic Statistics Ppt PowerPoint Presentation Model Graphics Template Cpb
This is a economic statistics ppt powerpoint presentation model graphics template cpb. This is a eight stage process. The stages in this process are economic statistics.
Baby Boomer Statistics Ppt PowerPoint Presentation Infographic Template Layouts Cpb
This is a baby boomer statistics ppt powerpoint presentation infographic template layouts cpb. This is a six stage process. The stages in this process are baby boomer statistics.
Advertising Industry Statistics Ppt PowerPoint Presentation Outline Diagrams Cpb
This is a advertising industry statistics ppt powerpoint presentation outline diagrams cpb. This is a four stage process. The stages in this process are advertising industry statistics.
Advertising Statistics Ppt PowerPoint Presentation Infographics Display Cpb
This is a advertising statistics ppt powerpoint presentation infographics display cpb. This is a four stage process. The stages in this process are advertising statistics.
Baby Boomers Statistics Ppt PowerPoint Presentation Outline Files Cpb
This is a baby boomers statistics ppt powerpoint presentation outline files cpb. This is a four stage process. The stages in this process are baby boomers statistics.
Consumer Statistics Ppt PowerPoint Presentation Gallery Summary Cpb
This is a consumer statistics ppt powerpoint presentation gallery summary cpb. This is a five stage process. The stages in this process are consumer statistics.
Internet Advertising Statistics Ppt PowerPoint Presentation Inspiration Visuals Cpb
This is a internet advertising statistics ppt powerpoint presentation inspiration visuals cpb. This is a three stage process. The stages in this process are internet advertising statistics.
Research Statistics Ppt PowerPoint Presentation Pictures Slide Download Cpb
This is a research statistics ppt powerpoint presentation pictures slide download cpb. This is a three stage process. The stages in this process are research statistics.
Search Engine Statistics Ppt PowerPoint Presentation Portfolio Graphic Tips Cpb
This is a search engine statistics ppt powerpoint presentation portfolio graphic tips cpb. This is a five stage process. The stages in this process are search engine statistics.

Product Statistics Ppt PowerPoint Presentation Layouts Graphics Design Cpb
This is a product statistics ppt powerpoint presentation layouts graphics design cpb. This is a four stage process. The stages in this process are product statistics.
Industry Growth Statistics Ppt PowerPoint Presentation Layouts Examples Cpb
This is a industry growth statistics ppt powerpoint presentation layouts examples cpb. This is a four stage process. The stages in this process are industry growth statistics.
Internet Buying Statistics Ppt PowerPoint Presentation Show Format Cpb
This is a internet buying statistics ppt powerpoint presentation show format cpb. This is a four stage process. The stages in this process are internet buying statistics.
Mobile Web Statistics Ppt PowerPoint Presentation Gallery Graphics Pictures Cpb
This is a mobile web statistics ppt powerpoint presentation gallery graphics pictures cpb. This is a seven stage process. The stages in this process are mobile web statistics.
Online Retailing Statistics Ppt PowerPoint Presentation Visual Aids Cpb
This is a online retailing statistics ppt powerpoint presentation visual aids cpb. This is a five stage process. The stages in this process are online retailing statistics.
Technology Statistics Ppt PowerPoint Presentation Infographics Inspiration Cpb
This is a technology statistics ppt powerpoint presentation infographics inspiration cpb. This is a five stage process. The stages in this process are technology statistics.
Social Media Statistics Ppt PowerPoint Presentation Infographics Styles Cpb
This is a social media statistics ppt powerpoint presentation infographics styles cpb. This is a eight stage process. The stages in this process are social media statistics.
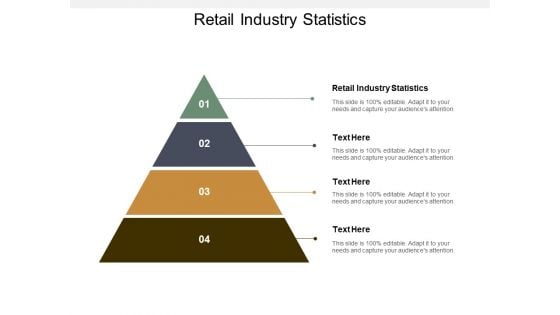
Retail Industry Statistics Ppt PowerPoint Presentation Infographic Template Objects Cpb
This is a retail industry statistics ppt powerpoint presentation infographic template objects cpb. This is a four stage process. The stages in this process are retail industry statistics.
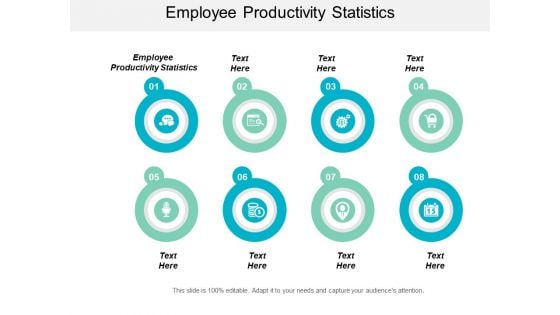
Employee Productivity Statistics Ppt PowerPoint Presentation Slide Cpb
This is a employee productivity statistics ppt powerpoint presentation slide cpb. This is a eight stage process. The stages in this process are employee productivity statistics.
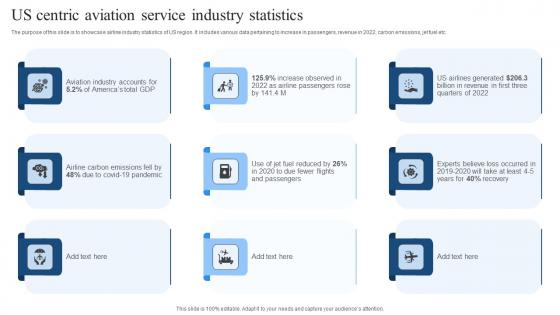
Us Centric Aviation Service Industry Statistics Diagrams Pdf
The purpose of this slide is to showcase airline industry statistics of US region. It includes various data pertaining to increase in passengers, revenue in 2022, carbon emissions, jet fuel etc. Pitch your topic with ease and precision using this Us Centric Aviation Service Industry Statistics Diagrams Pdf. This layout presents information on Carbon Emissions, Airline Passengers. It is also available for immediate download and adjustment. So, changes can be made in the color, design, graphics or any other component to create a unique layout. The purpose of this slide is to showcase airline industry statistics of US region. It includes various data pertaining to increase in passengers, revenue in 2022, carbon emissions, jet fuel etc.
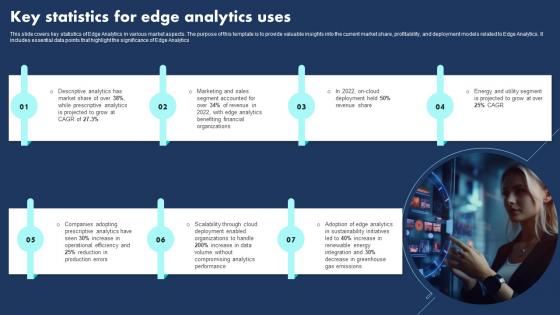
Key Statistics For Edge Analytics Uses Introduction Pdf
This slide covers key statistics of Edge Analytics in various market aspects. The purpose of this template is to provide valuable insights into the current market share, profitability, and deployment models related to Edge Analytics. It includes essential data points that highlight the significance of Edge Analytics.Showcasing this set of slides titled Key Statistics For Edge Analytics Uses Introduction Pdf The topics addressed in these templates are Descriptive Analytics, Production Errors, Decrease Greenhouse All the content presented in this PPT design is completely editable. Download it and make adjustments in color, background, font etc. as per your unique business setting. This slide covers key statistics of Edge Analytics in various market aspects. The purpose of this template is to provide valuable insights into the current market share, profitability, and deployment models related to Edge Analytics. It includes essential data points that highlight the significance of Edge Analytics.
Statistics Supporting Use Of Strategic Guide For Sustainable Designs Pdf
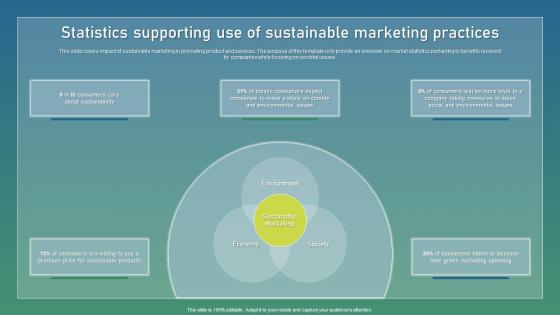
This slide covers impact of sustainable marketing in promoting product and services. The purpose of this template is to provide an overview on market statistics pertaining to benefits received by companies while focusing on societal issues. This Statistics Supporting Use Of Strategic Guide For Sustainable Designs Pdf from Slidegeeks makes it easy to present information on your topic with precision. It provides customization options, so you can make changes to the colors, design, graphics, or any other component to create a unique layout. It is also available for immediate download, so you can begin using it right away. Slidegeeks has done good research to ensure that you have everything you need to make your presentation stand out. Make a name out there for a brilliant performance. This slide covers impact of sustainable marketing in promoting product and services. The purpose of this template is to provide an overview on market statistics pertaining to benefits received by companies while focusing on societal issues.
Key Statistics Associated Implementation Of Digital Advertising Strategies Background Pdf
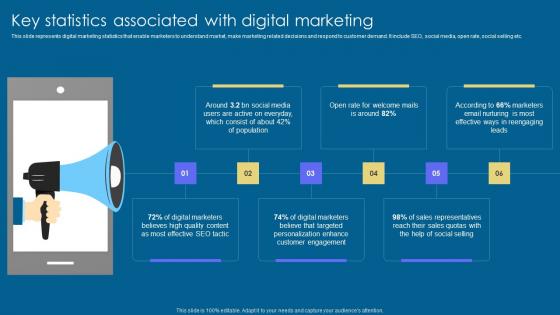
This slide represents digital marketing statistics that enable marketers to understand market, make marketing related decisions and respond to customer demand. It include SEO, social media, open rate, social selling etc. Find a pre designed and impeccable Key Statistics Associated Implementation Of Digital Advertising Strategies Background Pdf. The templates can ace your presentation without additional effort. You can download these easy to edit presentation templates to make your presentation stand out from others. So, what are you waiting for Download the template from Slidegeeks today and give a unique touch to your presentation. This slide represents digital marketing statistics that enable marketers to understand market, make marketing related decisions and respond to customer demand. It include SEO, social media, open rate, social selling etc.
Abortion Reasons Statistics In Powerpoint And Google Slides Cpb
Presenting our innovatively designed set of slides titled Abortion Reasons Statistics In Powerpoint And Google Slides Cpb. This completely editable PowerPoint graphic exhibits Abortion Reasons Statistics that will help you convey the message impactfully. It can be accessed with Google Slides and is available in both standard screen and widescreen aspect ratios. Apart from this, you can download this well structured PowerPoint template design in different formats like PDF, JPG, and PNG. So, click the download button now to gain full access to this PPT design. Our Abortion Reasons Statistics In Powerpoint And Google Slides Cpb are topically designed to provide an attractive backdrop to any subject. Use them to look like a presentation pro.

Variability Statistics Examples In Powerpoint And Google Slides Cpb
Presenting our innovatively designed set of slides titled Variability Statistics Examples In Powerpoint And Google Slides Cpb. This completely editable PowerPoint graphic exhibits Variability Statistics Examples that will help you convey the message impactfully. It can be accessed with Google Slides and is available in both standard screen and widescreen aspect ratios. Apart from this, you can download this well structured PowerPoint template design in different formats like PDF, JPG, and PNG. So, click the download button now to gain full access to this PPT design. Our Variability Statistics Examples In Powerpoint And Google Slides Cpb are topically designed to provide an attractive backdrop to any subject. Use them to look like a presentation pro.
Highlighting Statistics Associated Esponsible Tech Guide To Manage Infographics Pdf
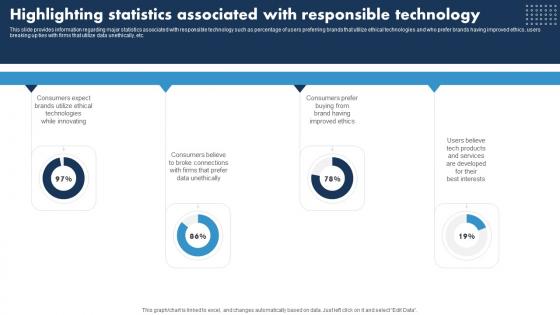
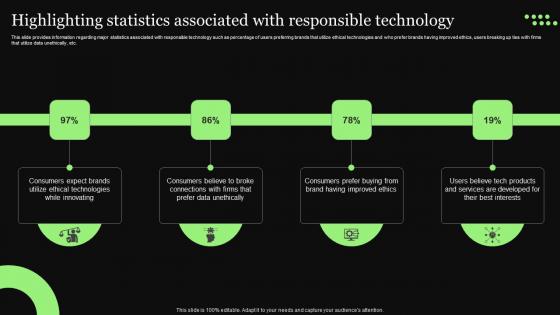
This slide provides information regarding major statistics associated with responsible technology such as percentage of users preferring brands that utilize ethical technologies and who prefer brands having improved ethics, users breaking up ties with firms that utilize data unethically, etc. Coming up with a presentation necessitates that the majority of the effort goes into the content and the message you intend to convey. The visuals of a PowerPoint presentation can only be effective if it supplements and supports the story that is being told. Keeping this in mind our experts created Highlighting Statistics Associated Esponsible Tech Guide To Manage Infographics Pdf to reduce the time that goes into designing the presentation. This way, you can concentrate on the message while our designers take care of providing you with the right template for the situation. This slide provides information regarding major statistics associated with responsible technology such as percentage of users preferring brands that utilize ethical technologies and who prefer brands having improved ethics, users breaking up ties with firms that utilize data unethically, etc.
Ethical Technology Utilization Highlighting Statistics Associated Responsible Technology Themes Pdf
This slide provides information regarding major statistics associated with responsible technology such as percentage of users preferring brands that utilize ethical technologies and who prefer brands having improved ethics, users breaking up ties with firms that utilize data unethically, etc. Coming up with a presentation necessitates that the majority of the effort goes into the content and the message you intend to convey. The visuals of a PowerPoint presentation can only be effective if it supplements and supports the story that is being told. Keeping this in mind our experts created Ethical Technology Utilization Highlighting Statistics Associated Responsible Technology Themes Pdf to reduce the time that goes into designing the presentation. This way, you can concentrate on the message while our designers take care of providing you with the right template for the situation. This slide provides information regarding major statistics associated with responsible technology such as percentage of users preferring brands that utilize ethical technologies and who prefer brands having improved ethics, users breaking up ties with firms that utilize data unethically, etc.
Key Statistics Associated With Fashion Industry Boutique Business Pictures Pdf
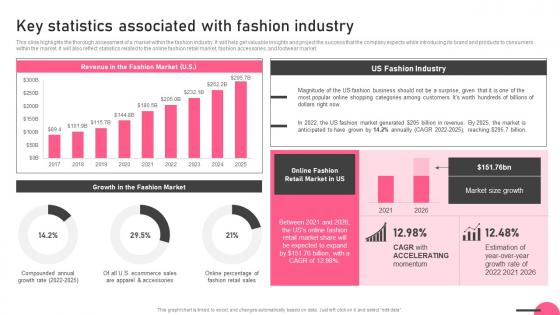
This slide highlights the thorough assessment of a market within the fashion industry. It will help get valuable insights and project the success that the company expects while introducing its brand and products to consumers within the market. It will also reflect statistics related to the online fashion retail market, fashion accessories, and footwear market. The best PPT templates are a great way to save time, energy, and resources. Slidegeeks have 100 percent editable powerpoint slides making them incredibly versatile. With these quality presentation templates, you can create a captivating and memorable presentation by combining visually appealing slides and effectively communicating your message. Download Key Statistics Associated With Fashion Industry Boutique Business Pictures Pdf from Slidegeeks and deliver a wonderful presentation. This slide highlights the thorough assessment of a market within the fashion industry. It will help get valuable insights and project the success that the company expects while introducing its brand and products to consumers within the market. It will also reflect statistics related to the online fashion retail market, fashion accessories, and footwear market.
Industry Statistics For Big Data In Digital Marketing Inspiration Pdf
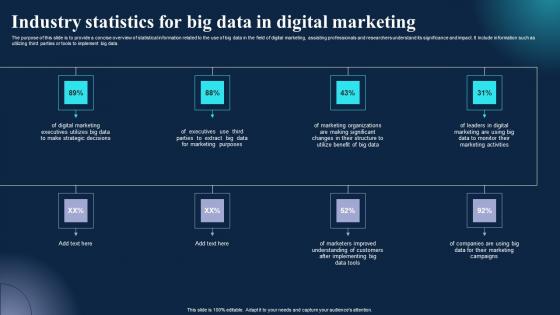
The purpose of this slide is to provide a concise overview of statistical information related to the use of big data in the field of digital marketing, assisting professionals and researchers understand its significance and impact. It include information such as utilizing third parties or tools to implement big data. Showcasing this set of slides titled Industry Statistics For Big Data In Digital Marketing Inspiration Pdf. The topics addressed in these templates are Strategic Decisions, Marketing Purposes, Data Tools. All the content presented in this PPT design is completely editable. Download it and make adjustments in color, background, font etc. as per your unique business setting. The purpose of this slide is to provide a concise overview of statistical information related to the use of big data in the field of digital marketing, assisting professionals and researchers understand its significance and impact. It include information such as utilizing third parties or tools to implement big data.
Email Marketing Statistics For Various Industries Icons Pdf
This slide illustrates the data for various elements of email marketing among different business industries. It includes email metrics such as open rate, CTR, unsubscribe rate in industries like automobile,finance,retail, food, legal services etc. Pitch your topic with ease and precision using this Email Marketing Statistics For Various Industries Icons Pdf. This layout presents information on Unsubscribe Rate, Industry Name, Open Rate . It is also available for immediate download and adjustment. So, changes can be made in the color, design, graphics or any other component to create a unique layout. This slide illustrates the data for various elements of email marketing among different business industries. It includes email metrics such as open rate, CTR, unsubscribe rate in industries like automobile,finance,retail, food, legal services etc.

Statistics Highlighting Monthly Goals Achieved By Production Department Graphics Pdf
Mentioned slide demonstrates monthly production goals accomplished by production and operations department. It includes key elements such as target units to be produced and actual goods produced by business. Showcasing this set of slides titled Statistics Highlighting Monthly Goals Achieved By Production Department Graphics Pdf. The topics addressed in these templates are Goods Produced. All the content presented in this PPT design is completely editable. Download it and make adjustments in color, background, font etc. as per your unique business setting. Mentioned slide demonstrates monthly production goals accomplished by production and operations department. It includes key elements such as target units to be produced and actual goods produced by business.
Statistics Associated Marketing Mix Communication Guide Client Brochure Pdf
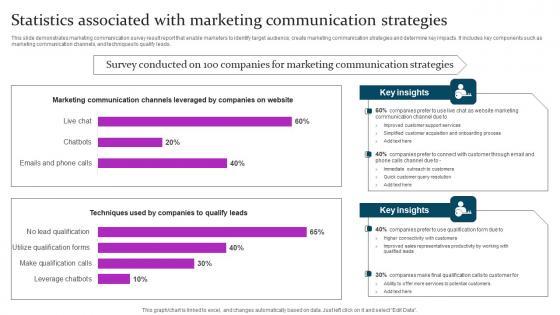
This slide demonstrates marketing communication survey result report that enable marketers to identify target audience, create marketing communication strategies and determine key impacts. It includes key components such as marketing communication channels, and techniques to qualify leads. Formulating a presentation can take up a lot of effort and time, so the content and message should always be the primary focus. The visuals of the PowerPoint can enhance the presenters message, so our Statistics Associated Marketing Mix Communication Guide Client Brochure Pdf was created to help save time. Instead of worrying about the design, the presenter can concentrate on the message while our designers work on creating the ideal templates for whatever situation is needed. Slidegeeks has experts for everything from amazing designs to valuable content, we have put everything into Statistics Associated Marketing Mix Communication Guide Client Brochure Pdf This slide demonstrates marketing communication survey result report that enable marketers to identify target audience, create marketing communication strategies and determine key impacts. It includes key components such as marketing communication channels, and techniques to qualify leads.
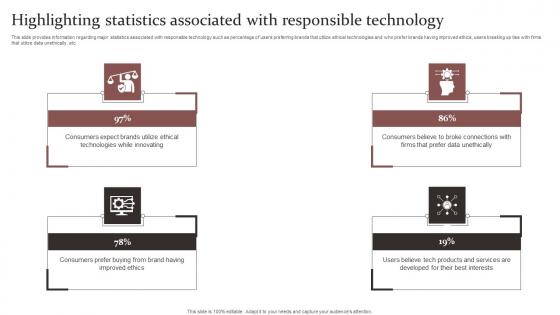
Highlighting Statistics Responsible Technology Governance Manual Demonstration Pdf
This slide provides information regarding major statistics associated with responsible technology such as percentage of users preferring brands that utilize ethical technologies and who prefer brands having improved ethics, users breaking up ties with firms that utilize data unethically, etc. Coming up with a presentation necessitates that the majority of the effort goes into the content and the message you intend to convey. The visuals of a PowerPoint presentation can only be effective if it supplements and supports the story that is being told. Keeping this in mind our experts created Highlighting Statistics Responsible Technology Governance Manual Demonstration Pdf to reduce the time that goes into designing the presentation. This way, you can concentrate on the message while our designers take care of providing you with the right template for the situation. This slide provides information regarding major statistics associated with responsible technology such as percentage of users preferring brands that utilize ethical technologies and who prefer brands having improved ethics, users breaking up ties with firms that utilize data unethically, etc.

Graph Statistics Business PowerPoint Templates And PowerPoint Backgrounds 0411
Microsoft PowerPoint Template and Background with business statistics in white with a green arrow Become a contributor with our Graph Statistics Business PowerPoint Templates And PowerPoint Backgrounds 0411. You will come out on top.

Statistics Graph Business PowerPoint Templates And PowerPoint Backgrounds 0511
Microsoft PowerPoint Template and Background with business statistics Deliver success with our Statistics Graph Business PowerPoint Templates And PowerPoint Backgrounds 0511. Download without worries with our money back guaranteee.

Statistics Stock Exchange Finance PowerPoint Templates And PowerPoint Backgrounds 0611
Microsoft PowerPoint Template and Background with statistics financial concept Deal with the matter in an even handed way. Continue to be cool with our Statistics Stock Exchange Finance PowerPoint Templates And PowerPoint Backgrounds 0611.
Business Statistics Arrow Success PowerPoint Templates And PowerPoint Backgrounds 1011
Microsoft PowerPoint Template and Background with business statistics in white with a green arrow Define growth with our Business Statistics Arrow Success PowerPoint Templates And PowerPoint Backgrounds 1011. Download without worries with our money back guaranteee.

Graph Statistics Business PowerPoint Themes And PowerPoint Slides 0411
Microsoft PowerPoint Theme and Slide with business statistics in white with a green arrow Enliven the event with our Graph Statistics Business PowerPoint Themes And PowerPoint Slides 0411. Create an atmosphere of festivity.

Statistics Graph Business PowerPoint Themes And PowerPoint Slides 0511
Microsoft PowerPoint Theme and Slide with business statistics Our Statistics Graph Business PowerPoint Themes And PowerPoint Slides 0511 provide a key feature. They help the audience concentrate in your thoughts.
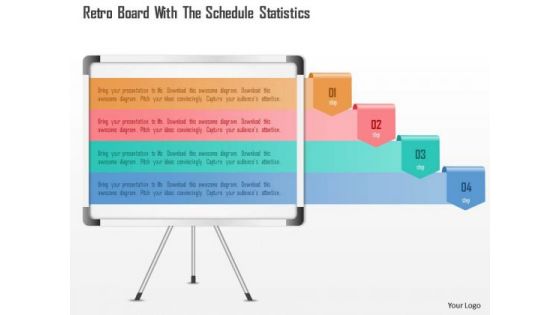
Business Diagram Retro Board With The Schedule Statistics PowerPoint Template
Explain the any business statistics with this power point template slide. This PPT slide contains the graphic of retro board with scheduled statistics. Use this PPT slide and display business information in your presentation.
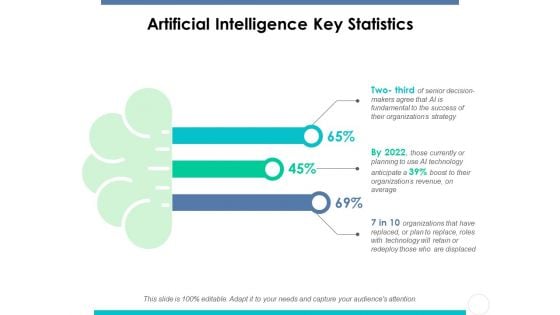
Artificial Intelligence Key Statistics Ppt PowerPoint Presentation Summary Graphics Tutorials
This is a artificial intelligence key statistics ppt powerpoint presentation summary graphics tutorials. This is a three stage process. The stages in this process are artificial, intelligence, statistics, business, marketing.
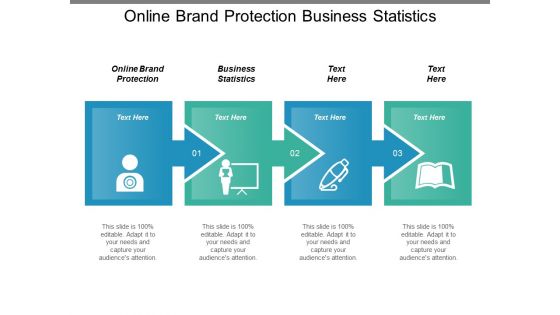
Online Brand Protection Business Statistics Ppt PowerPoint Presentation Portfolio Background
This is a online brand protection business statistics ppt powerpoint presentation portfolio background. This is a four stage process. The stages in this process are online brand protection, business statistics.
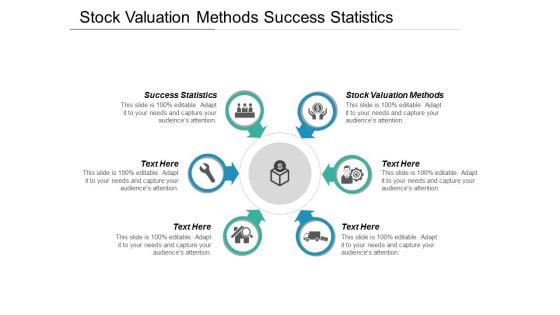
Stock Valuation Methods Success Statistics Ppt PowerPoint Presentation Ideas Picture
This is a stock valuation methods success statistics ppt powerpoint presentation ideas picture. This is a six stage process. The stages in this process are stock valuation methods, success statistics.
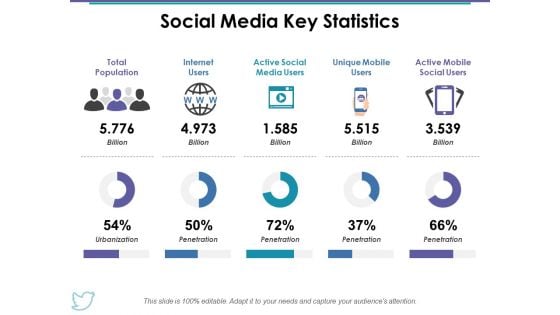
Social Media Key Statistics Ppt PowerPoint Presentation Summary Graphics Example
This is a social media key statistics ppt powerpoint presentation summary graphics example. This is a five stage process. The stages in this process are social media, key statistics, internet users, unique mobile users, business.
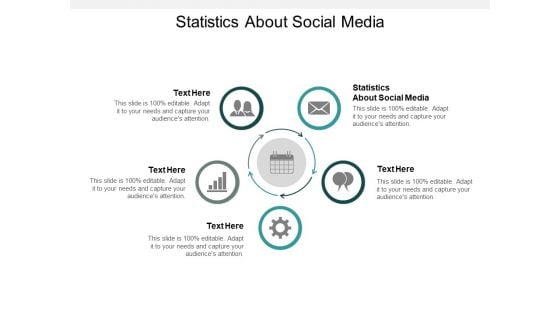
Statistics About Social Media Ppt PowerPoint Presentation Show Diagrams Cpb
This is a statistics about social media ppt powerpoint presentation show diagrams cpb. This is a five stage process. The stages in this process are statistics about social media.

 Home
Home