Status Icons
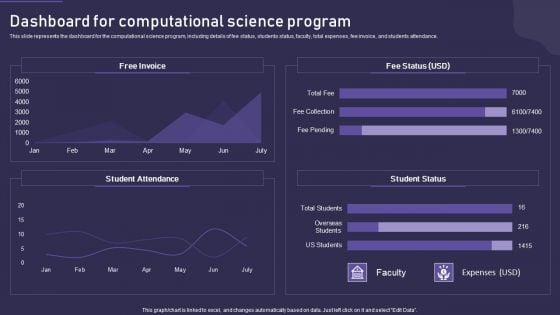
Computational Science Methodology Dashboard For Computational Science Program Structure PDF
This slide represents the dashboard for the computational science program, including details of fee status, students status, faculty, total expenses, fee invoice, and students attendance. Deliver an awe inspiring pitch with this creative Computational Science Methodology Dashboard For Computational Science Program Structure PDF bundle. Topics like Dashboard, Computational Science Program can be discussed with this completely editable template. It is available for immediate download depending on the needs and requirements of the user.
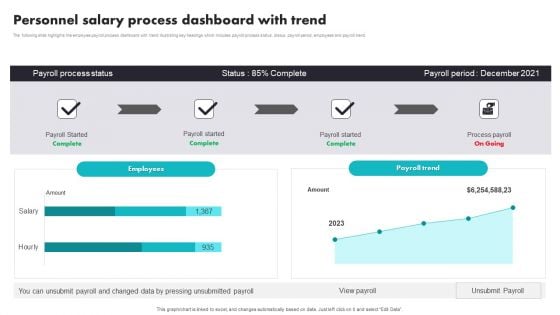
Personnel Salary Process Dashboard With Trend Brochure PDF
The following slide highlights the employee payroll process dashboard with trend illustrating key headings which includes payroll process status, status, payroll period, employees and payroll trend. Pitch your topic with ease and precision using this Personnel Salary Process Dashboard With Trend Brochure PDF. This layout presents information on Personnel Salary Process, Dashboard With Trend. It is also available for immediate download and adjustment. So, changes can be made in the color, design, graphics or any other component to create a unique layout.
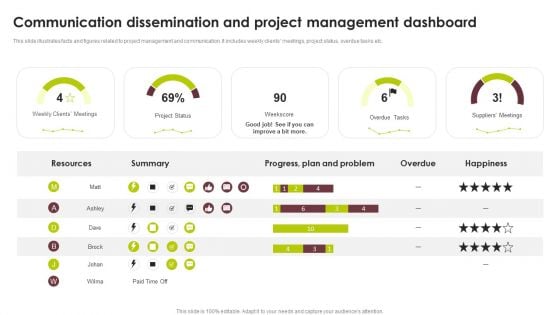
Communication Dissemination And Project Management Dashboard Inspiration PDF
This slide illustrates facts and figures related to project management and communication. It includes weekly clients meetings, project status, overdue tasks etc.Pitch your topic with ease and precision using this Communication Dissemination And Project Management Dashboard Inspiration PDF. This layout presents information on Progress Plan, Overdue Tasks, Project Status. It is also available for immediate download and adjustment. So, changes can be made in the color, design, graphics or any other component to create a unique layout.
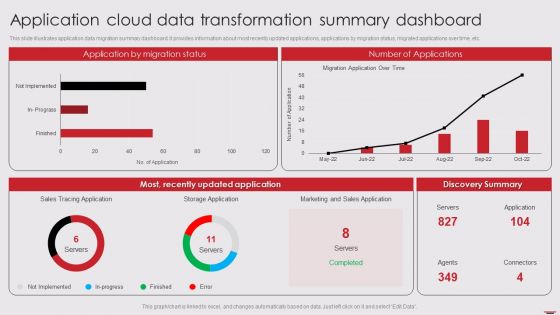
Application Cloud Data Transformation Summary Dashboard Mockup PDF
This slide illustrates application data migration summary dashboard. It provides information about most recently updated applications, applications by migration status, migrated applications over time, etc. Showcasing this set of slides titled Application Cloud Data Transformation Summary Dashboard Mockup PDF. The topics addressed in these templates are Application Migration Status, Number Applications, Most Recently Updated. All the content presented in this PPT design is completely editable. Download it and make adjustments in color, background, font etc. as per your unique business setting.
Cyber Protection And Precaution Tracking Dashboard Designs PDF
This slide shows the dashboard of cyber safety and security of an organization. It includes risk level, compliance status, tracking and security budget. Showcasing this set of slides titled Cyber Protection And Precaution Tracking Dashboard Designs PDF. The topics addressed in these templates are Risk, Compliance Status, Risk Level. All the content presented in this PPT design is completely editable. Download it and make adjustments in color, background, font etc. as per your unique business setting.
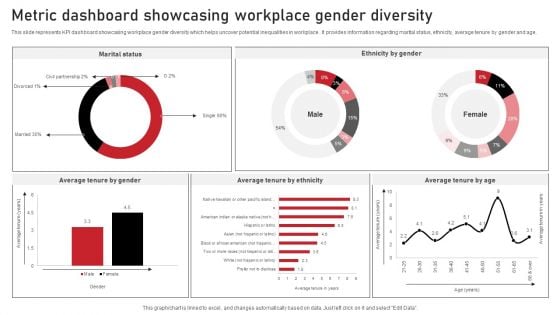
Metric Dashboard Showcasing Workplace Gender Diversity Microsoft PDF
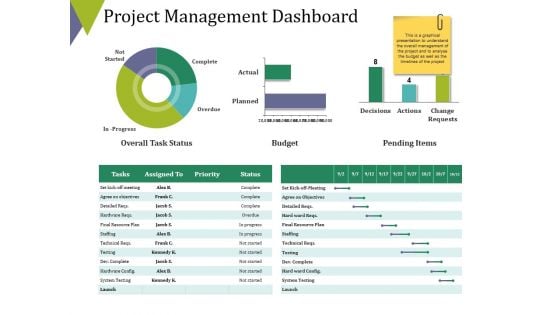
Project Management Dashboard Ppt PowerPoint Presentation Outline Summary
This is a project management dashboard ppt powerpoint presentation outline summary. This is a three stage process. The stages in this process are overall task status, budget, pending items, complete, overdue.
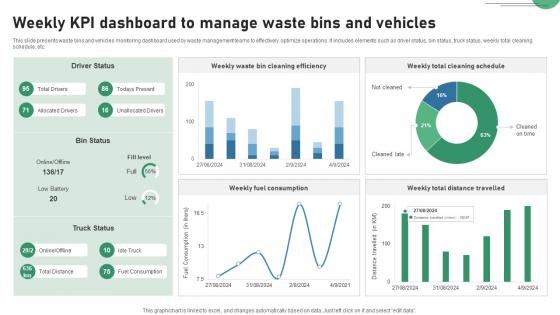
Weekly KPI Dashboard To Manage Waste Bins And Vehicles IOT Applications In Smart Waste IoT SS V
This slide presents waste bins and vehicles monitoring dashboard used by waste management teams to effectively optimize operations. It includes elements such as driver status, bin status, truck status, weekly total cleaning schedule, etc. Find highly impressive Weekly KPI Dashboard To Manage Waste Bins And Vehicles IOT Applications In Smart Waste IoT SS V on Slidegeeks to deliver a meaningful presentation. You can save an ample amount of time using these presentation templates. No need to worry to prepare everything from scratch because Slidegeeks experts have already done a huge research and work for you. You need to download Weekly KPI Dashboard To Manage Waste Bins And Vehicles IOT Applications In Smart Waste IoT SS V for your upcoming presentation. All the presentation templates are 100 percent editable and you can change the color and personalize the content accordingly. Download now. This slide presents waste bins and vehicles monitoring dashboard used by waste management teams to effectively optimize operations. It includes elements such as driver status, bin status, truck status, weekly total cleaning schedule, etc.
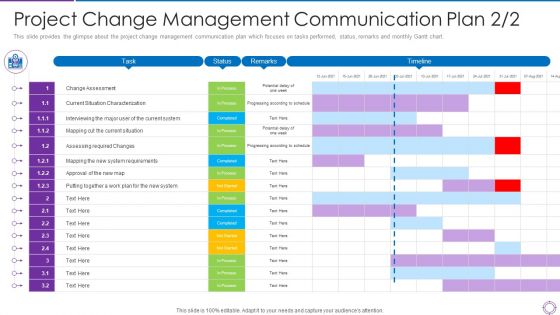
Project Administration Planning Project Change Management Communication Plan Map Ppt PowerPoint Presentation Gallery Microsoft PDF
This slide provides the glimpse about the project change management communication plan which focuses on tasks performed, status, remarks and monthly Gantt chart. Deliver and pitch your topic in the best possible manner with this project administration planning project change management communication plan map ppt powerpoint presentation gallery microsoft pdf. Use them to share invaluable insights on tasks performed, status, remarks, monthly gantt chart and impress your audience. This template can be altered and modified as per your expectations. So, grab it now.
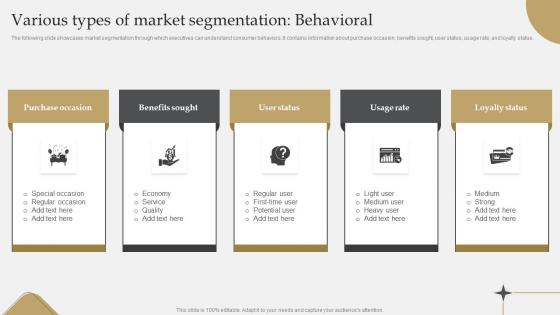
IT Industry Market Research Various Types Of Market Segmentation Behavioral Background Pdf
The following slide showcases market segmentation through which executives can understand consumer behaviors. It contains information about purchase occasion, benefits sought, user status, usage rate, and loyalty status. Are you searching for a IT Industry Market Research Various Types Of Market Segmentation Behavioral Background Pdf that is uncluttered, straightforward, and original It is easy to edit, and you can change the colors to suit your personal or business branding. For a presentation that expresses how much effort you have put in, this template is ideal With all of its features, including tables, diagrams, statistics, and lists, it is perfect for a business plan presentation. Make your ideas more appealing with these professional slides. Download IT Industry Market Research Various Types Of Market Segmentation Behavioral Background Pdf from Slidegeeks today. The following slide showcases market segmentation through which executives can understand consumer behaviors. It contains information about purchase occasion, benefits sought, user status, usage rate, and loyalty status.
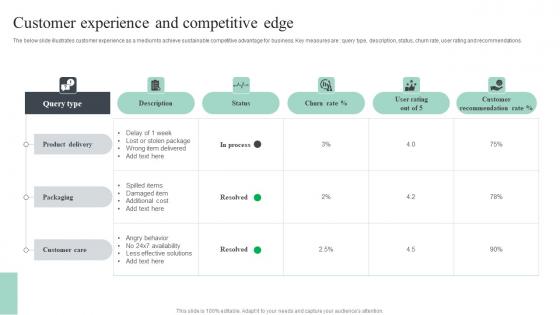
Customer Experience And Competitive Edge Diagrams Pdf
The below slide illustrates customer experience as a medium to achieve sustainable competitive advantage for business. Key measures are query type, description, status, churn rate, user rating and recommendations. Showcasing this set of slides titled Customer Experience And Competitive Edge Diagrams Pdf. The topics addressed in these templates are Product Delivery, Packaging, Customer Care. All the content presented in this PPT design is completely editable. Download it and make adjustments in color, background, font etc. as per your unique business setting. The below slide illustrates customer experience as a medium to achieve sustainable competitive advantage for business. Key measures are query type, description, status, churn rate, user rating and recommendations.
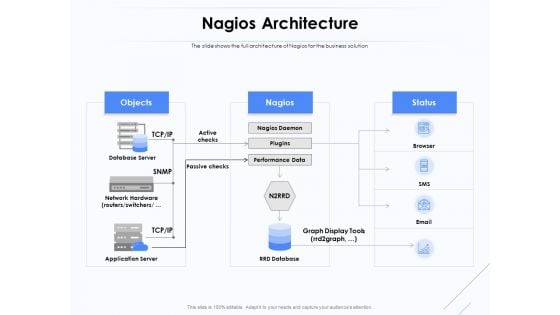
Network Monitoring Tool Overview Nagios Architecture Ppt PowerPoint Presentation Outline Vector PDF
Presenting this set of slides with name network monitoring tool overview nagios architecture ppt powerpoint presentation outline vector pdf. This is a four stage process. The stages in this process are objects, nagios, status, performance data, nagios daemon, rrd database, application server, database server. This is a completely editable PowerPoint presentation and is available for immediate download. Download now and impress your audience.
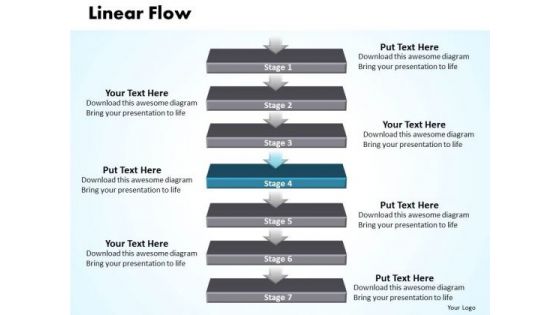
Usa Ppt Theme Non Linear Presentation PowerPoint Flow 7 States Diagram 5 Design
USA PPT Theme non linear presentation powerpoint flow 7 states diagram 5 design-Use this diagram to unravel the desired and essential elements of your overall strategy and demonstrate clearly how you intend to navigate them towards the desired corporate goal.-USA PPT Theme non linear presentation powerpoint flow 7 states diagram 5 design-Arrow, Background, Business, Chart, Diagram, Financial, Flow, Graphic, Gray, Icon, Illustration, Linear, Management, Orange, Perspective, Process, Reflection, Shapes, Stage, Text Our Usa Ppt Theme Non Linear Presentation PowerPoint Flow 7 States Diagram 5 Design will crown your ideas. They will get an exalted status.
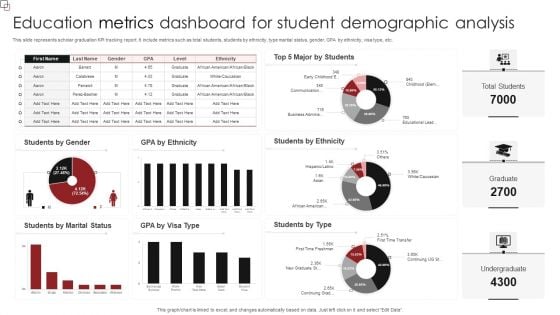
Education Metrics Dashboard For Student Demographic Analysis Diagrams PDF
This slide represents scholar graduation KPI tracking report. It include metrics such as total students, students by ethnicity, type marital status, gender, GPA by ethnicity, visa type, etc. Showcasing this set of slides titled Education Metrics Dashboard For Student Demographic Analysis Diagrams PDF. The topics addressed in these templates are Students Ethnicity, Students Type, Students Marital Status. All the content presented in this PPT design is completely editable. Download it and make adjustments in color, background, font etc. as per your unique business setting.
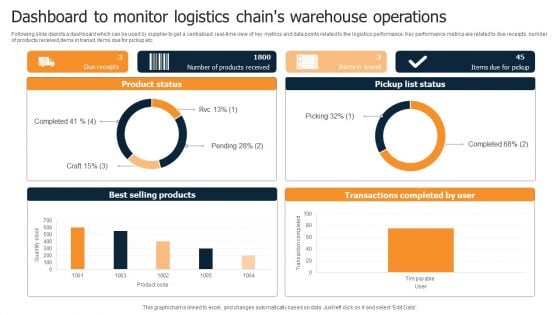
Dashboard To Monitor Logistics Chains Warehouse Operations Diagrams PDF
Following slide depicts a dashboard which can be used by supplier to get a centralized, real-time view of key metrics and data points related to the logistics performance. Key performance metrics are related to due receipts, number of products received,items in transit, items due for pickup etc. Pitch your topic with ease and precision using this Dashboard To Monitor Logistics Chains Warehouse Operations Diagrams PDF. This layout presents information on Product Status, Pickup List Status, Best Selling Products. It is also available for immediate download and adjustment. So, changes can be made in the color, design, graphics or any other component to create a unique layout.
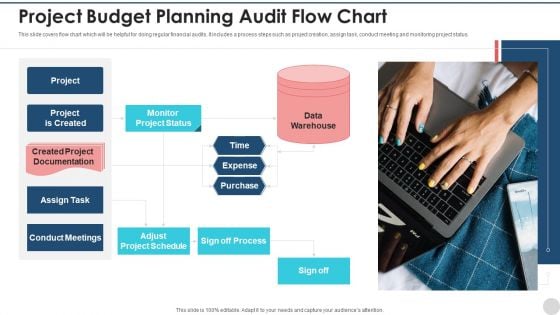
Project Budget Planning Audit Flow Chart Mockup PDF
This slide covers flow chart which will be helpful for doing regular financial audits. It includes a process steps such as project creation, assign task, conduct meeting and monitoring project status. Persuade your audience using this project budget planning audit flow chart mockup pdf. This PPT design covers one stages, thus making it a great tool to use. It also caters to a variety of topics including project, monitor project status, data warehouse, sign off process, assign task. Download this PPT design now to present a convincing pitch that not only emphasizes the topic but also showcases your presentation skills.
KPI Dashboard For Tracking Policy Administration Progress Summary Pdf
Following slide demonstrates KPI dashboard to monitor business policies progress to improve organisation performance. It includes key component such as policies pending for review policy verification in process, expired policies, policy by control status, etc. Showcasing this set of slides titled KPI Dashboard For Tracking Policy Administration Progress Summary Pdf. The topics addressed in these templates are Process, Expired Policies, Policy Control Status. All the content presented in this PPT design is completely editable. Download it and make adjustments in color, background, font etc. as per your unique business setting. Following slide demonstrates KPI dashboard to monitor business policies progress to improve organisation performance. It includes key component such as policies pending for review policy verification in process, expired policies, policy by control status, etc.
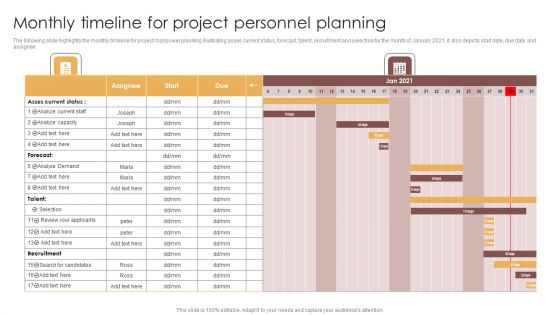
Monthly Timeline For Project Personnel Planning Themes PDF
The following slide highlights the monthly timeline for project manpower planning illustrating asses current status, forecast, talent, recruitment and selection for the month of January 2021, it also depicts start date, due date and assignee. Pitch your topic with ease and precision using this Monthly Timeline For Project Personnel Planning Themes PDF. This layout presents information on Asses Current Status, Forecast, Recruitment. It is also available for immediate download and adjustment. So, changes can be made in the color, design, graphics or any other component to create a unique layout.
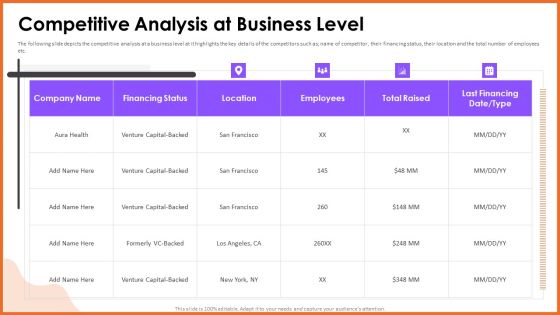
Competitive Analysis At Business Level Diagrams PDF
The following slide depicts the competitive analysis at a business level at it highlights the key details of the competitors such as name of competitor, their financing status, their location and the total number of employees etc. Deliver and pitch your topic in the best possible manner with this Competitive Analysis At Business Level Diagrams PDF. Use them to share invaluable insights on Financing Status, Total Raised, Capital Backed and impress your audience. This template can be altered and modified as per your expectations. So, grab it now.
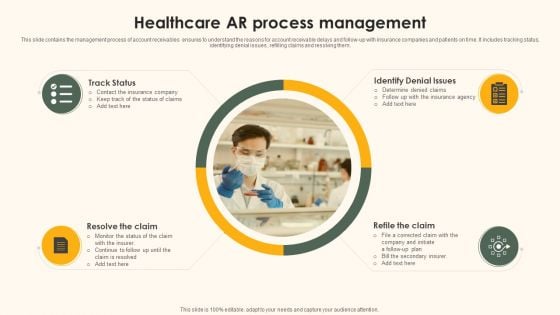
Healthcare AR Process Management Diagrams PDF
This slide contains the management process of account receivables ensures to understand the reasons for account receivable delays and follow-up with insurance companies and patients on time. It includes tracking status, identifying denial issues , refilling claims and resolving them. Pitch your topic with ease and precision using this Healthcare AR Process Management Diagrams PDF. This layout presents information on Identify Denial Issues, Refile The Claim, Resolve The Claim, Track Status. It is also available for immediate download and adjustment. So, changes can be made in the color, design, graphics or any other component to create a unique layout.
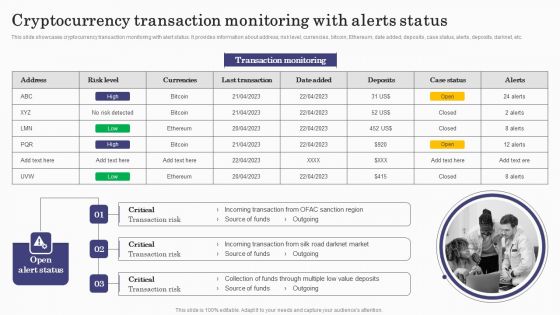
Deploying Banking Transaction Cryptocurrency Transaction Monitoring With Alerts Diagrams PDF
This slide showcases cryptocurrency transaction monitoring with alert status. It provides information about address, risk level, currencies, bitcoin, Ethereum, date added, deposits, case status, alerts, deposits, darknet, etc. From laying roadmaps to briefing everything in detail, our templates are perfect for you. You can set the stage with your presentation slides. All you have to do is download these easy-to-edit and customizable templates. Deploying Banking Transaction Cryptocurrency Transaction Monitoring With Alerts Diagrams PDF will help you deliver an outstanding performance that everyone would remember and praise you for. Do download this presentation today.
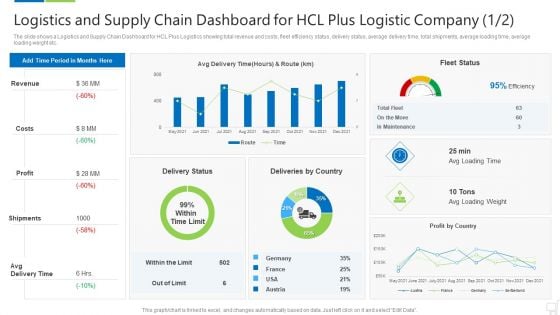
Logistics And Supply Chain Dashboard For Hcl Plus Logistic Company Revenue Themes PDF
The slide shows a Logistics and Supply Chain Dashboard for HCL Plus Logistics showing total revenue and costs, fleet efficiency status, delivery status, average delivery time, total shipments, average loading time, average loading weight etc. Deliver and pitch your topic in the best possible manner with this logistics and supply chain dashboard for hcl plus logistic company revenue themes pdf. Use them to share invaluable insights on revenue, costs, profit, shipments, avg delivery time and impress your audience. This template can be altered and modified as per your expectations. So, grab it now.

KPI Analysis Of HR Department On Power BI Ppt Powerpoint SS
The following slide showcases business sustainability resource planning sheet. It provides information about department, position, qualification required, experience required, current status. The best PPT templates are a great way to save time, energy, and resources. Slidegeeks have 100 percent editable powerpoint slides making them incredibly versatile. With these quality presentation templates, you can create a captivating and memorable presentation by combining visually appealing slides and effectively communicating your message. Download KPI Analysis Of HR Department On Power BI Ppt Powerpoint SS from Slidegeeks and deliver a wonderful presentation. The following slide showcases business sustainability resource planning sheet. It provides information about department, position, qualification required, experience required, current status.
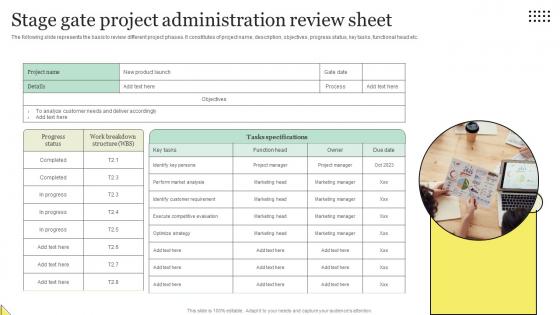
Stage Gate Project Administration Review Sheet Portrait Pdf
The following slide represents the basis to review different project phases. It constitutes of project name, description, objectives, progress status, key tasks, functional head etc. Pitch your topic with ease and precision using this Stage Gate Project Administration Review Sheet Portrait Pdf. This layout presents information on Identify Key Persons, Perform Market Analysis, Identify Customer Requirement. It is also available for immediate download and adjustment. So, changes can be made in the color, design, graphics or any other component to create a unique layout. The following slide represents the basis to review different project phases. It constitutes of project name, description, objectives, progress status, key tasks, functional head etc.
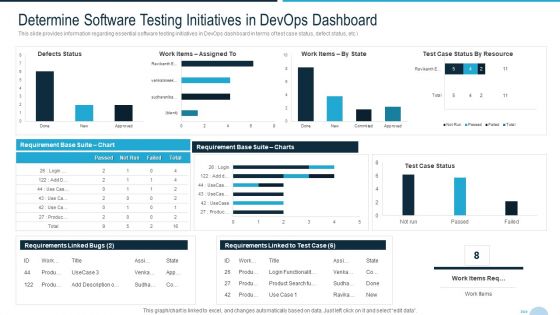
Development And Operations Quality Assurance And Validation IT Determine Software Testing Initiatives Elements PDF
This slide provides information regarding essential software testing initiatives in DevOps dashboard in terms of test case status, defect status, etc.Deliver and pitch your topic in the best possible manner with this development and operations quality assurance and validation it determine software testing initiatives elements pdf Use them to share invaluable insights on requirement base suite charts, requirements linked to test case, requirements linked bugs and impress your audience. This template can be altered and modified as per your expectations. So, grab it now.
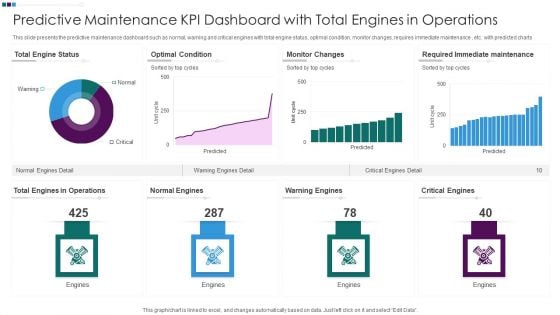
Predictive Maintenance KPI Dashboard With Total Engines In Operations Ppt Professional Inspiration PDF
This slide presents the predictive maintenance dashboard such as normal, warning and critical engines with total engine status, optimal condition, monitor changes, requires immediate maintenance , etc. with predicted charts. Pitch your topic with ease and precision using this Predictive Maintenance KPI Dashboard With Total Engines In Operations Ppt Professional Inspiration PDF. This layout presents information on Total Engine Status, Optimal Condition Monitor, Changes Warning Engines, Required Immediate Maintenance. It is also available for immediate download and adjustment. So, changes can be made in the color, design, graphics or any other component to create a unique layout.
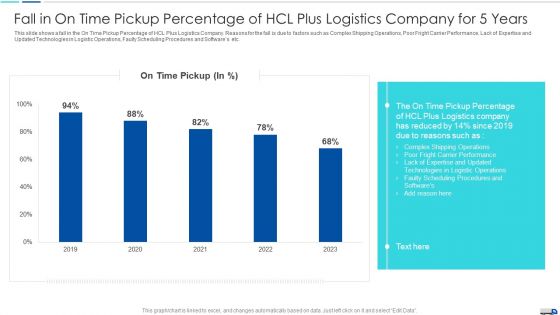
Initiatives To Produce Effective Concept For Logistic Firm Logistics And Supply Chain Brochure PDF
The slide shows a Logistics and Supply Chain Dashboard for HCL Plus Logistics showing total revenue and costs, fleet efficiency status, delivery status, average delivery time, total shipments, average loading time, average loading weight etc. Deliver an awe inspiring pitch with this creative initiatives to produce effective concept for logistic firm logistics and supply chain brochure pdf bundle. Topics like revenue, costs, profit can be discussed with this completely editable template. It is available for immediate download depending on the needs and requirements of the user.
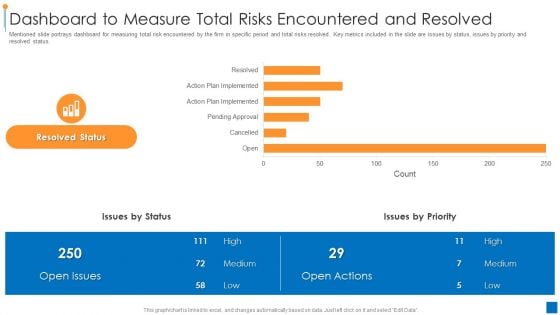
International Organization Standardization 270001 Dashboard To Measure Total Risks Encountered And Resolved Demonstration PDF
Mentioned slide portrays dashboard for measuring total risk encountered by the firm in specific period and total risks resolved. Key metrics included in the slide are issues by status, issues by priority and resolved status. Deliver and pitch your topic in the best possible manner with this international organization standardization 270001 dashboard to measure total risks encountered and resolved demonstration pdf. Use them to share invaluable insights on dashboard to measure total risks encountered and resolved and impress your audience. This template can be altered and modified as per your expectations. So, grab it now.
Cybersecurity Dashboard For Threat Tracking In Electronic Information Security Ppt Ideas Graphics PDF
This slide depicts the dashboard for threat tracking in cyber security by covering monthly threat status, current risk status, threat based on the role, threats by owners, risk by threats, and threat report. Deliver an awe inspiring pitch with this creative cybersecurity dashboard for threat tracking in electronic information security ppt ideas graphics pdf bundle. Topics like dashboard for threat tracking in electronic information security can be discussed with this completely editable template. It is available for immediate download depending on the needs and requirements of the user.
Desktop Security Management Dashboard For Threat Tracking In Computer Security Guidelines PDF
This slide depicts the dashboard for threat tracking in cyber security by covering monthly threat status, current risk status, threat based on the role, threats by owners, risk by threats, and threat report. Deliver an awe inspiring pitch with this creative desktop security management dashboard for threat tracking in computer security guidelines pdf bundle. Topics like threats by owners, risk by threats can be discussed with this completely editable template. It is available for immediate download depending on the needs and requirements of the user.
Dashboard For Threat Tracking In Information Technology Security Ppt Portfolio Shapes PDF
This slide depicts the dashboard for threat tracking in network security by covering monthly threat status, current risk status, threat-based on the role, threats by owners, risk by threats, and threat report. Deliver and pitch your topic in the best possible manner with this dashboard for threat tracking in information technology security ppt portfolio shapes pdf. Use them to share invaluable insights on dashboard for threat tracking in information technology security and impress your audience. This template can be altered and modified as per your expectations. So, grab it now.
Transformation Plan Issues Tracking Dashboard For Transition Project Ppt Summary Layouts PDF
This slide shows the issues tracking the dashboard for the business transition project. It provides details of multiple issues faced by users to keep records for effective management of the project. Deliver and pitch your topic in the best possible manner with this transformation plan issues tracking dashboard for transition project ppt summary layouts pdf. Use them to share invaluable insights on employee wise issues status, overall issues status, immediate issues, suspect requirements and impress your audience. This template can be altered and modified as per your expectations. So, grab it now.
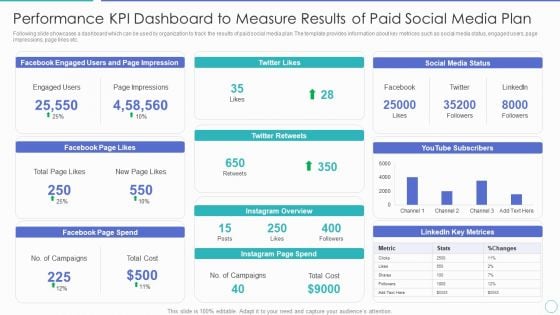
Performance KPI Dashboard To Measure Results Of Paid Social Media Plan Ppt PowerPoint Presentation Gallery Format Ideas PDF
Following slide showcases a dashboard which can be used by organization to track the results of paid social media plan. The template provides information about key metrices such as social media status, engaged users, page impressions, page likes etc. Pitch your topic with ease and precision using this performance kpi dashboard to measure results of paid social media plan ppt powerpoint presentation gallery format ideas pdf. This layout presents information on social media status, instagram page spend, facebook page spend, facebook page likes. It is also available for immediate download and adjustment. So, changes can be made in the color, design, graphics or any other component to create a unique layout.
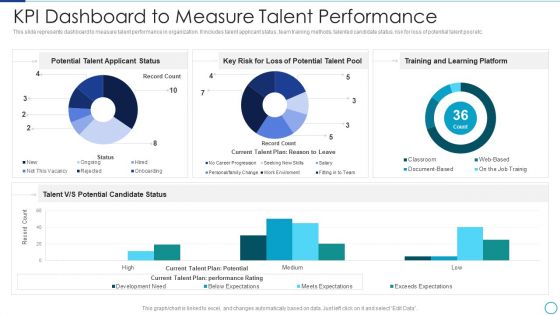
Workforce Management Strategies For Effective Hiring Process Kpi Dashboard To Measure Talent Performance Formats PDF
This slide represents dashboard to measure talent performance in organization. It includes talent applicant status, team training methods, talented candidate status, risk for loss of potential talent pool etc. Deliver an awe inspiring pitch with this creative Workforce Management Strategies For Effective Hiring Process Kpi Dashboard To Measure Talent Performance Formats PDF bundle. Topics like Potential Candidate, Talent Performance, Learning Platform can be discussed with this completely editable template. It is available for immediate download depending on the needs and requirements of the user.
Automating Supply Chain Dashboard For Tracking Impact Of Warehouse House Automation Graphics PDF
This slide covers the dashboard with after automation warehouse overview. It include KPIs such as autonomous robots status, robotic arms status, battery level, performance, time to return, etc. Deliver and pitch your topic in the best possible manner with this Automating Supply Chain Dashboard For Tracking Impact Of Warehouse House Automation Graphics PDF. Use them to share invaluable insights on Autonomous Robot, Robotic Arms, Systems Engineer and impress your audience. This template can be altered and modified as per your expectations. So, grab it now.
Implementation Strategy For Project Solution Dashboard For Issues Tracking Summary PDF
This slide shows the issues tracking the dashboard for the business transition project. It provides details of multiple issues faced by users to keep records for effective management of the project. Deliver an awe inspiring pitch with this creative Implementation Strategy For Project Solution Dashboard For Issues Tracking Summary PDF bundle. Topics like Overall Issues Status, Employee Wise Issues Status, Immediate Issues can be discussed with this completely editable template. It is available for immediate download depending on the needs and requirements of the user.
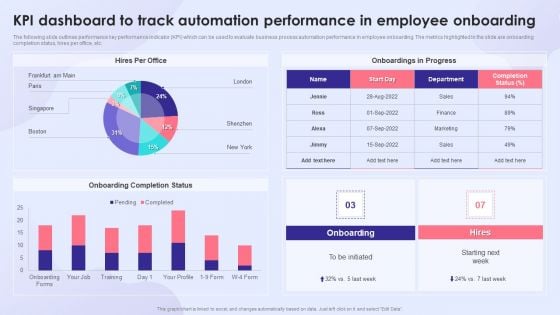
KPI Dashboard To Track Automation Performance In Employee Onboarding Introduction PDF
The following slide outlines performance key performance indicator KPI which can be used to evaluate business process automation performance in employee onboarding. The metrics highlighted in the slide are onboarding completion status, hires per office, etc. Deliver an awe inspiring pitch with this creative KPI Dashboard To Track Automation Performance In Employee Onboarding Introduction PDF bundle. Topics like Onboarding Completion Status, Onboardings In Progress, Employee Onboarding can be discussed with this completely editable template. It is available for immediate download depending on the needs and requirements of the user.
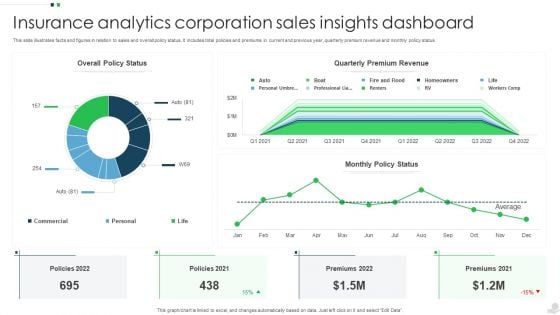
Insurance Analytics Corporation Sales Insights Dashboard Structure PDF
This slide illustrates facts and figures in relation to sales and overall policy status. It includes total policies and premiums in current and previous year, quarterly premium revenue and monthly policy status. Pitch your topic with ease and precision using this Insurance Analytics Corporation Sales Insights Dashboard Structure PDF. This layout presents information on Quarterly Premium Revenue, Sales Insights Dashboard, Insurance Analytics Corporation. It is also available for immediate download and adjustment. So, changes can be made in the color, design, graphics or any other component to create a unique layout.
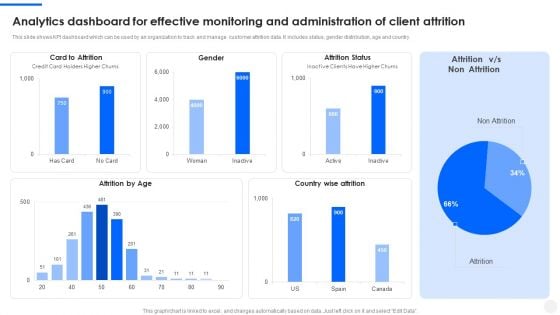
Analytics Dashboard For Effective Monitoring And Administration Of Client Attrition Portrait PDF
This slide shows KPI dashboard which can be used by an organization to track and manage customer attrition data. It includes status, gender distribution, age and country. Showcasing this set of slides titled Analytics Dashboard For Effective Monitoring And Administration Of Client Attrition Portrait PDF. The topics addressed in these templates are Attrition Status, Card To Attrition, Country Wise Attrition. All the content presented in this PPT design is completely editable. Download it and make adjustments in color, background, font etc. as per your unique business setting.
IT Security Hacker Dashboard For Threat Tracking Rules PDF
This slide depicts the dashboard for threat tracking through cyber security measures and ethical hackers by covering monthly threat status, current risk status, threat-based on the role, threats by owners, risk by threats, and threat report.Deliver an awe inspiring pitch with this creative IT Security Hacker Dashboard For Threat Tracking Rules PDF bundle. Topics like Threat Dashboard, Loss Of Information, Regulations And Contracts can be discussed with this completely editable template. It is available for immediate download depending on the needs and requirements of the user.
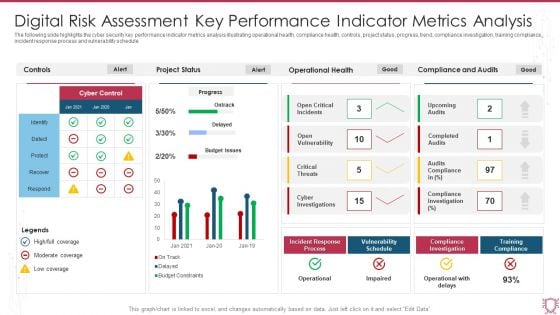
Digital Risk Assessment Key Performance Indicator Metrics Analysis Infographics PDF
The following slide highlights the cyber security key performance indicator metrics analysis illustrating operational health, compliance health, controls, project status, progress, trend, compliance investigation, training compliance, incident response process and vulnerability schedule. Showcasing this set of slides titled Digital Risk Assessment Key Performance Indicator Metrics Analysis Infographics PDF. The topics addressed in these templates are Project Status, Operational Health, Compliance And Audits. All the content presented in this PPT design is completely editable. Download it and make adjustments in color, background, font etc. as per your unique business setting.
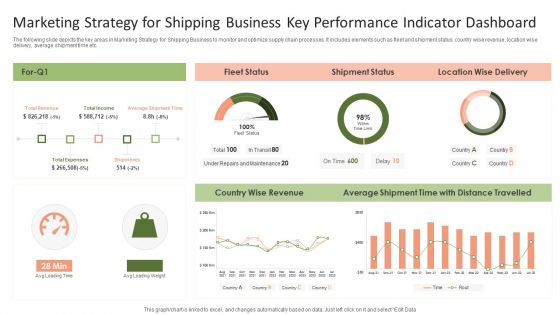
Marketing Strategy For Shipping Business Key Performance Indicator Dashboard Graphics PDF
The following slide depicts the key areas in Marketing Strategy for Shipping Business to monitor and optimize supply chain processes. It includes elements such as fleet and shipment status, country wise revenue, location wise delivery, average shipment time etc.Pitch your topic with ease and precision using this Marketing Strategy For Shipping Business Key Performance Indicator Dashboard Graphics PDF. This layout presents information on Shipment Status, Average Shipment, Wise Revenue. It is also available for immediate download and adjustment. So, changes can be made in the color, design, graphics or any other component to create a unique layout.
Company Financials Performance Tracking Dashboard Brochure PDF
This slide illustrates KPI dashboard that can be used by organizations to track their financial performance on company basis. Kpis covered in the slide are contract status, revenue, cost of goods, overdue and task status. Showcasing this set of slides titled Company Financials Performance Tracking Dashboard Brochure PDF. The topics addressed in these templates are Report Shortcut, Revenue Cost, Overdue Task. All the content presented in this PPT design is completely editable. Download it and make adjustments in color, background, font etc. as per your unique business setting.
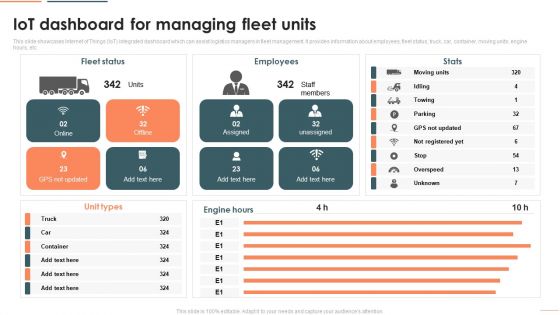
Deploying Iot In Logistics And Supply Chain Iot Dashboard For Managing Fleet Units Download PDF
This slide showcases Internet of Things IoT integrated dashboard which can assist logistics managers in fleet management. It provides information about employees, fleet status, truck, car, container, moving units, engine hours, etc. Deliver and pitch your topic in the best possible manner with this Deploying Iot In Logistics And Supply Chain Iot Dashboard For Managing Fleet Units Download PDF. Use them to share invaluable insights on Fleet Status, Employees, Unit Types and impress your audience. This template can be altered and modified as per your expectations. So, grab it now.
Warehouse Automation Deployment Dashboard For Tracking Impact Of Warehouse House Infographics PDF
This slide covers the dashboard with after automation warehouse overview. It include KPIs such as autonomous robots status, robotic arms status, battery level, performance, time to return, etc. Deliver and pitch your topic in the best possible manner with this Warehouse Automation Deployment Dashboard For Tracking Impact Of Warehouse House Infographics PDF. Use them to share invaluable insights on Autonomous Robot, Systems Engineer, Warehouse Manager and impress your audience. This template can be altered and modified as per your expectations. So, grab it now.
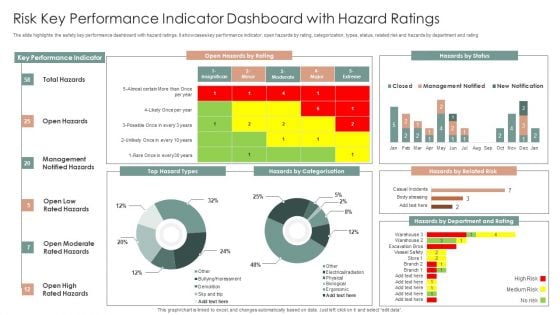
Risk Key Performance Indicator Dashboard With Hazard Ratings Ppt Layouts Slideshow PDF
The slide highlights the safety key performance dashboard with hazard ratings. It showcases key performance indicator, open hazards by rating, categorization, types, status, related risk and hazards by department and rating. Showcasing this set of slides titled Risk Key Performance Indicator Dashboard With Hazard Ratings Ppt Layouts Slideshow PDF. The topics addressed in these templates are Key Performance Indicator, Open Hazards, Hazards By Status. All the content presented in this PPT design is completely editable. Download it and make adjustments in color, background, font etc. as per your unique business setting.

Infrastructure Expansion KPI Dashboard For Investment Project Management Inspiration PDF
This slide covers management dashboard for analyzing the project performance and progress. It include KPIs such as total claims to date, total costs to date, project status, profits, number of days left, etc. Showcasing this set of slides titled Infrastructure Expansion KPI Dashboard For Investment Project Management Inspiration PDF. The topics addressed in these templates are Claims And Costs, Project Status, Profits. All the content presented in this PPT design is completely editable. Download it and make adjustments in color, background, font etc. as per your unique business setting.
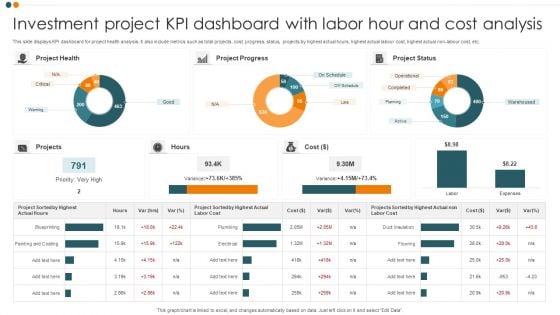
Investment Project KPI Dashboard With Labor Hour And Cost Analysis Portrait PDF
This slide displays KPI dashboard for project health analysis. It also include metrics such as total projects, cost, progress, status, projects by highest actual hours, highest actual labour cost, highest actual non-labour cost, etc. Pitch your topic with ease and precision using this Investment Project KPI Dashboard With Labor Hour And Cost Analysis Portrait PDF. This layout presents information on Project Health, Project Progress, Project Status. It is also available for immediate download and adjustment. So, changes can be made in the color, design, graphics or any other component to create a unique layout.
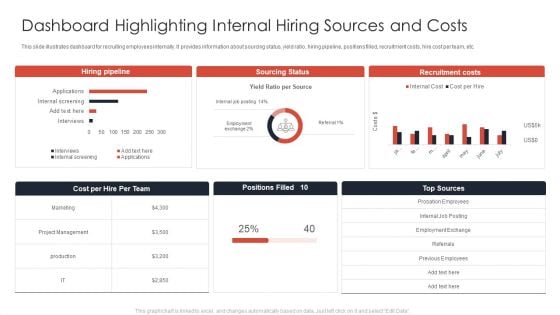
Dashboard Highlighting Internal Hiring Sources And Costs Ppt Show Templates PDF
This slide illustrates dashboard for recruiting employees internally. It provides information about sourcing status, yield ratio, hiring pipeline, positions filled, recruitment costs, hire cost per team, etc. Showcasing this set of slides titled Dashboard Highlighting Internal Hiring Sources And Costs Ppt Show Templates PDF. The topics addressed in these templates are Hiring Pipeline, Sourcing Status, Recruitment Costs. All the content presented in this PPT design is completely editable. Download it and make adjustments in color, background, font etc. as per your unique business setting.
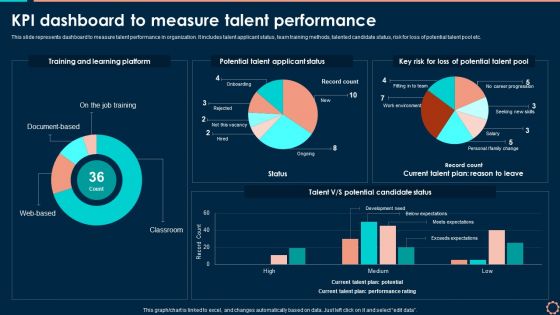
KPI Dashboard To Measure Talent Performance Slides PDF
This slide represents dashboard to measure talent performance in organization. It includes talent applicant status, team training methods, talented candidate status, risk for loss of potential talent pool etc. Get a simple yet stunning designed KPI Dashboard To Measure Talent Performance Slides PDF. It is the best one to establish the tone in your meetings. It is an excellent way to make your presentations highly effective. So, download this PPT today from Slidegeeks and see the positive impacts. Our easy to edit KPI Dashboard To Measure Talent Performance Slides PDF can be your go-to option for all upcoming conferences and meetings. So, what are you waiting for Grab this template today.
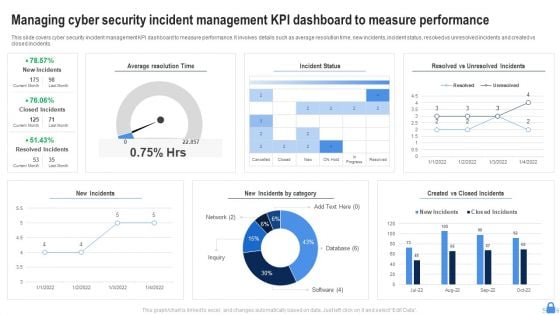
Managing Cyber Security Incident Management KPI Dashboard To Measure Performance Download PDF
This slide covers cyber security incident management KPI dashboard to measure performance. It involves details such as average resolution time, new incidents, incident status, resolved vs unresolved incidents and created vs closed incidents. Showcasing this set of slides titled Managing Cyber Security Incident Management KPI Dashboard To Measure Performance Download PDF. The topics addressed in these templates are Average Resolution Time, Incident Status, New Incidents. All the content presented in this PPT design is completely editable. Download it and make adjustments in color, background, font etc. as per your unique business setting.
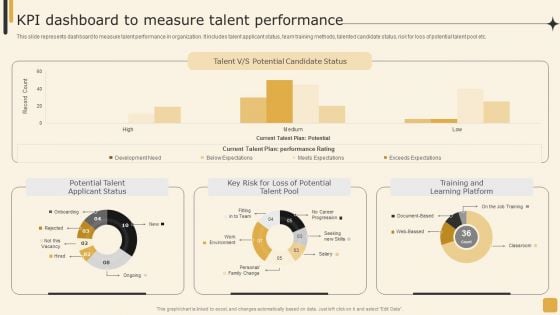
Kpi Dashboard To Measure Talent Performance Employee Performance Management Tactics Professional PDF
This slide represents dashboard to measure talent performance in organization. It includes talent applicant status, team training methods, talented candidate status, risk for loss of potential talent pool etc.The Kpi Dashboard To Measure Talent Performance Employee Performance Management Tactics Professional PDF is a compilation of the most recent design trends as a series of slides. It is suitable for any subject or industry presentation, containing attractive visuals and photo spots for businesses to clearly express their messages. This template contains a variety of slides for the user to input data, such as structures to contrast two elements, bullet points, and slides for written information. Slidegeeks is prepared to create an impression.
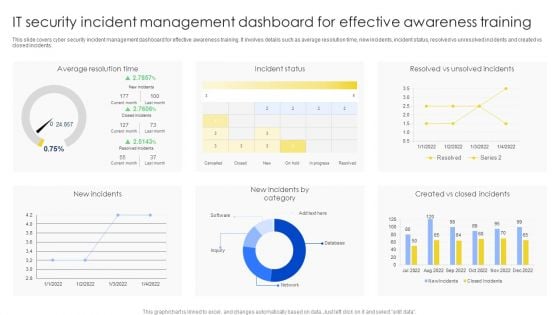
IT Security Incident Management Dashboard For Effective Awareness Training Pictures PDF
This slide covers cyber security incident management dashboard for effective awareness training. It involves details such as average resolution time, new incidents, incident status, resolved vs unresolved incidents and created vs closed incidents. Showcasing this set of slides titled IT Security Incident Management Dashboard For Effective Awareness Training Pictures PDF. The topics addressed in these templates are Average Resolution Time, Incident Status, New Incidents. All the content presented in this PPT design is completely editable. Download it and make adjustments in color, background, font etc. as per your unique business setting.
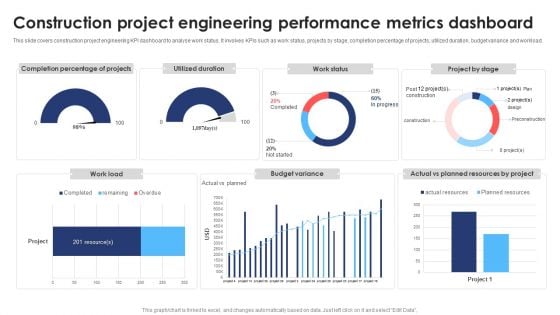
Construction Project Engineering Performance Metrics Dashboard Ideas PDF
This slide covers construction project engineering KPI dashboard to analyse work status. It involves KPIs such as work status, projects by stage, completion percentage of projects, utilized duration, budget variance and workload. Showcasing this set of slides titled Construction Project Engineering Performance Metrics Dashboard Ideas PDF. The topics addressed in these templates are Budget Variance, Resource, Project. All the content presented in this PPT design is completely editable. Download it and make adjustments in color, background, font etc. as per your unique business setting.
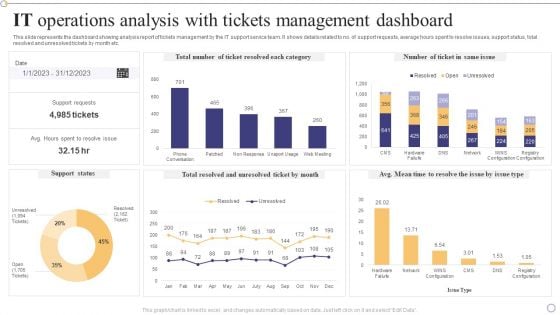
IT Operations Analysis With Tickets Management Dashboard Formats PDF
This slide represents the dashboard showing analysis report of tickets management by the IT support service team. It shows details related to no. of support requests, average hours spent to resolve issues, support status, total resolved and unresolved tickets by month etc.Showcasing this set of slides titled IT Operations Analysis With Tickets Management Dashboard Formats PDF. The topics addressed in these templates are Support Requests, Unresolved Ticket, Support Status. All the content presented in this PPT design is completely editable. Download it and make adjustments in color, background, font etc. as per your unique business setting.
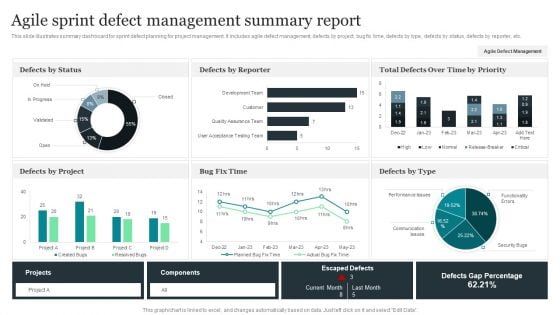
Agile Sprint Defect Management Summary Report Structure PDF
This slide illustrates summary dashboard for sprint defect planning for project management. It includes agile defect management, defects by project, bug fix time, defects by type, defects by status, defects by reporter, etc. Showcasing this set of slides titled Agile Sprint Defect Management Summary Report Structure PDF. The topics addressed in these templates are Defects By Status, Defects By Reporter, Bug Fix Time. All the content presented in this PPT design is completely editable. Download it and make adjustments in color, background, font etc. as per your unique business setting.
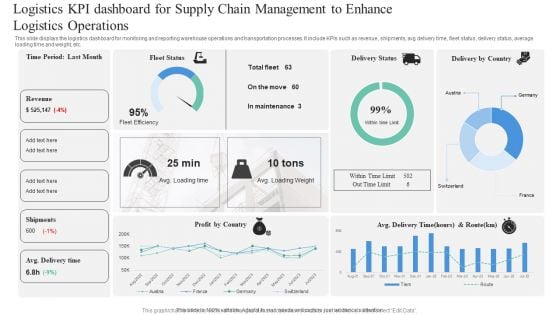
Logistics KPI Dashboard For Supply Chain Management To Enhance Logistics Operations Professional PDF
This slide displays the logistics dashboard for monitoring and reporting warehouse operations and transportation processes. It include KPIs such as revenue, shipments, avg delivery time, fleet status, delivery status, average loading time and weight, etc. Pitch your topic with ease and precision using this Logistics KPI Dashboard For Supply Chain Management To Enhance Logistics Operations Professional PDF. This layout presents information on Logistics KPI, Dashboard For Supply Chain, Management To Enhance, Logistics Operations. It is also available for immediate download and adjustment. So, changes can be made in the color, design, graphics or any other component to create a unique layout.
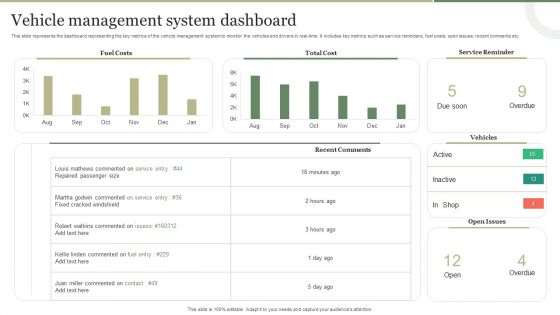
Vehicle Management System Dashboard Graphics PDF
This slide represents the dashboard to help fleet managers to monitor the vehicles and the drivers in real-time. It represents KPIs such as vehicle status, service reminders, open issues, inspections summary, service costs etc. Pitch your topic with ease and precision using this Vehicle Management System Dashboard Graphics PDF. This layout presents information on Vehicle Management System, Representing Maintenance Status. It is also available for immediate download and adjustment. So, changes can be made in the color, design, graphics or any other component to create a unique layout.
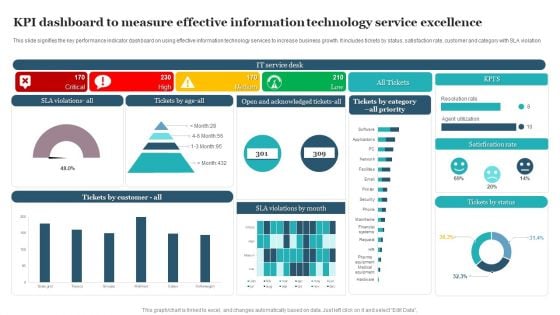
KPI Dashboard To Measure Effective Information Technology Service Excellence Information PDF
This slide signifies the key performance indicator dashboard on using effective information technology services to increase business growth. It includes tickets by status, satisfaction rate, customer and category with SLA violation. Showcasing this set of slides titled KPI Dashboard To Measure Effective Information Technology Service Excellence Information PDF. The topics addressed in these templates are Satisfication Rate, Tickets Status, Service Desk. All the content presented in this PPT design is completely editable. Download it and make adjustments in color, background, font etc. as per your unique business setting.
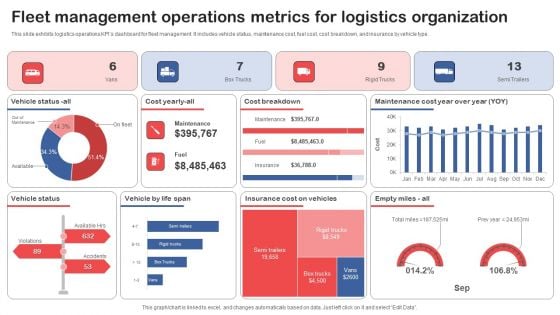
Fleet Management Operations Metrics For Logistics Organization Graphics PDF
This slide exhibits logistics operations KPIs dashboard for fleet management. It includes vehicle status, maintenance cost, fuel cost, cost breakdown, and insurance by vehicle type. Pitch your topic with ease and precision using this Fleet Management Operations Metrics For Logistics Organization Graphics PDF. This layout presents information on Cost Breakdown, Vehicle Status, Vehicle By Life Span. It is also available for immediate download and adjustment. So, changes can be made in the color, design, graphics or any other component to create a unique layout.


 Continue with Email

 Home
Home


