Stock Market Analysis
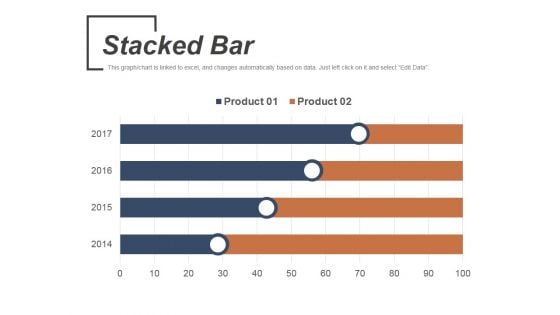
Stacked Bar Template 1 Ppt PowerPoint Presentation Infographic Template Format
This is a stacked bar template 1 ppt powerpoint presentation infographic template format. This is a four stage process. The stages in this process are product, stacked bar, business, marketing, bar graph.
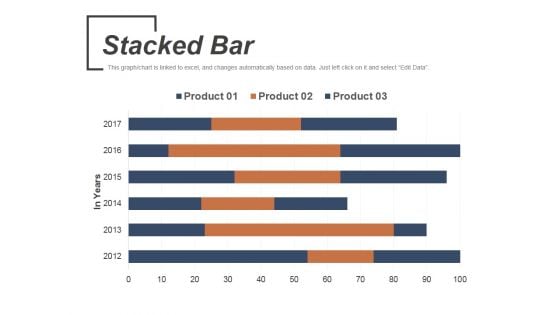
Stacked Bar Template 2 Ppt PowerPoint Presentation Slides Introduction
This is a stacked bar template 2 ppt powerpoint presentation slides introduction. This is a six stage process. The stages in this process are product, stacked bar, business, marketing, in years.
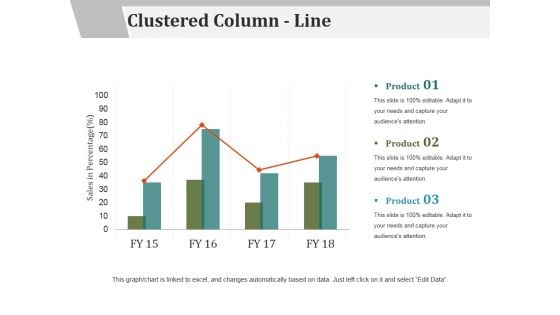
Clustered Column Line Ppt PowerPoint Presentation File Examples
This is a clustered column line ppt powerpoint presentation file examples. This is a three stage process. The stages in this process are sales in percentage, product, business, marketing, success.
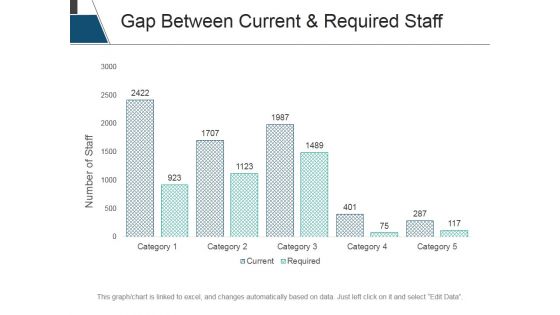
Gap Between Current And Required Staff Ppt PowerPoint Presentation File Tips
This is a gap between current and required staff ppt powerpoint presentation file tips. This is a five stage process. The stages in this process are number of staff, bar graph, business, marketing, success.
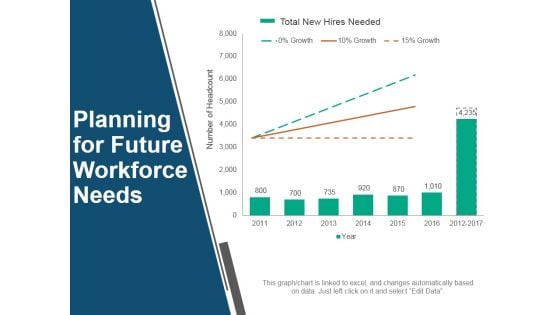
Planning For Future Workforce Needs Ppt PowerPoint Presentation Outline Templates
This is a planning for future workforce needs ppt powerpoint presentation outline templates. This is a seven stage process. The stages in this process are total new hires needed, planning, business, marketing, success.
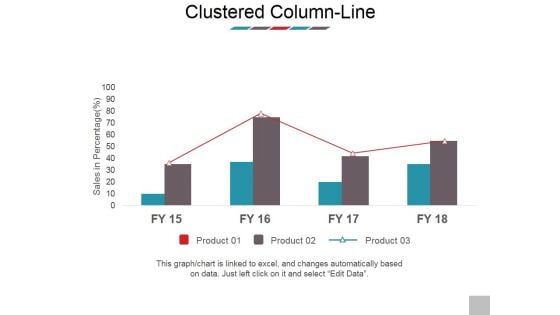
Clustered Column Line Ppt PowerPoint Presentation Model Images
This is a clustered column line ppt powerpoint presentation model images. This is a four stage process. The stages in this process are sales in percentage, product, business, marketing, bar graph.
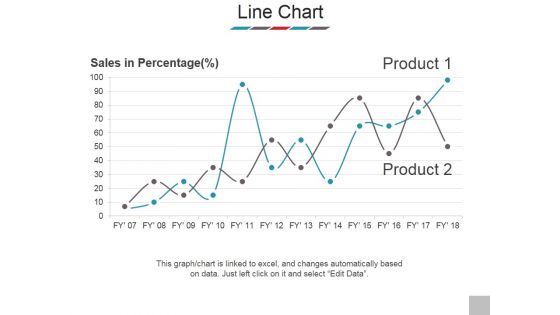
Line Chart Ppt PowerPoint Presentation Outline Samples
This is a line chart ppt powerpoint presentation outline samples. This is a two stage process. The stages in this process are sales in percentage, product, business, marketing, success.
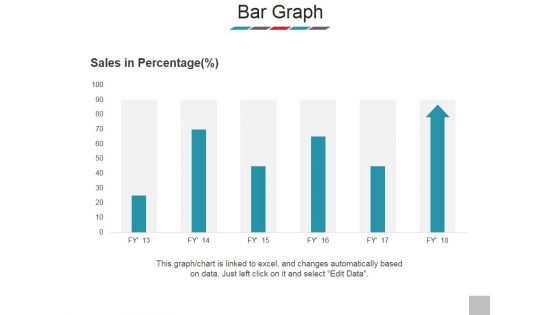
Bar Graph Ppt PowerPoint Presentation Model Clipart
This is a bar graph ppt powerpoint presentation model clipart. This is a six stage process. The stages in this process are sales in percentage, product, bar graph, business, marketing.
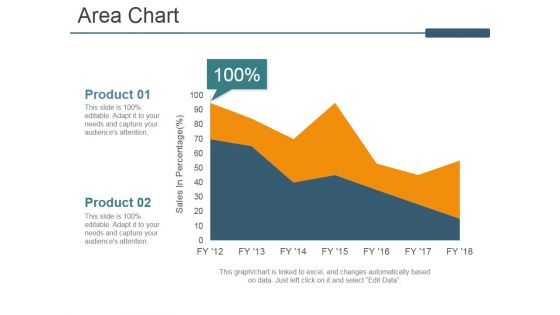
Area Chart Ppt PowerPoint Presentation Inspiration Rules
This is a area chart ppt powerpoint presentation inspiration rules. This is a two stage process. The stages in this process are area chart, business, marketing, sales in percentage, product.
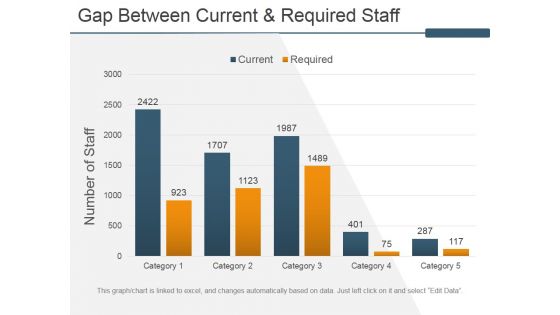
Gap Between Current And Required Staff Ppt PowerPoint Presentation Inspiration Slides
This is a gap between current and required staff ppt powerpoint presentation inspiration slides. This is a five stage process. The stages in this process are number of staff, bar graph, business, marketing, success.
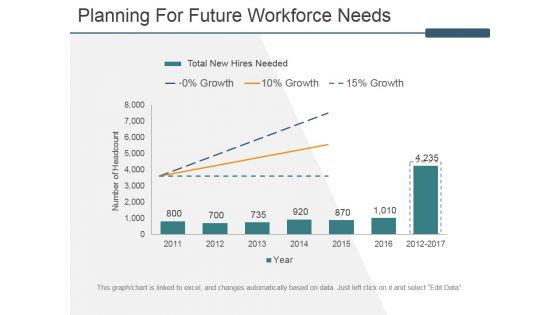
Planning For Future Workforce Needs Ppt PowerPoint Presentation Ideas Design Ideas
This is a planning for future workforce needs ppt powerpoint presentation ideas design ideas. This is a seven stage process. The stages in this process are total new hires needed, growth, business, marketing, success.
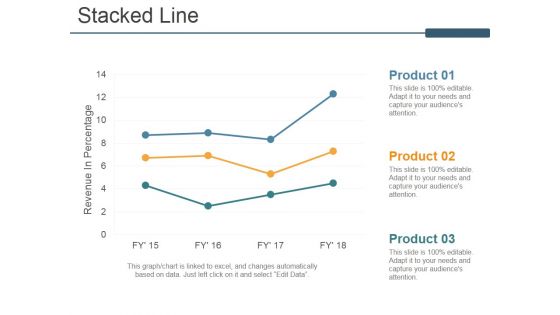
Stacked Line Ppt PowerPoint Presentation Ideas Model
This is a stacked line ppt powerpoint presentation ideas model. This is a three stage process. The stages in this process are revenue in percentage, stacked line, product, business, marketing.
Quarter Track Record Ppt PowerPoint Presentation Icon Files
This is a quarter track record ppt powerpoint presentation icon files. This is a two stage process. The stages in this process are quarter, track record, business, marketing, presentation.
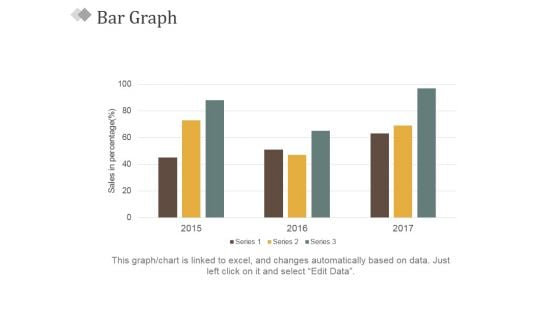
Bar Graph Ppt PowerPoint Presentation Slides Visual Aids
This is a bar graph ppt powerpoint presentation slides visual aids. This is a three stage process. The stages in this process are sales in percentage, bar graph, business, marketing, success.
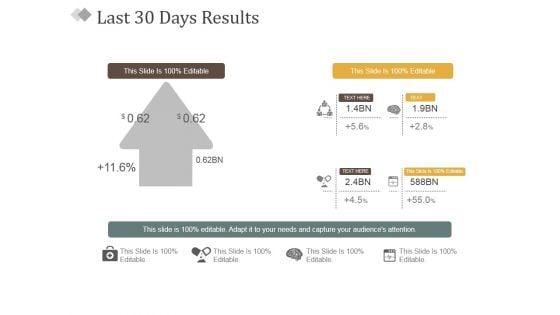
Last 30 Days Results Ppt PowerPoint Presentation Infographic Template Example
This is a last 30 days results ppt powerpoint presentation infographic template example. This is a two stage process. The stages in this process are results, business, presentation, marketing, success.
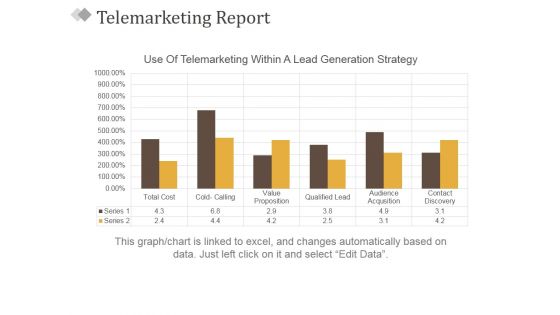
Telemarketing Report Template 2 Ppt PowerPoint Presentation Styles Model
This is a telemarketing report template 2 ppt powerpoint presentation styles model. This is a six stage process. The stages in this process are use of telemarketing within a lead generation strategy, business, bar graph, marketing, success.
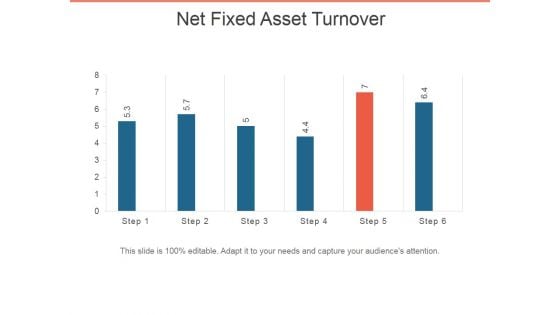
Net Fixed Asset Turnover Ppt PowerPoint Presentation Infographic Template Pictures
This is a net fixed asset turnover ppt powerpoint presentation infographic template pictures. This is a six stage process. The stages in this process are bar graph, business, marketing, presentation, success.
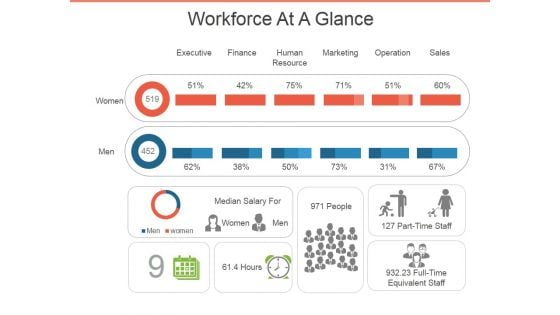
Workforce At A Glance Ppt PowerPoint Presentation Infographic Template Topics
This is a workforce at a glance ppt powerpoint presentation infographic template topics. This is a eight stage process. The stages in this process are executive, finance, human resource, marketing, operation, sales.
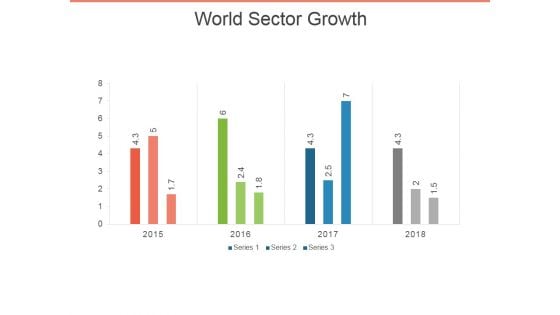
World Sector Growth Ppt PowerPoint Presentation Infographics Objects
This is a world sector growth ppt powerpoint presentation infographics objects. This is a four stage process. The stages in this process are bar graph, business, marketing, success, presentation.
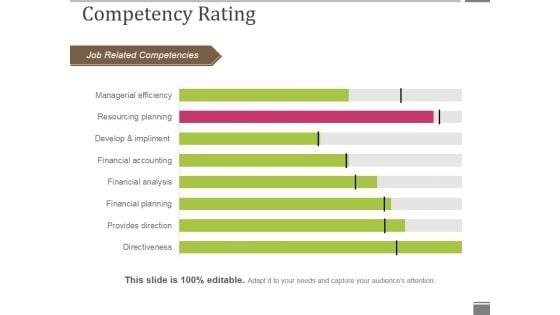
Competency Rating Template 1 Ppt PowerPoint Presentation Outline Smartart
This is a competency rating template 1 ppt powerpoint presentation outline smartart. This is a eight stage process. The stages in this process are job related competencies, competency rating, bar graph, business, marketing.
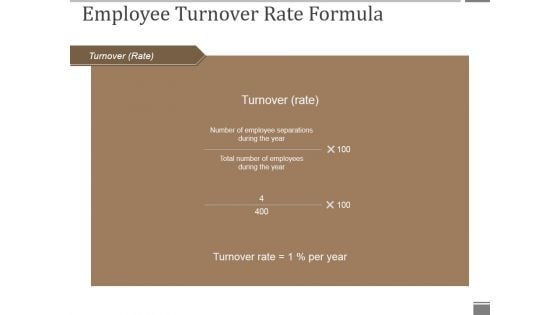
Employee Turnover Rate Formula Ppt PowerPoint Presentation Pictures Aids
This is a employee turnover rate formula ppt powerpoint presentation pictures aids. This is a five stage process. The stages in this process are employee turnover, rate of tune over, business, marketing, bar graph.
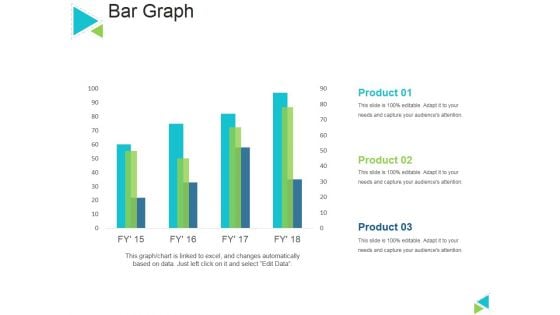
Bar Graph Ppt PowerPoint Presentation Outline Layout
This is a bar graph ppt powerpoint presentation outline layout. This is a four stage process. The stages in this process are sales in percentage, product, bar graph, business, marketing.
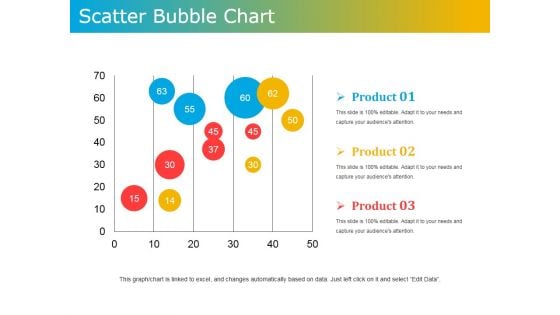
Scatter Bubble Chart Ppt PowerPoint Presentation Ideas Design Templates
This is a scatter bubble chart ppt powerpoint presentation ideas design templates. This is a three stage process. The stages in this process are product, scatter, bubble chart, business, marketing.
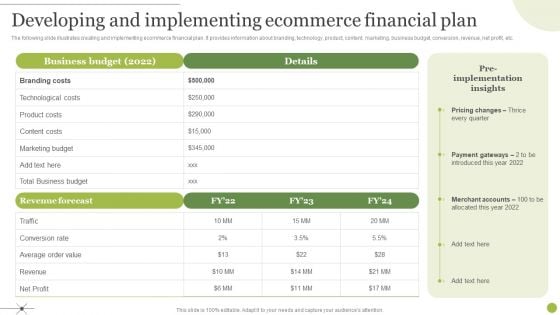
Managing E Commerce Business Accounting Developing And Implementing Ecommerce Financial Plan Designs PDF
The following slide illustrates creating and implementing ecommerce financial plan. It provides information about branding, technology, product, content, marketing, business budget, conversion, revenue, net profit, etc. From laying roadmaps to briefing everything in detail, our templates are perfect for you. You can set the stage with your presentation slides. All you have to do is download these easy to edit and customizable templates. Managing E Commerce Business Accounting Developing And Implementing Ecommerce Financial Plan Designs PDF will help you deliver an outstanding performance that everyone would remember and praise you for. Do download this presentation today.
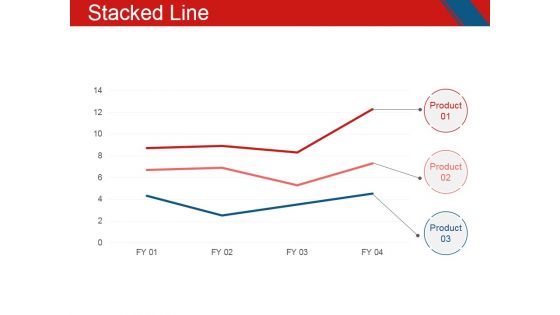
Stacked Line Ppt PowerPoint Presentation Styles Graphic Images
This is a stacked line ppt powerpoint presentation styles graphic images. This is a three stage process. The stages in this process are business, marketing, finance, stacked line, management.
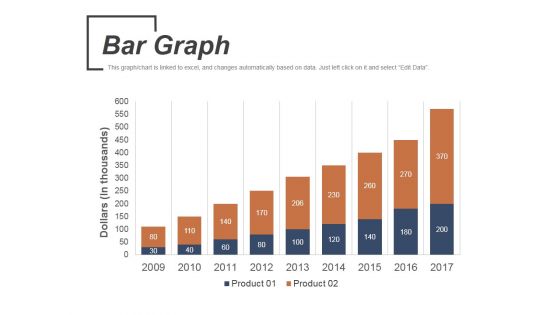
Bar Graph Ppt PowerPoint Presentation Outline Design Templates
This is a bar graph ppt powerpoint presentation outline design templates. This is a nine stage process. The stages in this process are bar graph, management, planning, strategy, marketing.
Clustered Bar Template 1 Ppt PowerPoint Presentation Icon Gallery
This is a clustered bar template 1 ppt powerpoint presentation icon gallery. This is a four stage process. The stages in this process are finance, management, planning, strategy, marketing.
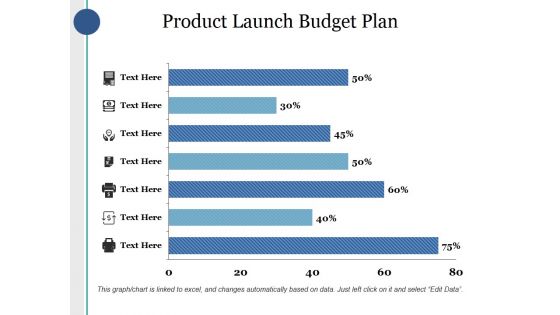
Product Launch Budget Plan Ppt PowerPoint Presentation Professional Templates
This is a product launch budget plan ppt powerpoint presentation professional templates. This is a seven stage process. The stages in this process are percentage, finance, marketing, management, business.
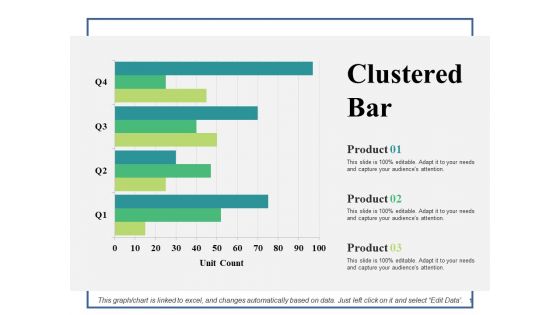
Clustered Bar Ppt PowerPoint Presentation Infographic Template Infographics
This is a clustered bar ppt powerpoint presentation infographic template infographics. This is a three stage process. The stages in this process are clustered bar, finance, planning, management, marketing.
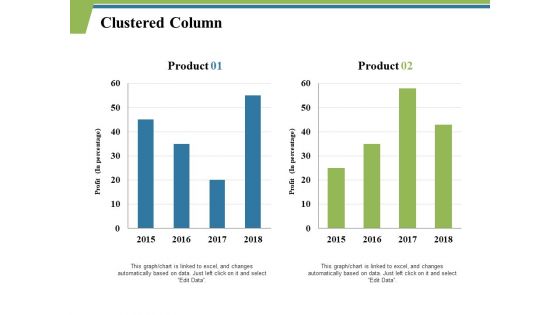
Clustered Column Ppt PowerPoint Presentation Gallery Master Slide
This is a clustered column ppt powerpoint presentation gallery master slide. This is a two stage process. The stages in this process are clustered column, finance, marketing, management, investment.
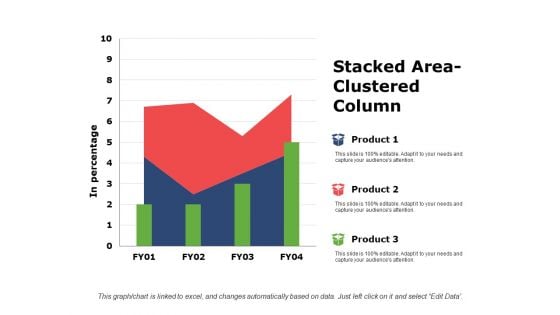
Stacked Area Clustered Column Ppt PowerPoint Presentation Show Outline
This is a stacked area clustered column ppt powerpoint presentation show outline. This is a three stage process. The stages in this process are stacked area, clustered column, finance, marketing, management.

Area Chart Finance Ppt PowerPoint Presentation Show Brochure
This is a area chart finance ppt powerpoint presentation show brochure. This is a two stage process. The stages in this process are area chart, finance, marketing, management, investment.
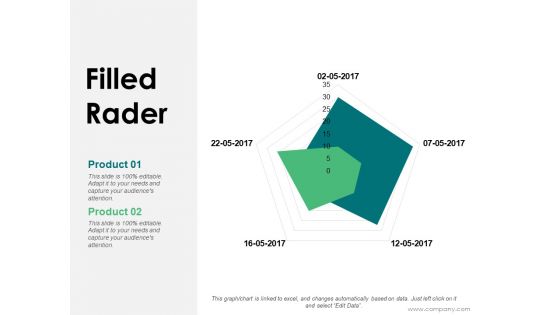
Filled Rader Ppt PowerPoint Presentation Visual Aids Example 2015
This is a filled rader ppt powerpoint presentation visual aids example 2015. This is a two stage process. The stages in this process are filled rader, finance, marketing, management, investment.
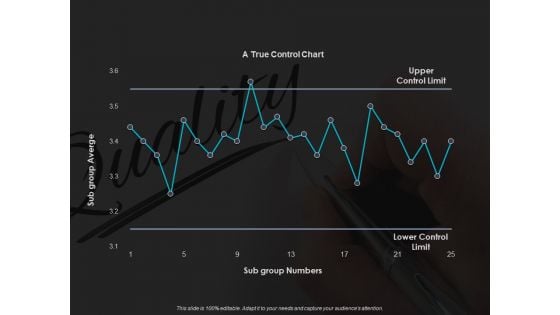
Control Charts A True Control Chart Ppt PowerPoint Presentation Inspiration Examples
This is a control charts a true control chart ppt powerpoint presentation inspiration examples. This is a five stage process. The stages in this process are product, percentage, marketing, business, management.
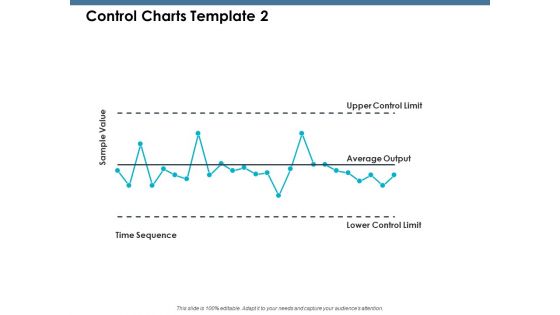
Control Charts Sample Value Ppt PowerPoint Presentation Infographics Demonstration
This is a control charts sample value ppt powerpoint presentation infographics demonstration. This is a five stage process. The stages in this process are product, percentage, marketing, business, management.
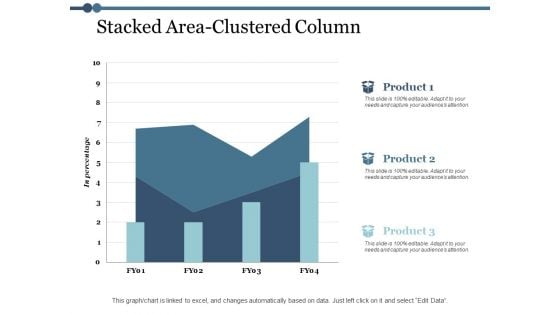
Stacked Area Clustered Column Ppt PowerPoint Presentation Model Topics
This is a stacked area clustered column ppt powerpoint presentation model topics. This is a three stage process. The stages in this process are area chart, finance, marketing, management, investment.
Stacked Area Clustered Column Ppt PowerPoint Presentation Icon Examples
This is a stacked area clustered column ppt powerpoint presentation icon examples. This is a three stage process. The stages in this process are percentage, product, management, marketing, business.
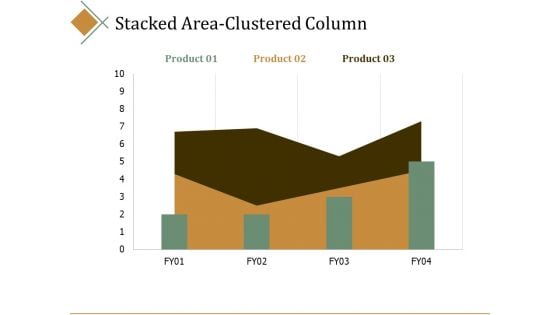
Stacked Area Clustered Column Ppt PowerPoint Presentation Infographics Portrait
This is a stacked area clustered column ppt powerpoint presentation infographics portrait. This is a three stage process. The stages in this process are percentage, product, business, management, marketing.
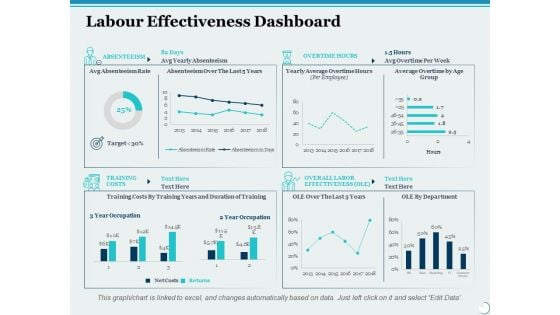
Labour Effectiveness Dashboard Ppt PowerPoint Presentation Slides File Formats
This is a labour effectiveness dashboard ppt powerpoint presentation slides file formats. This is a four stage process. The stages in this process are percentage, product, management, marketing, business.
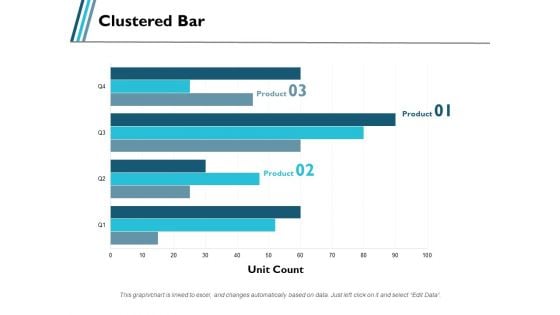
Clustered Bar Business Product Ppt PowerPoint Presentation Gallery Background
This is a clustered bar business product ppt powerpoint presentation gallery background. This is a three stage process. The stages in this process are business, management, marketing, percentage, product.
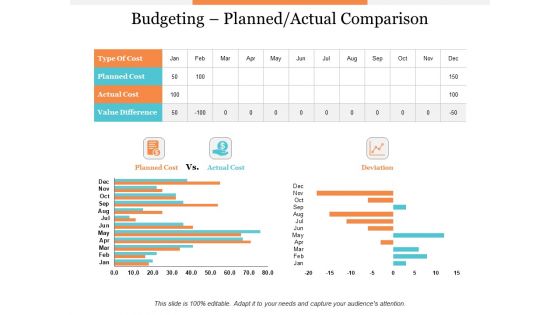
Budgeting Planned Actual Comparison Ppt PowerPoint Presentation Styles File Formats
This is a budgeting planned actual comparison ppt powerpoint presentation styles file formats. This is a three stage process. The stages in this process are product, percentage, business, management, marketing.
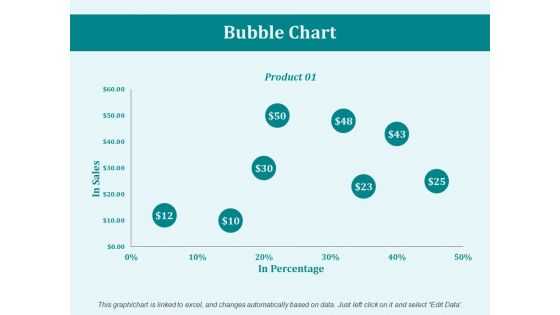
Bubble Chart Product Ppt PowerPoint Presentation Inspiration Design Ideas
This is a bubble chart product ppt powerpoint presentation inspiration design ideas. This is a one stage process. The stages in this process are business, management, marketing, product, percentage.
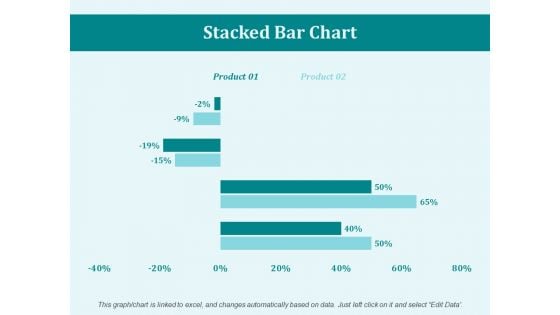
Stacked Bar Chart Percentage Ppt PowerPoint Presentation Portfolio Mockup
This is a stacked bar chart percentage ppt powerpoint presentation portfolio mockup. This is a two stage process. The stages in this process are business, marketing, management, percentage, product.

Area Chart Percentage Ppt PowerPoint Presentation Portfolio Pictures
This is a area chart percentage ppt powerpoint presentation portfolio pictures. This is a three stage process. The stages in this process are area chart, finance, marketing, management, investment.
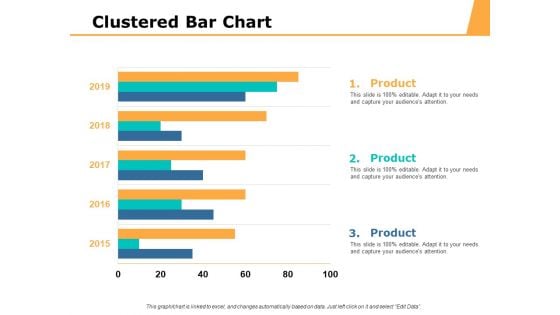
Clustered Bar Chart Percentage Product Ppt PowerPoint Presentation Portfolio Example Introduction
This is a clustered bar chart percentage product ppt powerpoint presentation portfolio example introduction. This is a three stage process. The stages in this process are area chart, finance, marketing, management, investment.
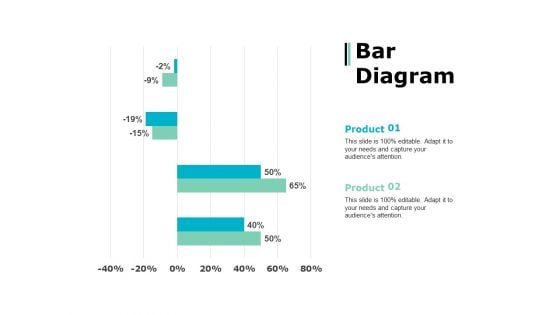
Bar Diagram Percentage Product Ppt PowerPoint Presentation Show Topics
This is a bar diagram percentage product ppt powerpoint presentation show topics. This is a two stage process. The stages in this process are percentage, product, business, management, marketing.
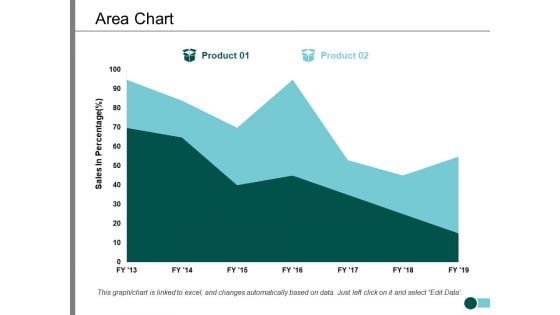
Area Chart Percentage Product Ppt PowerPoint Presentation Infographic Template Slide
This is a area chart percentage product ppt powerpoint presentation infographic template slide. This is a two stage process. The stages in this process are area chart, finance, marketing, management, investment.
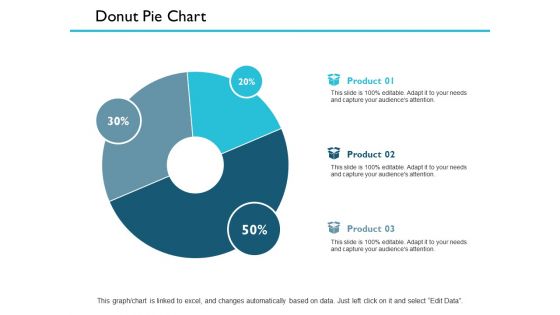
Donut Pie Chart Finance Ppt PowerPoint Presentation Outline Smartart
This is a donut pie chart finance ppt powerpoint presentation outline smartart. This is a three stage process. The stages in this process are management, marketing, business, strategy, finance.
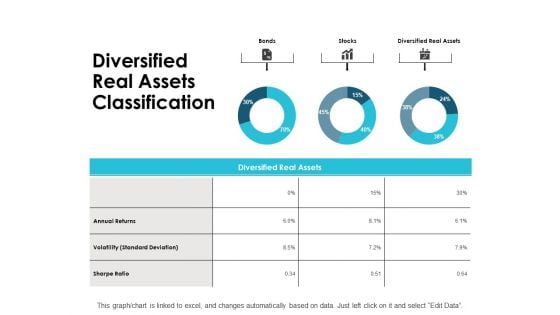
Diversified Real Assets Classification Ppt PowerPoint Presentation Ideas Graphics
This is a diversified real assets classification ppt powerpoint presentation ideas graphics. This is a three stage process. The stages in this process are management, marketing, business, strategy, finance.
Stacked Area Clustered Column Ppt PowerPoint Presentation Icon Microsoft
This is a stacked area clustered column ppt powerpoint presentation icon microsoft. This is a three stage process. The stages in this process are management, marketing, business, strategy, finance.
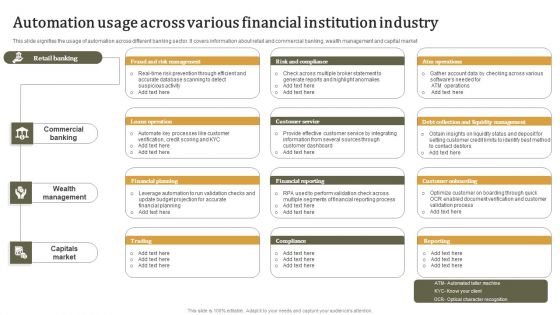
Automation Usage Across Various Financial Institution Industry Summary PDF
This slide signifies the usage of automation across different banking sector. It covers information about retail and commercial banking, wealth management and capital market. Persuade your audience using this Automation Usage Across Various Financial Institution Industry Summary PDF. This PPT design covers Three stages, thus making it a great tool to use. It also caters to a variety of topics including Commercial Banking, Wealth Management, Capitals Market. Download this PPT design now to present a convincing pitch that not only emphasizes the topic but also showcases your presentation skills.
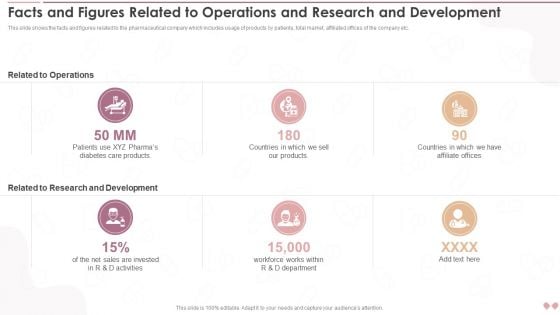
Facts And Figures Related To Operations And Research Innovative Business Model Introduction PDF
This slide shows the facts and figures related to the pharmaceutical company which includes usage of products by patients, total market, affiliated offices of the company etc.This is a Facts And Figures Related To Operations And Research Innovative Business Model Introduction PDF template with various stages. Focus and dispense information on six stages using this creative set, that comes with editable features. It contains large content boxes to add your information on topics like Related Operations, Research Development, Sales Invested. You can also showcase facts, figures, and other relevant content using this PPT layout. Grab it now.
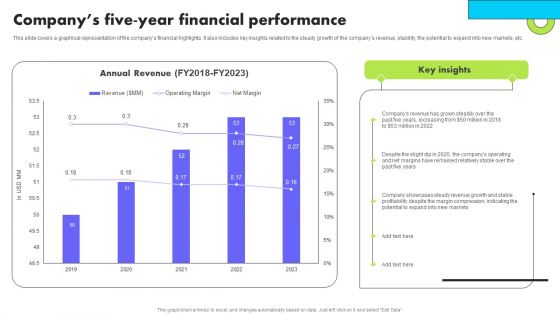
Planning Transnational Technique To Improve International Scope Companys Five Year Financial Performance Clipart PDF
This slide covers a graphical representation of the companys financial highlights. It also includes key insights related to the steady growth of the companys revenue, stability, the potential to expand into new markets, etc. Do you have to make sure that everyone on your team knows about any specific topic I yes, then you should give Planning Transnational Technique To Improve International Scope Companys Five Year Financial Performance Clipart PDF a try. Our experts have put a lot of knowledge and effort into creating this impeccable Planning Transnational Technique To Improve International Scope Companys Five Year Financial Performance Clipart PDF. You can use this template for your upcoming presentations, as the slides are perfect to represent even the tiniest detail. You can download these templates from the Slidegeeks website and these are easy to edit. So grab these today.
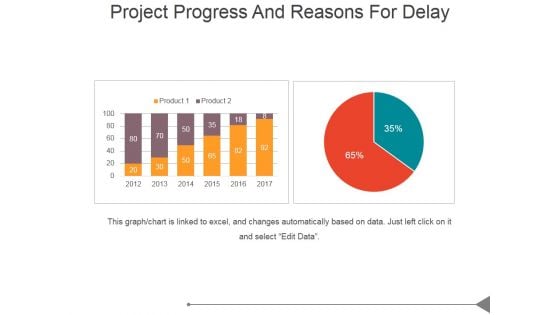
Project Progress And Reasons For Delay Ppt PowerPoint Presentation Designs Download
This is a project progress and reasons for delay ppt powerpoint presentation designs download. This is a two stage process. The stages in this process are business, marketing, success, bar graph, management.
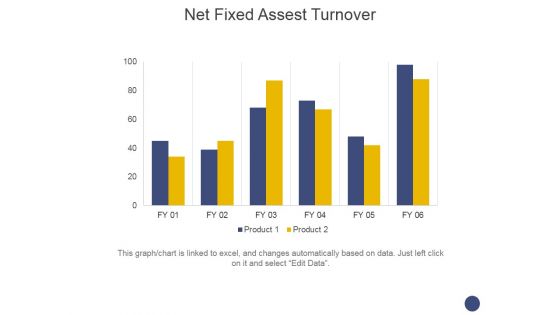
Net Fixed Assest Turnover Ppt PowerPoint Presentation Infographics Themes
This is a net fixed assest turnover ppt powerpoint presentation infographics themes. This is a two stage process. The stages in this process are turnover, business, marketing, management, finance.
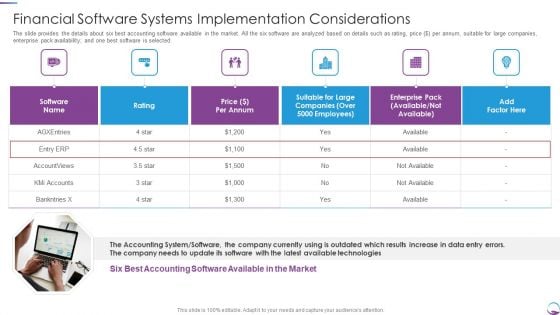
Financial Software Systems Implementation Considerations Formats PDF
The slide provides the details about six best accounting software available in the market. All the six software are analyzed based on details such as rating, price dollar per annum, suitable for large companies, enterprise pack availability and one best software is selected. Presenting Financial Software Systems Implementation Considerations Formats PDF to provide visual cues and insights. Share and navigate important information on one stages that need your due attention. This template can be used to pitch topics like Accounting System, Technologies, Price, Enterprise. In addtion, this PPT design contains high resolution images, graphics, etc, that are easily editable and available for immediate download.
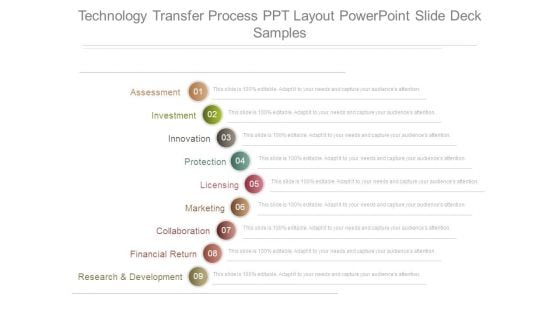
Technology Transfer Process Ppt Layout Powerpoint Slide Deck Samples
This is a technology transfer process ppt layout powerpoint slide deck samples. This is a nine stage process. The stages in this process are assessment, investment, innovation, protection, licensing, marketing, collaboration, financial return, research and development.
Financial Report Vector Icon Ppt PowerPoint Presentation Professional Mockup
Presenting this set of slides with name Financial Report Vector Icon Ppt PowerPoint Presentation Professional Mockup. This is a one process. The stages in this process are marketing, management, measuring results. This is a completely editable PowerPoint presentation and is available for immediate download. Download now and impress your audience.
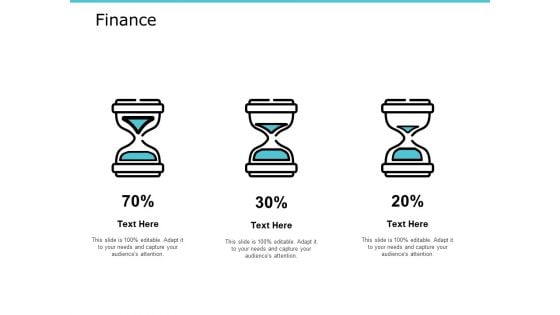
Finance Audiences Attention Ppt PowerPoint Presentation Portfolio Display
Presenting this set of slides with name finance audiences attention ppt powerpoint presentation portfolio display. This is a three stage process. The stages in this process are financial, minimum, maximum, marketing, strategy. This is a completely editable PowerPoint presentation and is available for immediate download. Download now and impress your audience.
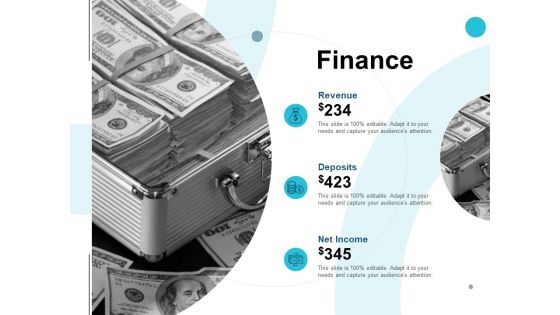
Finance Pound Ppt PowerPoint Presentation Ideas Outline
Presenting this set of slides with name finance pound ppt powerpoint presentation ideas outline. This is a three stage process. The stages in this process are financial, minimum, maximum, marketing, strategy. This is a completely editable PowerPoint presentation and is available for immediate download. Download now and impress your audience.


 Continue with Email

 Home
Home


