Stock Market Analysis
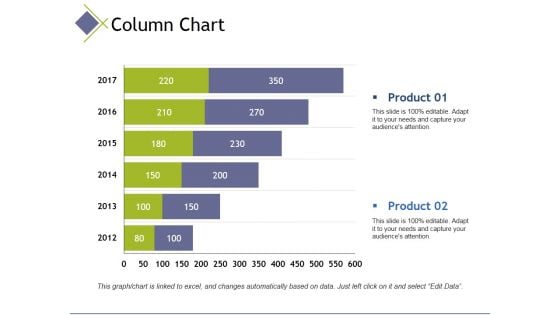
column chart ppt powerpoint presentation portfolio master slide
This is a column chart ppt powerpoint presentation portfolio master slide. This is a two stage process. The stages in this process are column chart, finance, analysis, marketing, business.
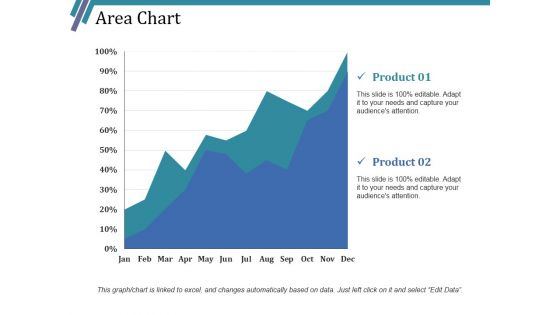
Area Chart Ppt PowerPoint Presentation Styles Templates
This is a area chart ppt powerpoint presentation styles templates. This is a two stage process. The stages in this process are area chart, growth, finance, marketing, strategy, analysis.
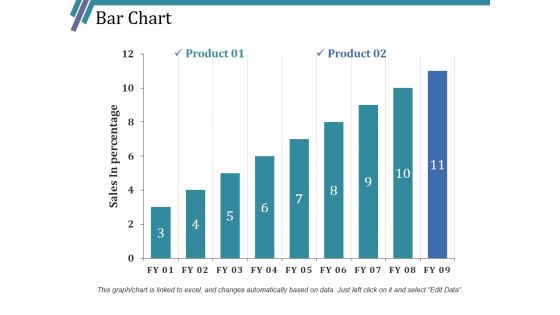
Bar Chart Ppt PowerPoint Presentation Styles Smartart
This is a bar chart ppt powerpoint presentation styles smartart. This is a two stage process. The stages in this process are bar chart, growth, finance, marketing, strategy, analysis.
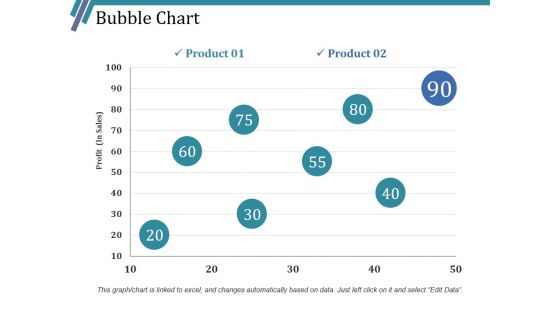
Bubble Chart Ppt PowerPoint Presentation Inspiration Picture
This is a bubble chart ppt powerpoint presentation inspiration picture. This is a two stage process. The stages in this process are bubble chart, growth, finance, marketing, strategy, analysis.
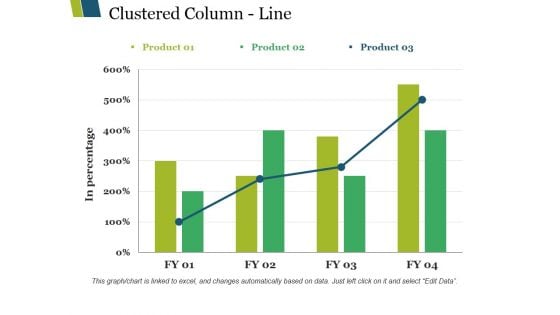
Clustered Column Line Ppt PowerPoint Presentation Infographics Background Images
This is a clustered column line ppt powerpoint presentation infographics background images. This is a three stage process. The stages in this process are clustered column line, finance, analysis, marketing, business.
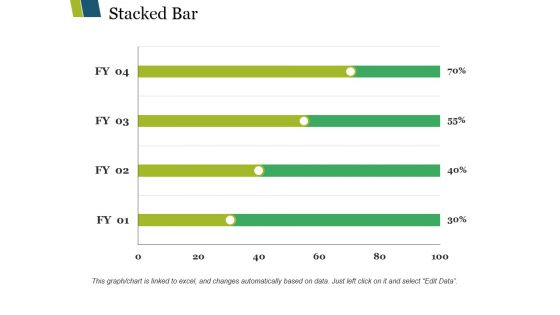
Stacked Bar Ppt PowerPoint Presentation Layouts Show
This is a stacked bar ppt powerpoint presentation layouts show. This is a four stage process. The stages in this process are stacked bar, finance, analysis, marketing, strategy, business.
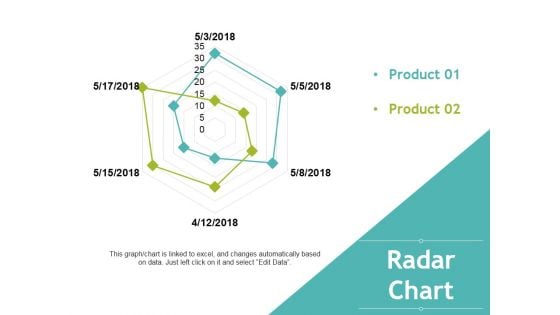
Radar Chart Ppt PowerPoint Presentation Professional Brochure
This is a radar chart ppt powerpoint presentation professional brochure. This is a two stage process. The stages in this process are radar chart, finance, marketing, strategy, analysis, business.
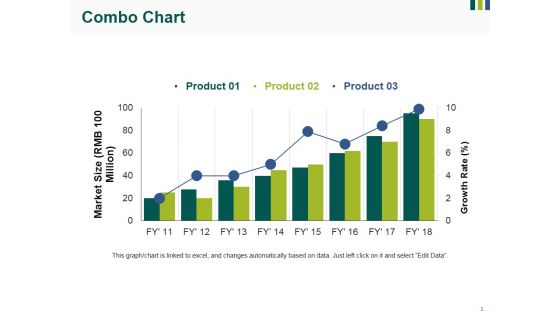
Combo Chart Ppt PowerPoint Presentation Inspiration Vector
This is a combo chart ppt powerpoint presentation inspiration vector. This is a three stage process. The stages in this process are combo chart, finance, marketing, strategy, analysis, business.
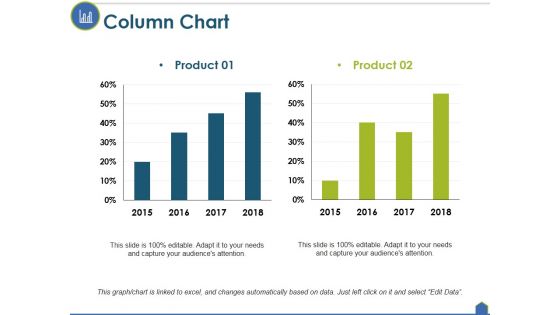
Column Chart Ppt PowerPoint Presentation Inspiration Good
This is a column chart ppt powerpoint presentation inspiration good. This is a two stage process. The stages in this process are column chart, finance, marketing, strategy, analysis, business.
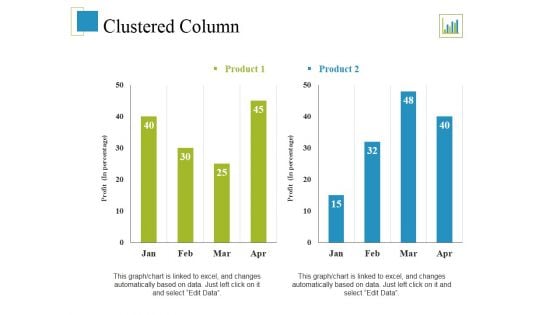
Clustered Column Ppt PowerPoint Presentation Summary Template
This is a clustered column ppt powerpoint presentation summary template. This is a two stage process. The stages in this process are clustered column, finance, marketing, analysis, strategy, business.
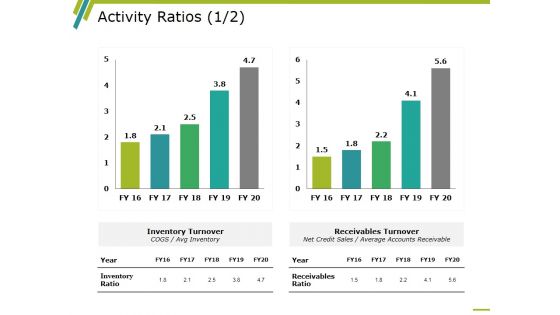
Activity Ratios Template 1 Ppt PowerPoint Presentation Slides Example Topics
This is a activity ratios template 1 ppt powerpoint presentation slides example topics. This is a two stage process. The stages in this process are business, finance, strategy, marketing, analysis.
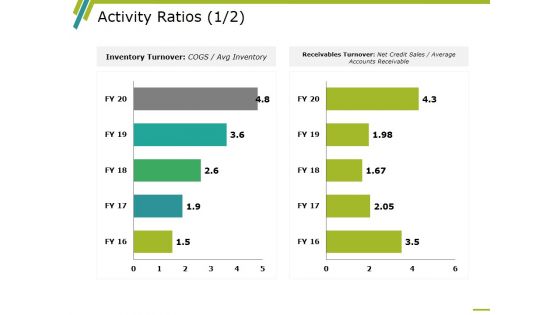
Activity Ratios Template 2 Ppt PowerPoint Presentation Summary Background Images
This is a activity ratios template 2 ppt powerpoint presentation summary background images. This is a two stage process. The stages in this process are business, finance, strategy, marketing, analysis.
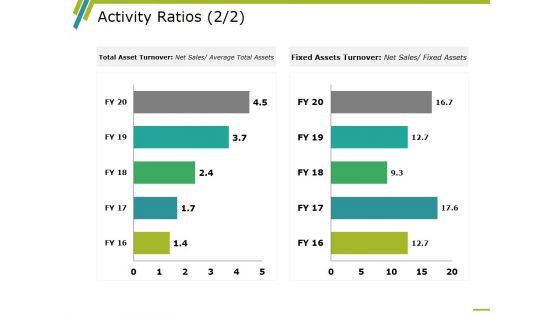
Activity Ratios Template 3 Ppt PowerPoint Presentation Professional Graphic Tips
This is a activity ratios template 3 ppt powerpoint presentation professional graphic tips. This is a two stage process. The stages in this process are business, finance, marketing, strategy, analysis.
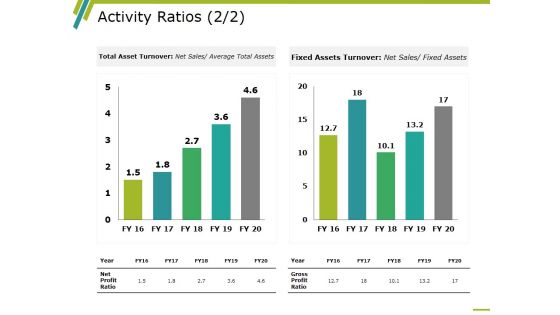
Activity Ratios Template 4 Ppt PowerPoint Presentation Gallery Slides
This is a activity ratios template 4 ppt powerpoint presentation gallery slides. This is a two stage process. The stages in this process are business, finance, marketing, strategy, analysis.
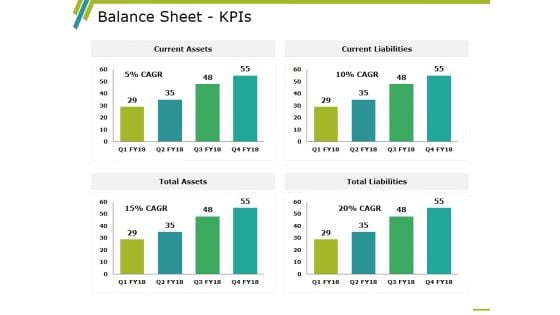
Balance Sheet Kpis Template 3 Ppt PowerPoint Presentation Infographic Template Demonstration
This is a balance sheet kpis template 3 ppt powerpoint presentation infographic template demonstration. This is a four stage process. The stages in this process are balance sheet, finance, marketing, strategy, analysis.
Bar Chart Ppt PowerPoint Presentation Icon Diagrams
This is a bar chart ppt powerpoint presentation icon diagrams. This is a two stage process. The stages in this process are bar chart, finance, analysis, business, marketing, strategy.
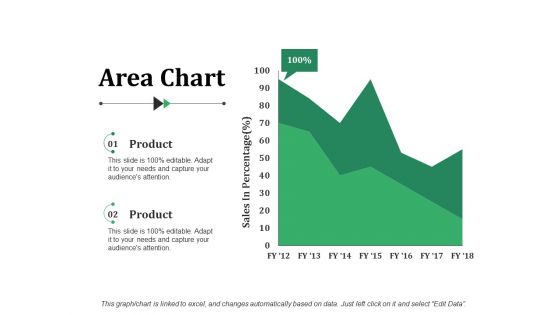
Area Chart Ppt PowerPoint Presentation Visual Aids Gallery
This is a area chart ppt powerpoint presentation visual aids gallery. This is a two stage process. The stages in this process are area chart, finance, marketing, analysis, business.
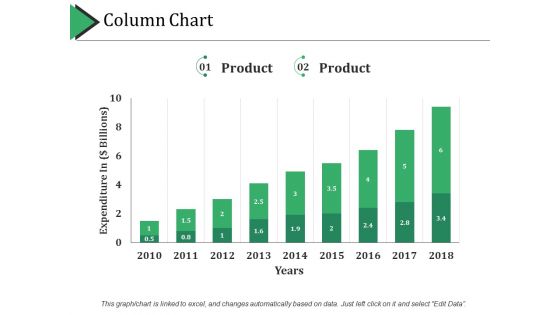
Column Chart Ppt PowerPoint Presentation Professional Example Topics
This is a column chart ppt powerpoint presentation professional example topics. This is a two stage process. The stages in this process are column chart, finance, marketing, strategy, analysis, business.
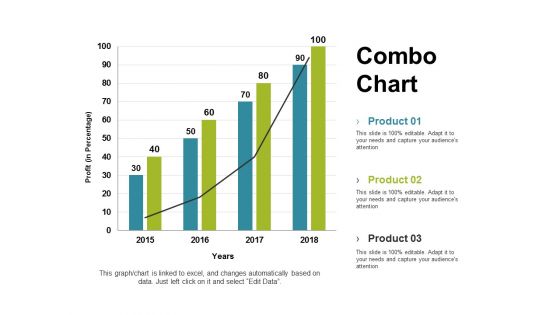
Combo Chart Ppt PowerPoint Presentation Gallery Graphics Tutorials
This is a Combo Chart Ppt PowerPoint Presentation Gallery Graphics Tutorials. This is a three stage process. The stages in this process are combo chart, finance, marketing, strategy, analysis.
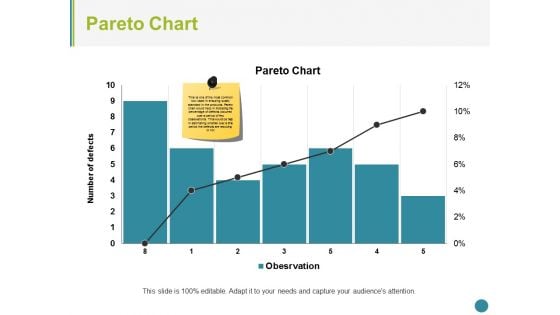
Pareto Chart Ppt PowerPoint Presentation Summary Structure
This is a pareto chart ppt powerpoint presentation summary structure. This is a seven stage process. The stages in this process are pareto chart, finance, marketing, strategy, analysis, business.
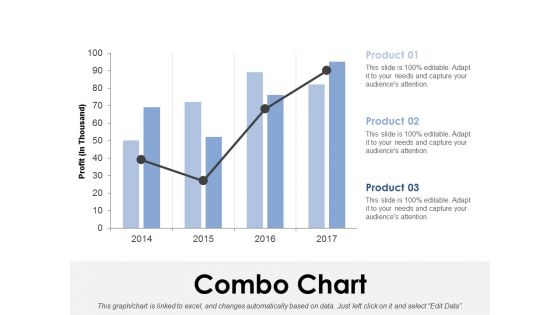
Combo Chart Ppt PowerPoint Presentation Infographics Sample
This is a combo chart ppt powerpoint presentation infographics sample. This is a three stage process. The stages in this process are combo chart, finance, analysis, marketing, strategy, business.
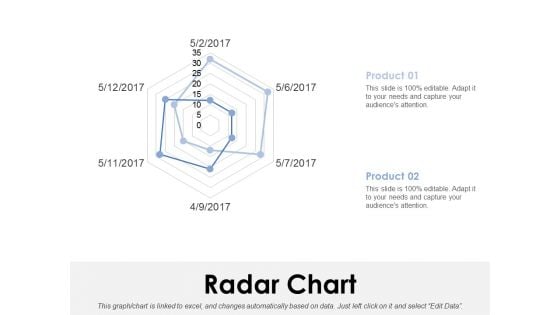
Radar Chart Ppt PowerPoint Presentation Model Clipart Images
This is a radar chart ppt powerpoint presentation model clipart images. This is a two stage process. The stages in this process are radar chart, finance, analysis, marketing, strategy, business.
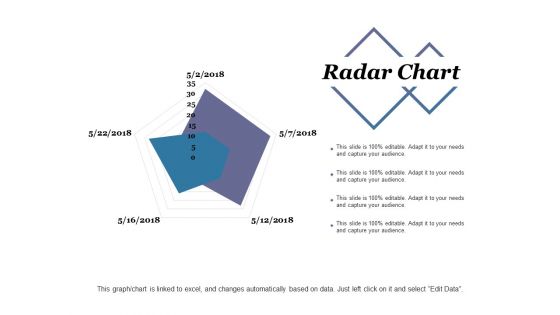
Radar Chart Ppt PowerPoint Presentation Infographic Template Sample
This is a radar chart ppt powerpoint presentation infographic template sample. This is a two stage process. The stages in this process are radar chart, finance, marketing, strategy, analysis.
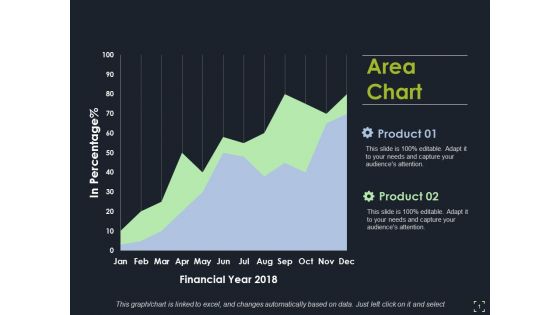
Area Chart Ppt PowerPoint Presentation Infographics Images
This is a area chart ppt powerpoint presentation infographics images. This is a two stage process. The stages in this process are area chart, finance, marketing, analysis, strategy, business.
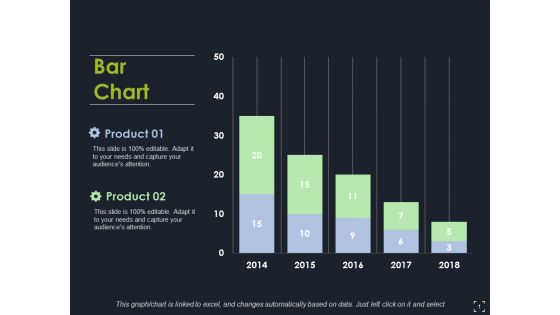
Bar Chart Ppt PowerPoint Presentation Model Clipart Images
This is a bar chart ppt powerpoint presentation model clipart images. This is a two stage process. The stages in this process are bar chart, finance, marketing, strategy, analysis.
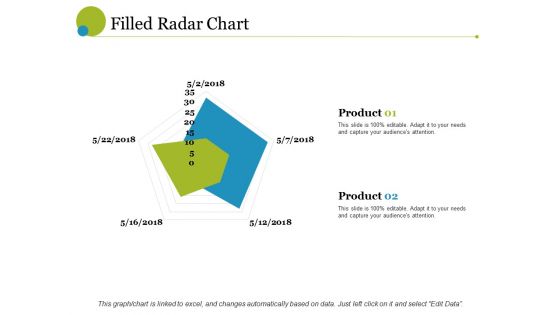
filled radar chart ppt powerpoint presentation ideas brochure
This is a filled radar chart ppt powerpoint presentation ideas brochure. This is a two stage process. The stages in this process are radar chart, finance, analysis, business, marketing, strategy.
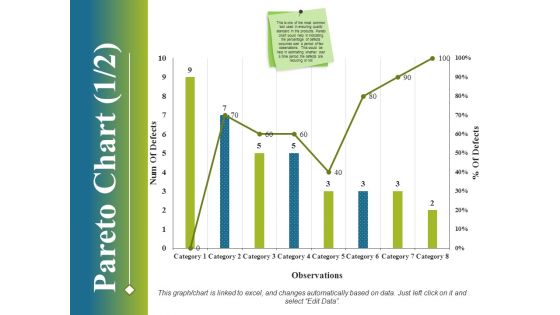
Pareto Chart Template 1 Ppt PowerPoint Presentation File Ideas
This is a pareto chart template 1 ppt powerpoint presentation file ideas. This is a eight stage process. The stages in this process are business, finance, marketing, strategy, analysis.
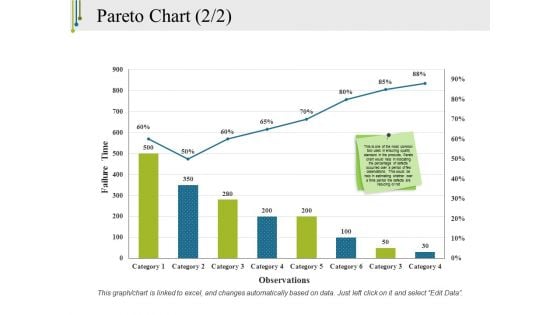
Pareto Chart Template 2 Ppt PowerPoint Presentation Outline Model
This is a pareto chart template 2 ppt powerpoint presentation outline model. This is a eight stage process. The stages in this process are pareto chart, finance, marketing, strategy, analysis.

Area Chart Ppt PowerPoint Presentation Styles Design Templates
This is a area chart ppt powerpoint presentation styles design templates. This is a two stage process. The stages in this process are area chart, analysis, business, marketing, strategy.
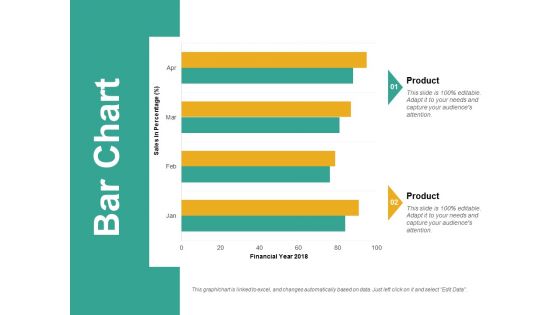
Bar Chart Ppt PowerPoint Presentation Slides Model
This is a bar chart ppt powerpoint presentation slides model. This is a two stage process. The stages in this process are bar chart, analysis, business, marketing, strategy, finance.

Combo Chart Ppt PowerPoint Presentation Inspiration Slide Download
This is a combo chart ppt powerpoint presentation inspiration slide download. This is a two stage process. The stages in this process are Combo chart, finance, marketing, strategy, analysis.
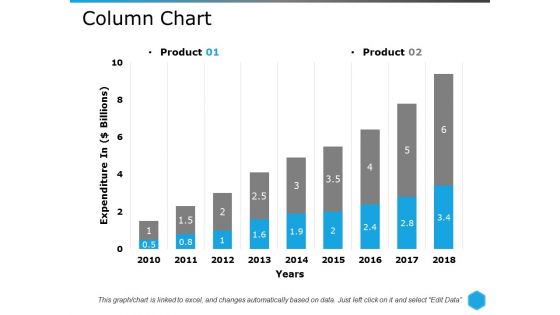
Column Chart Template 2 Ppt PowerPoint Presentation Infographic Template Example Introduction
This is a column chart template 2 ppt powerpoint presentation infographic template example introduction. This is a two stage process. The stages in this process are column chart, finance, analysis, marketing, strategy.
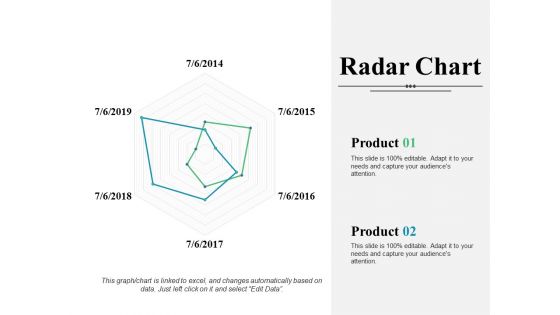
Radar Chart Ppt PowerPoint Presentation Infographic Template Introduction
This is a radar chart ppt powerpoint presentation infographic template introduction. This is a two stage process. The stages in this process are radar chart, finance, marketing, strategy, analysis, business.
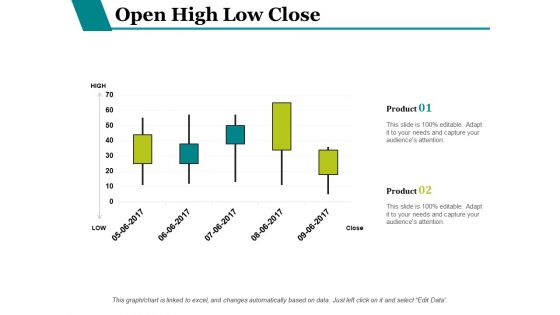
Open High Low Close Ppt PowerPoint Presentation Infographics Inspiration
This is a open high low close ppt powerpoint presentation infographics inspiration. This is a two stage process. The stages in this process are finance, analysis, investment, business, marketing.
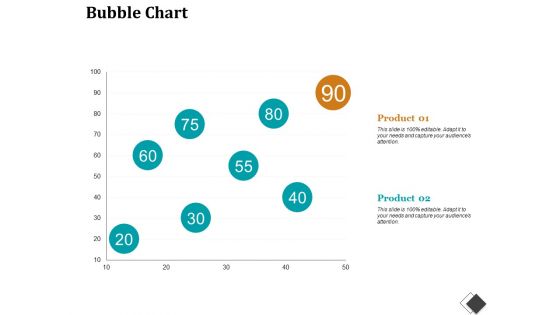
Bubble Chart Enterprise Model Canvas Ppt PowerPoint Presentation File Structure
This is a bubble chart enterprise model canvas ppt powerpoint presentation file structure. This is a two stage process. The stages in this process are bubble chart, finance, marketing, strategy, analysis, investment.
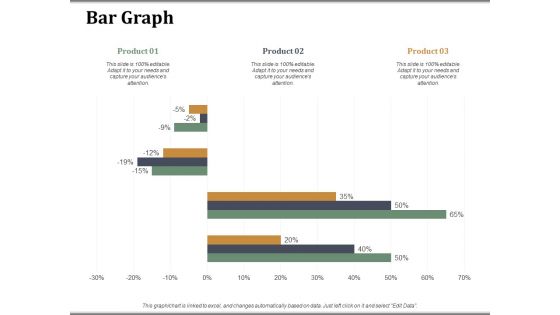
Bar Graph Companys Business Model Canvas Ppt PowerPoint Presentation Visual Aids Model
This is a bar graph companys business model canvas ppt powerpoint presentation visual aids model. This is a three stage process. The stages in this process are bar graph, finance, marketing, strategy, analysis, business.
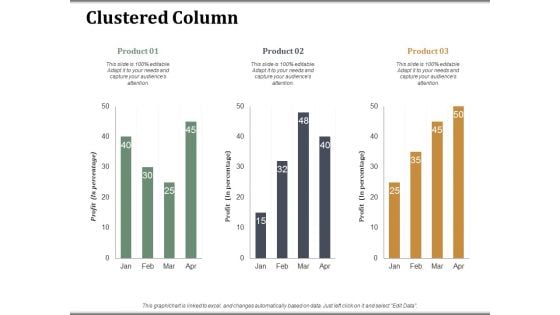
Clustered Column Companys Business Model Canvas Ppt PowerPoint Presentation Slides Topics
This is a clustered column companys business model canvas ppt powerpoint presentation slides topics. This is a three stage process. The stages in this process are clustered column, finance, marketing, strategy, analysis, investment.
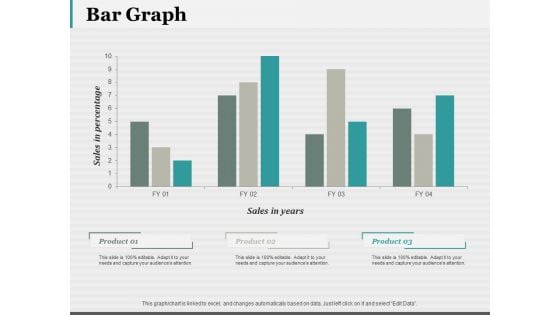
Bar Graph 7 QC Tools Ppt PowerPoint Presentation Styles Structure
This is a bar graph 7 qc tools ppt powerpoint presentation styles structure. This is a three stage process. The stages in this process are bar graph, finance, marketing, analysis, investment.
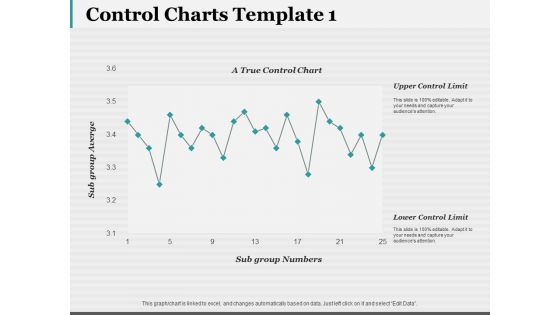
Control Charts Template 1 Ppt PowerPoint Presentation Show Graphics Design
This is a control charts template 1 ppt powerpoint presentation show graphics design. This is a one stage process. The stages in this process are business, finance, marketing, strategy, analysis.
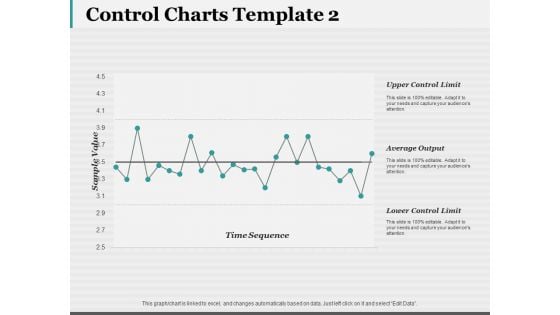
Control Charts Template 2 Ppt PowerPoint Presentation Slides Designs
This is a control charts template 2 ppt powerpoint presentation slides designs. This is a one stage process. The stages in this process are business, finance, marketing, strategy, analysis.
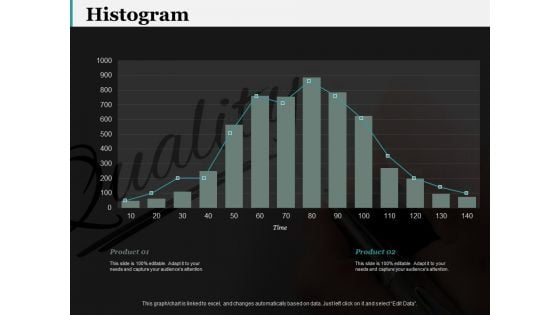
Histogram 7 QC Tools Ppt PowerPoint Presentation Gallery Layout
This is a histogram 7 qc tools ppt powerpoint presentation gallery layout. This is a two stage process. The stages in this process are business, finance, marketing, strategy, analysis.
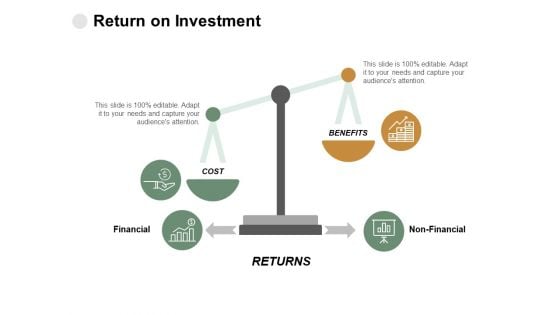
Return On Investment Ppt PowerPoint Presentation Visual Aids Infographics
This is a return on investment ppt powerpoint presentation visual aids infographics. This is a three stage process. The stages in this process are finance, analysis, business, investment, marketing.
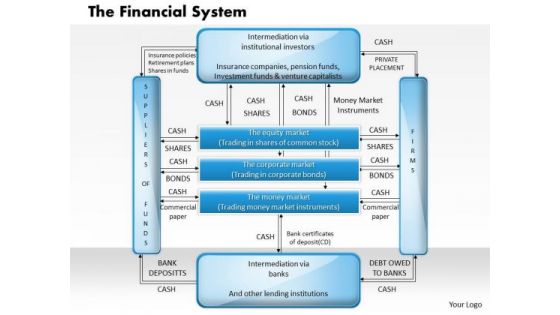
Business Framework The Financial System PowerPoint Presentation
This business slide depicts framework of financial system. It contains diagram of cash flow depicting suppliers of funds, intermediation via institutional investors, firms and intermediation via banks. Download this diagram as a tool for business presentations.
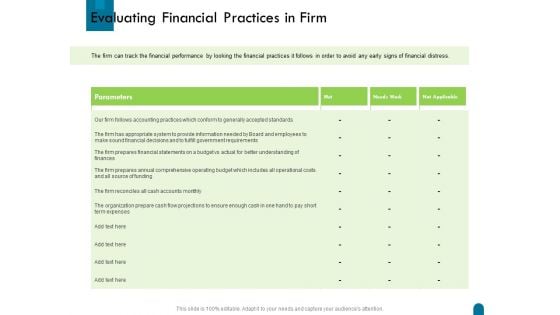
Crisis Management Evaluating Financial Practices In Firm Ppt Professional Demonstration PDF
Deliver and pitch your topic in the best possible manner with this crisis management evaluating financial practices in firm ppt professional demonstration pdf. Use them to share invaluable insights on parameters, met, needs work, not applicable and impress your audience. This template can be altered and modified as per your expectations. So, grab it now.
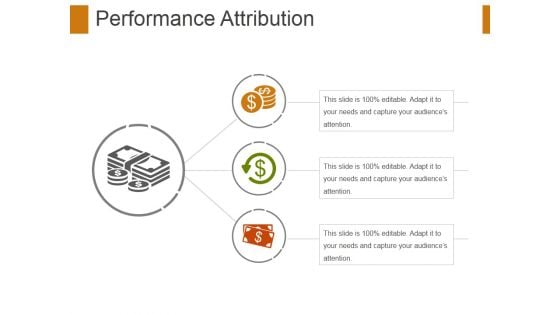
Performance Attribution Ppt PowerPoint Presentation Professional Sample
This is a performance attribution ppt powerpoint presentation professional sample. This is a three stage process. The stages in this process are business, finance, marketing, strategy, analysis, investment.
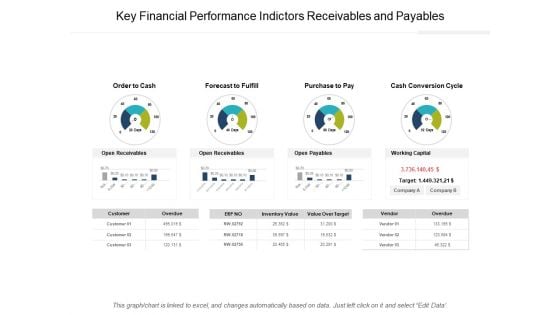
Key Financial Performance Indictors Receivables And Payables Ppt PowerPoint Presentation Layouts Graphics Example
Presenting this set of slides with name key financial performance indictors receivables and payables ppt powerpoint presentation layouts graphics example. The topics discussed in these slides are cash flow, fund flow, trading cycle. This is a completely editable PowerPoint presentation and is available for immediate download. Download now and impress your audience.
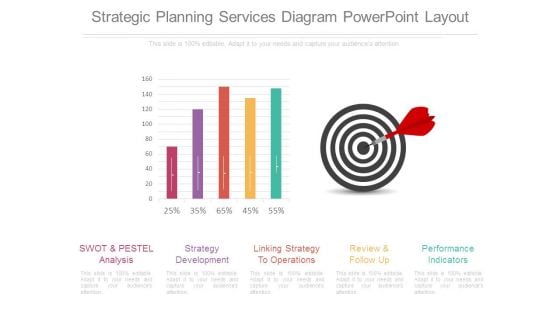
Strategic Planning Services Diagram Powerpoint Layout
This is a strategic planning services diagram powerpoint layout. This is a five stage process. The stages in this process are swot and pestel analysis, strategy development, linking strategy to operations, review and follow up, performance indicators.

Three Square Tags With Dollars Value Powerpoint Slides
This PowerPoint template contains three square tags with dollar value. You may download this PPT slide design to display financial analysis. You can easily customize this template to make it more unique as per your need.
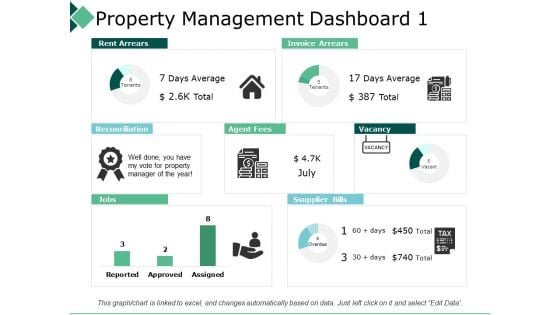
Property Management Dashboard 1 Reconciliation Ppt PowerPoint Presentation Professional Visuals
This is a property management dashboard 1 reconciliation ppt powerpoint presentation professional visuals. This is a three stage process. The stages in this process are business, management, strategy, analysis, icon.
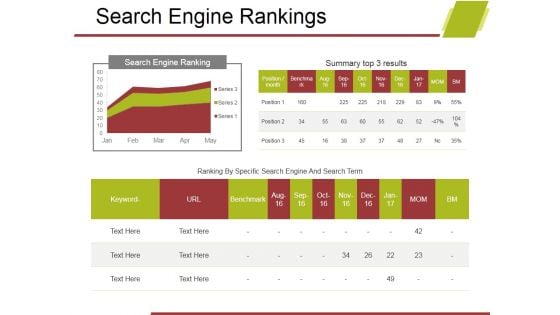
Search Engine Rankings Ppt PowerPoint Presentation Infographics Samples
This is a search engine rankings ppt powerpoint presentation infographics samples. This is a two stage process. The stages in this process are business, management, analysis, strategy, search engine rankings.
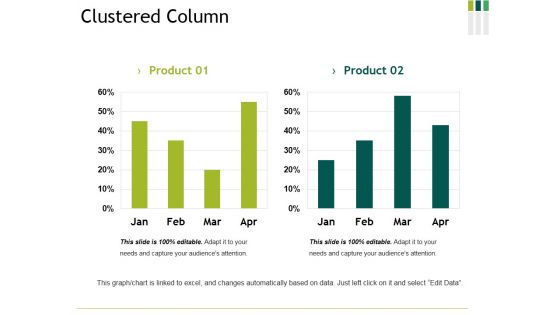
Clustered Column Ppt PowerPoint Presentation Show Clipart Images
This is a clustered column ppt powerpoint presentation show clipart images. This is a two stage process. The stages in this process are clustered column, finance, analysis, management, planning.
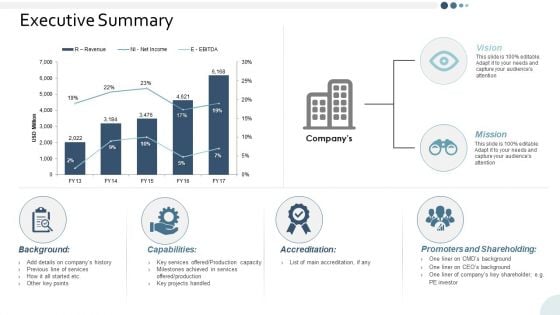
Executive Summary Yearly Operating Plan Ppt PowerPoint Presentation Slides Layouts
This is a executive summary yearly operating plan ppt powerpoint presentation slides layouts. This is a four stage process. The stages in this process are business, management, strategy, analysis, icons.
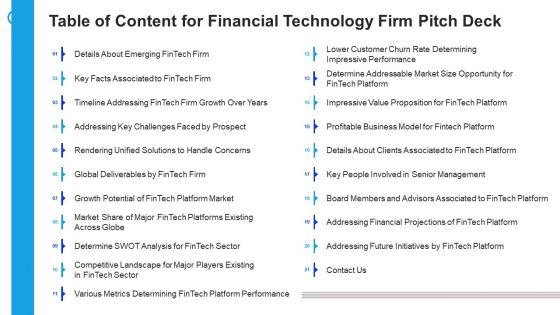
Financial Technology Firm Table Of Content For Financial Technology Firm Pitch Deck Demonstration PDF
Deliver an awe inspiring pitch with this creative financial technology firm table of content for financial technology firm pitch deck demonstration pdf bundle. Topics like business model, value proposition, financial projections can be discussed with this completely editable template. It is available for immediate download depending on the needs and requirements of the user.
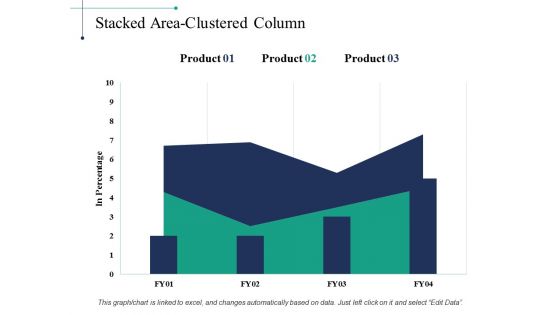
Stacked Area Clustered Column Ppt PowerPoint Presentation Visual Aids Background Images
This is a stacked area clustered column ppt powerpoint presentation visual aids background images. This is a three stage process. The stages in this process are finance, investment, business, analysis, management.
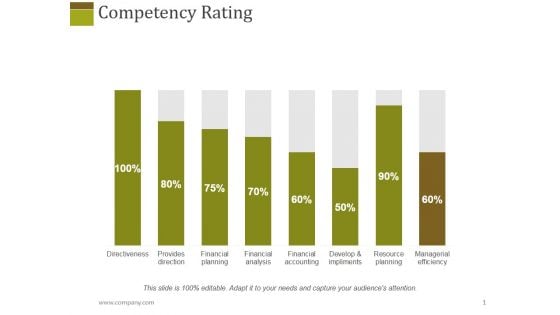
Competency Rating Template 1 Ppt PowerPoint Presentation Layouts Design Templates
This is a competency rating template 1 ppt powerpoint presentation layouts design templates. This is a eight stage process. The stages in this process are defectiveness, provides direction, financial planning, financial analysis.
Company Financials Report Icon Illustrating Product Financial Performance Infographics PDF
Persuade your audience using this Company Financials Report Icon Illustrating Product Financial Performance Infographics PDF. This PPT design covers one stage, thus making it a great tool to use. It also caters to a variety of topics including Company Financials, Report Icon, Illustrating Product. Download this PPT design now to present a convincing pitch that not only emphasizes the topic but also showcases your presentation skills.
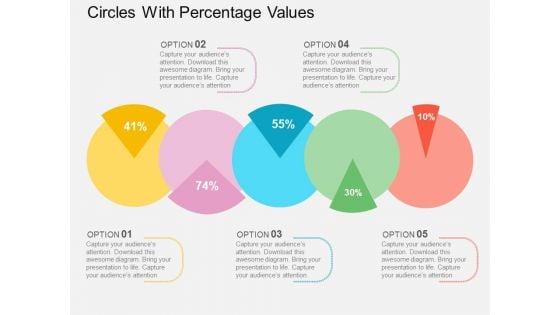
Circles With Percentage Values Powerpoint Templates
This PowerPoint template displays circles with percentage values. This business diagram is suitable for financial data analysis. Use this business diagram slide to highlight the key issues of your presentation.
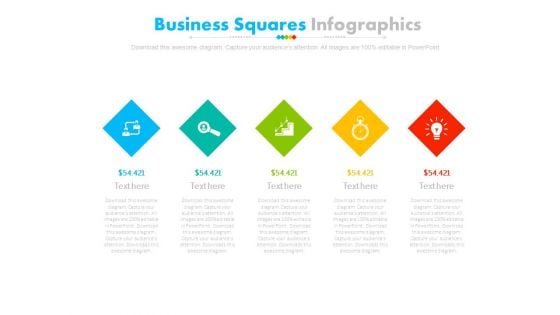
Five Steps Diamond Infographic Diagram Powerpoint Slides
This PowerPoint template has been designed with alphabet steps with icons. This PPT slide may be used to display financial strategy analysis. Make outstanding business presentation with this template.
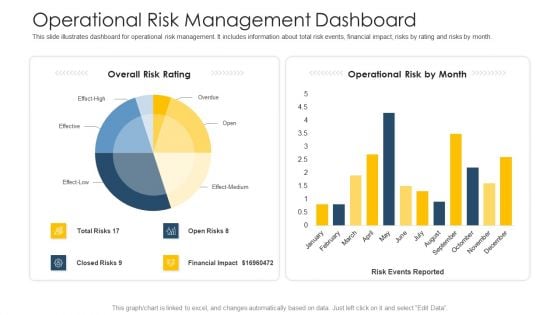
Establishing Operational Risk Framework Banking Operational Risk Management Dashboard Slides PDF
This slide illustrates dashboard for operational risk management. It includes information about total risk events, financial impact, risks by rating and risks by month. Deliver and pitch your topic in the best possible manner with this establishing operational risk framework banking operational risk management dashboard slides pdf. Use them to share invaluable insights on financial impact, operational risk, overall risk rating and impress your audience. This template can be altered and modified as per your expectations. So, grab it now.
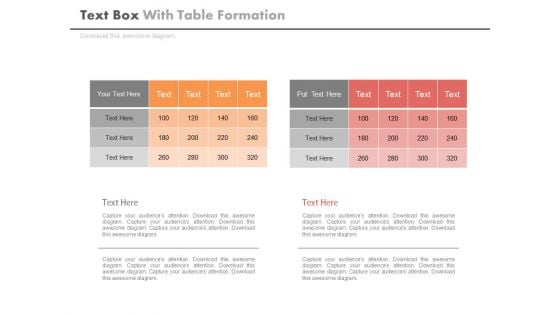
Two Table Charts For Business Data Powerpoint Slides
This PowerPoint template contains two tables chart. You may download this PPT slide to display statistical analysis. You can easily customize this template to make it more unique as per your need.


 Continue with Email

 Home
Home


