Stock Market Prediction
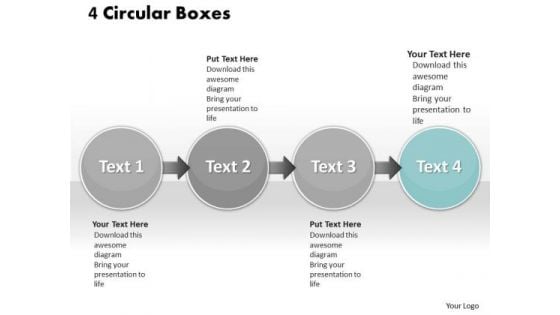
Ppt Four Interconnected Stock Exchange Text Circles PowerPoint Templates
PPT four interconnected stock exchange text circles PowerPoint Templates-Use this graphical approach to represent global business issues such as financial data, stock market Exchange, increase in sales, corporate presentations and more. It Signifies common, comprehensive, extensive, global, international, multinational, omnipresent, planetary, ubiquitous, universal etc.-PPT four interconnected stock exchange text circles PowerPoint Templates-Analysis, Arrow, Background, Backlink, Circle, Code, Content, Diagram, Engine, Illustration, Keyword, Optimization, Offpage, Process, Search, Template, Tracking, Unpage, Violet, Visitor, Become the crowd favourite with our Ppt Four Interconnected Stock Exchange Text Circles PowerPoint Templates. Get them all clamouring for you.
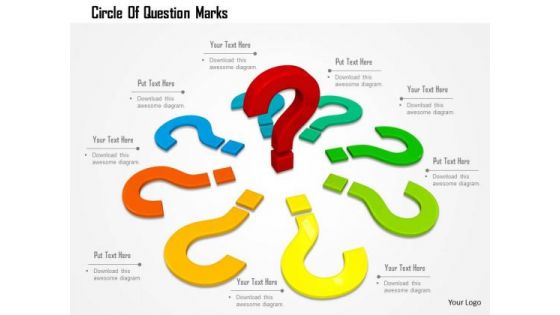
Stock Photo Circle Of Question Marks PowerPoint Slide
Our above image slide contains graphics of multiple question marks. You may use this image for topics related to queries, problems and finding solutions. Orientate yourself with this design. It will define the right path in the maze of options.
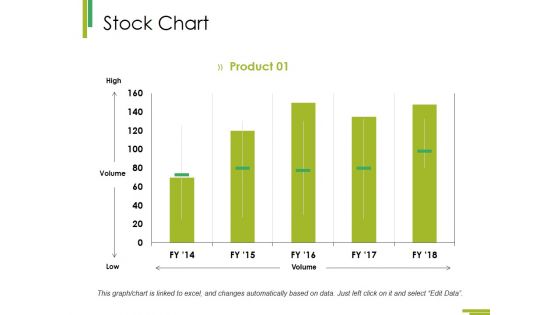
Stock Chart Ppt PowerPoint Presentation Summary Format Ideas
This is a stock chart ppt powerpoint presentation summary format ideas. This is a one stage process. The stages in this process are stock chart, finance, business, analysis, marketing.

Stock Photo Calculator On Dollars Background PowerPoint Slide
This image slide displays calculator on dollar notes. This PowerPoint template contains the concept of monetary calculation. Use this slide for displaying financial calculation in any presentation and get noticed by your viewers.
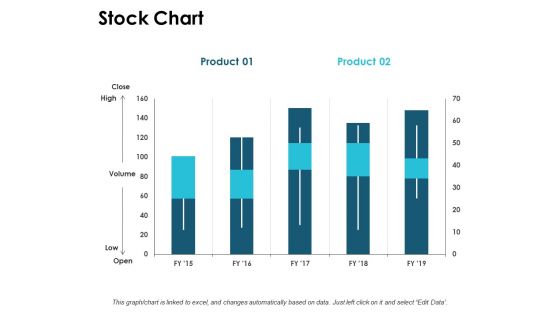
Stock Chart Graph Ppt PowerPoint Presentation Ideas Demonstration
This is a stock chart graph ppt powerpoint presentation ideas demonstration. This is a three stage process. The stages in this process are finance, marketing, management, investment, analysis.
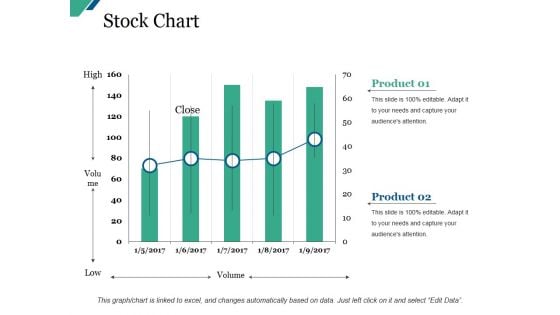
Stock Chart Ppt PowerPoint Presentation Inspiration Background Image
This is a stock chart ppt powerpoint presentation inspiration background image. This is a five stage process. The stages in this process are business, marketing, graph, finance, analysis.
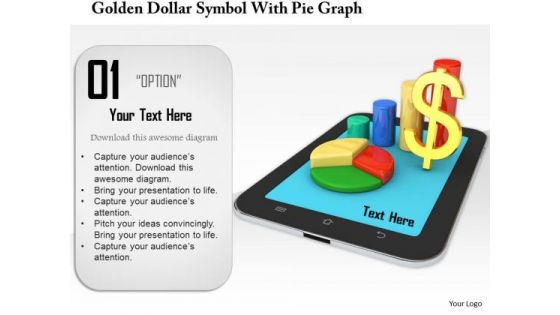
Stock Photo Golden Dollar Symbol With Pie Graph PowerPoint Slide
This Power Point template has been crafted with graphic of golden dollar symbol and pie chart on a tablet. Display the concept of financial data analysis with this image. Use this image to present financial reports in business presentations.
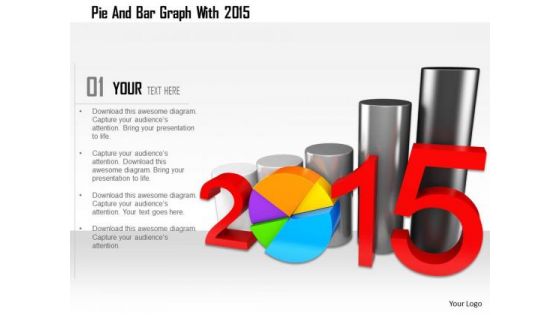
Stock Photo Pie And Bar Graph With 2015 PowerPoint Slide
This Power Point image template slide has been crafted with graphic of pie and bar graph and 2015 year text. This PPT slide contains the concept of business and financial analysis. Use this image slide and build quality presentation for your viewers.
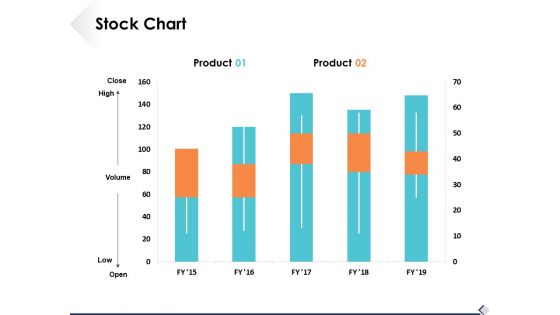
Stock Chart Finance Ppt PowerPoint Presentation Styles Background Image
This is a stock chart finance ppt powerpoint presentation styles background image. This is a two stage process. The stages in this process are analysis, marketing, icons, finance, strategy.
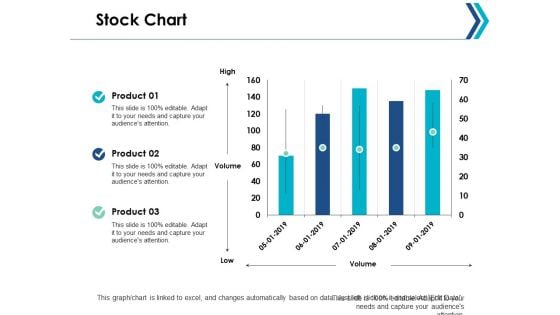
Stock Chart Finance Analysis Ppt Powerpoint Presentation Ideas Portrait
This is a stock chart finance analysis ppt powerpoint presentation ideas portrait. This is a three stage process. The stages in this process are finance, marketing, management, investment, strategy.
Stock Photo Business Strategy Concepts Diagrams And Charts Icons Images
Acquire A Fine Balance With Our stock photo business strategy concepts diagrams and charts icons images. Your Audience Will Find You Sure Footed. Your Thoughts Will Acquire A Fine Balance. Our Holidays Will Put Them On A Good Footing.
Stock Chart Analysis Ppt PowerPoint Presentation Icon Layout
Presenting this set of slides with name stock chart analysis ppt powerpoint presentation icon layout. The topics discussed in these slides are finance, marketing, management, investment, analysis. This is a completely editable PowerPoint presentation and is available for immediate download. Download now and impress your audience.
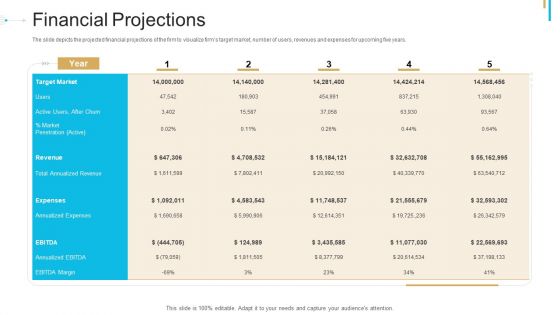
Stock Offering As An Exit Alternative Financial Projections Microsoft PDF
The slide depicts the projected financial projections of the firm to visualize firms target market, number of users, revenues and expenses for upcoming five years. Deliver and pitch your topic in the best possible manner with this stock offering as an exit alternative financial projections microsoft pdf. Use them to share invaluable insights on revenue, expenses, market, penetration, target and impress your audience. This template can be altered and modified as per your expectations. So, grab it now.
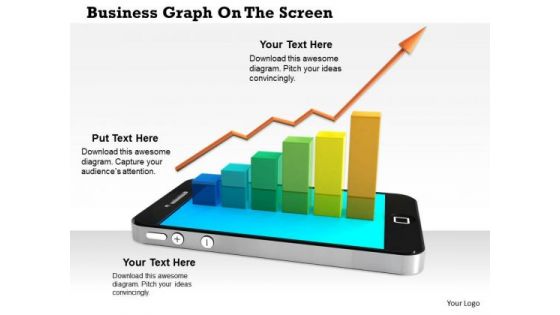
Stock Photo Arrow Growth Bar Graph On Phone Pwerpoint Slide
This graphic image has been designed with graphic of smart phone with growth bar graph. This image contains the concept of business growth analysis. Use this image for business and marketing related analysis presentations. Display finance growth analysis in an graphical way with this exclusive image.
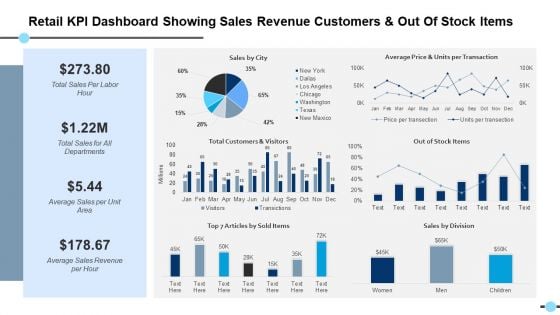
Retail Kpi Dashboard Showing Sales Revenue Customers And Out Of Stock Items Out Of Stock Items Ppt PowerPoint Presentation Files

Marketing Strategies For Effective Key Techniques Of Stock And Inventory Management
This slide covers tools and techniques for efficient stock inventory management. It involves techniques such as just in time inventory, ABC inventory analysis, batch tracking and lean manufacturing system. This modern and well-arranged Marketing Strategies For Effective Key Techniques Of Stock And Inventory Management provides lots of creative possibilities. It is very simple to customize and edit with the Powerpoint Software. Just drag and drop your pictures into the shapes. All facets of this template can be edited with Powerpoint, no extra software is necessary. Add your own material, put your images in the places assigned for them, adjust the colors, and then you can show your slides to the world, with an animated slide included. This slide covers tools and techniques for efficient stock inventory management. It involves techniques such as just in time inventory, ABC inventory analysis, batch tracking and lean manufacturing system.

Stock Photo Business Marketing Strategy Enjoy Your Hamburger Meal Images And Graphics
Our stock photo business marketing strategy enjoy your hamburger meal images and graphics Help Avoid Errors. They Wont Let You Put A Foot Wrong. Our food Help You Find Your Feet. They Acquaint You With The Best Available.

Financial Predictions Ppt PowerPoint Presentation Pictures Graphics
This is a campaign public relations ppt powerpoint presentation portfolio templates. This is a two stage process. The stages in this process are campaign public relations.
Stock Market Analysis Magnifying Glass Over Bar Graph And Dollar Sign Ppt PowerPoint Presentation Icon Visual Aids
This is a stock market analysis magnifying glass over bar graph and dollar sign ppt powerpoint presentation icon visual aids. This is a four stage process. The stages in this process are stock market, financial markets, bull market.
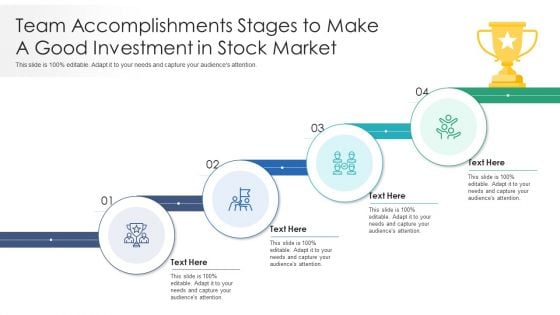
Team Accomplishments Stages To Make A Good Investment In Stock Market Ppt PowerPoint Presentation Gallery Graphics Download PDF
Presenting team accomplishments stages to make a good investment in stock market ppt powerpoint presentation gallery graphics download pdf to dispense important information. This template comprises four stages. It also presents valuable insights into the topics including team accomplishments stages to make a good investment in stock market. This is a completely customizable PowerPoint theme that can be put to use immediately. So, download it and address the topic impactfully.
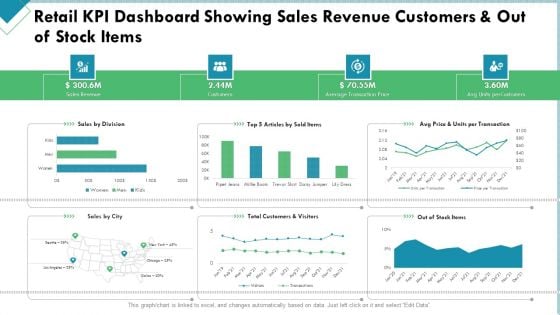
Market Analysis Of Retail Sector Retail KPI Dashboard Showing Sales Revenue Customers And Out Of Stock Items Structure PDF
Deliver and pitch your topic in the best possible manner with this market analysis of retail sector retail kpi dashboard showing sales revenue customers and out of stock items structure pdf. Use them to share invaluable insights on sales revenue, customers, average transaction price and impress your audience. This template can be altered and modified as per your expectations. So, grab it now.
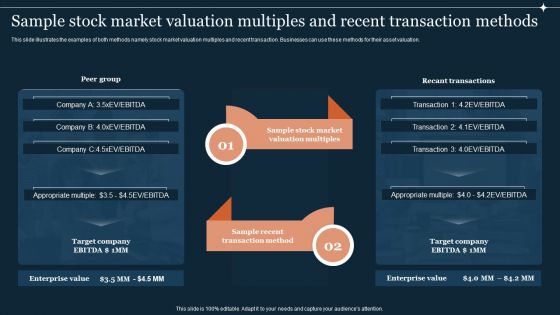
Guide To Develop And Estimate Brand Value Sample Stock Market Valuation Multiples And Recent Transaction Methods Professional PDF
This slide illustrates the examples of both methods namely stock market valuation multiples and recent transaction. Businesses can use these methods for their asset valuation.This modern and well-arranged Guide To Develop And Estimate Brand Value Sample Stock Market Valuation Multiples And Recent Transaction Methods Professional PDF provides lots of creative possibilities. It is very simple to customize and edit with the Powerpoint Software. Just drag and drop your pictures into the shapes. All facets of this template can be edited with Powerpoint no extra software is necessary. Add your own material, put your images in the places assigned for them, adjust the colors, and then you can show your slides to the world, with an animated slide included.
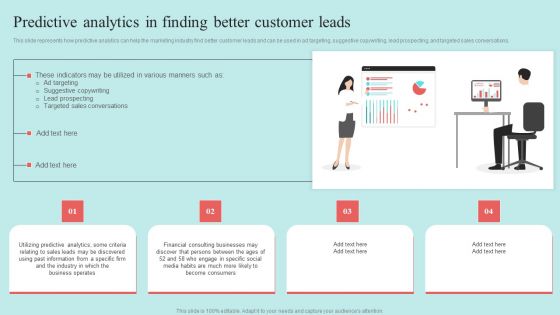
Predictive Data Model Predictive Analytics In Finding Better Customer Leads Sample PDF
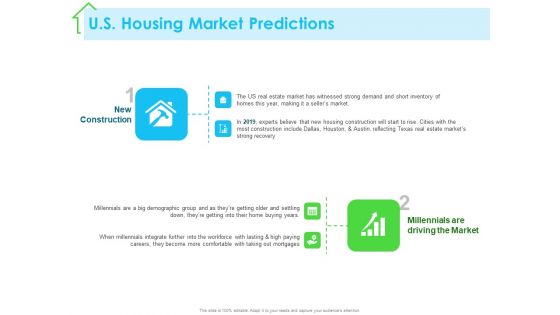
Real Estate Development US Housing Market Predictions Ppt PowerPoint Presentation Ideas Deck PDF
Presenting this set of slides with name real estate development us housing market predictions ppt powerpoint presentation ideas deck pdf. This is a two stage process. The stages in this process are new construction, millennials driving market, demographic group, millennials integrate further. This is a completely editable PowerPoint presentation and is available for immediate download. Download now and impress your audience.
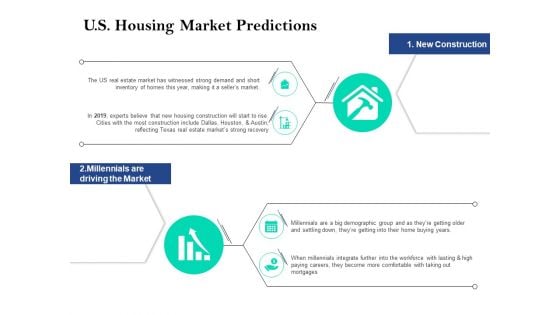
Property Investment Strategies U S Housing Market Predictions Ppt PowerPoint Presentation Show Model PDF
Presenting property investment strategies u s housing market predictions ppt powerpoint presentation show model pdf. to provide visual cues and insights. Share and navigate important information on two stages that need your due attention. This template can be used to pitch topics like construction, experts believe, millennials, demographic, comfortable. In addtion, this PPT design contains high resolution images, graphics, etc, that are easily editable and available for immediate download.
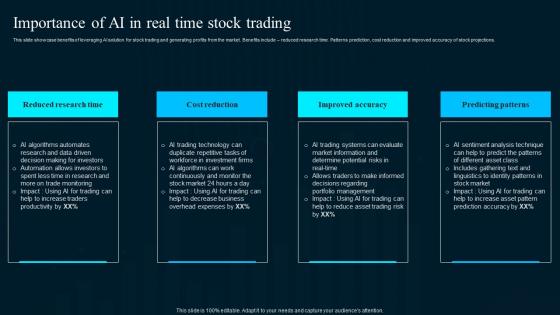
Importance Of Ai In Real Time Stock Trading Artificial Intelligence Applications Themes Pdf
This slide showcase benefits of leveraging AI solution for stock trading and generating profits from the market. Benefits include reduced research time. Patterns prediction, cost reduction and improved accuracy of stock projections.Explore a selection of the finest Importance Of Ai In Real Time Stock Trading Artificial Intelligence Applications Themes Pdf here. With a plethora of professionally designed and pre-made slide templates, you can quickly and easily find the right one for your upcoming presentation. You can use our Importance Of Ai In Real Time Stock Trading Artificial Intelligence Applications Themes Pdf to effectively convey your message to a wider audience. Slidegeeks has done a lot of research before preparing these presentation templates. The content can be personalized and the slides are highly editable. Grab templates today from Slidegeeks. This slide showcase benefits of leveraging AI solution for stock trading and generating profits from the market. Benefits include reduced research time. Patterns prediction, cost reduction and improved accuracy of stock projections.
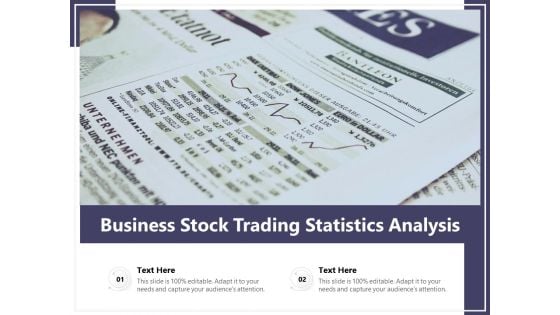
Business Stock Trading Statistics Analysis Ppt PowerPoint Presentation File Formats PDF
Presenting this set of slides with name business stock trading statistics analysis ppt powerpoint presentation file formats pdf. The topics discussed in these slide is business stock trading statistics analysis. This is a completely editable PowerPoint presentation and is available for immediate download. Download now and impress your audience.
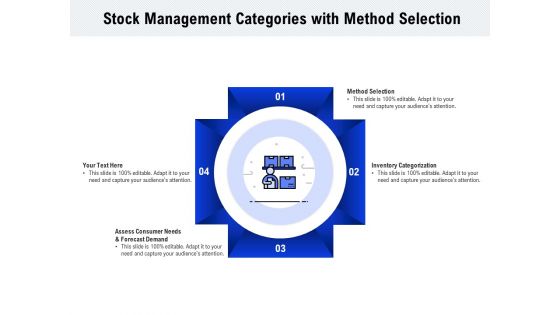
Stock Management Categories With Method Selection Ppt PowerPoint Presentation Summary Gridlines PDF
Presenting this set of slides with name stock management categories with method selection ppt powerpoint presentation summary gridlines pdf. This is a four stage process. The stages in this process are segmentation of market, marketing mix, market share, demand estimate. This is a completely editable PowerPoint presentation and is available for immediate download. Download now and impress your audience.
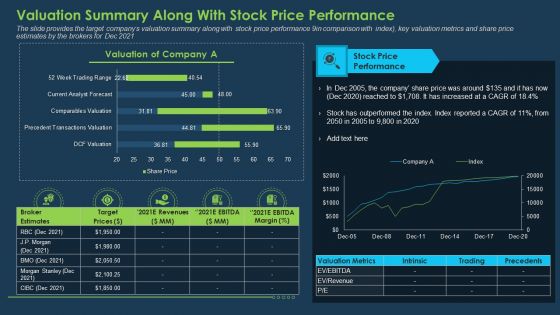
Commercial Banking Template Collection Valuation Summary Along With Stock Price Performance Diagrams PDF
The slide provides the target companys valuation summary along with stock price performance 9in comparison with index, key valuation metrics and share price estimates by the brokers for Dec 2021. Deliver and pitch your topic in the best possible manner with this commercial banking template collection valuation summary along with stock price performance diagrams pdf. Use them to share invaluable insights on stock price performance, revenues, target prices and impress your audience. This template can be altered and modified as per your expectations. So, grab it now.
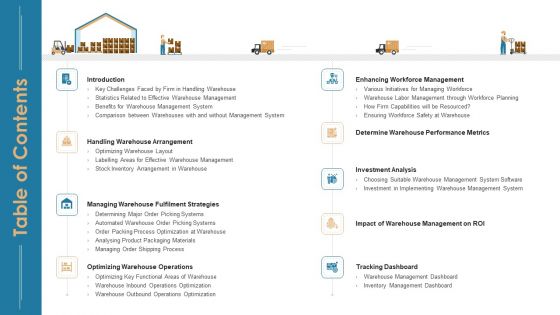
Stock Repository Management For Inventory Control Table Of Contents Ppt Infographics Example Topics PDF
Deliver an awe inspiring pitch with this creative stock repository management for inventory control table of contents ppt infographics example topics pdf bundle. Topics like optimizing warehouse operations, tracking dashboard, investment analysis can be discussed with this completely editable template. It is available for immediate download depending on the needs and requirements of the user.
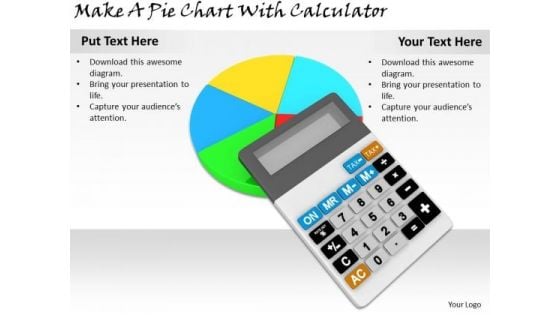
Stock Photo Business Strategy Implementation Make Pie Chart With Calculator Photos
Good Camaraderie Is A Key To Teamwork. Our stock photo business strategy implementation make pie chart with calculator stock photo photos Powerpoint Templates Can Be A Cementing Force. Our Marketing Powerpoint Templates Are An Agent Of Change. Let Your Thoughts Go Down Uncharted Courses.
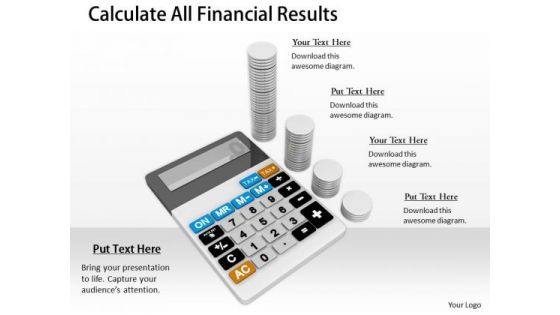
Stock Photo Business Planning Strategy Calculate All Financial Results Success Images
Knock On The Door To Success With Our stock photo business planning strategy calculate all financial results stock photo success images Powerpoint Templates. Be Assured Of Gaining Entry. Give Them A Dose Of Your Ability. It Will Go Down Well With Our Finance Powerpoint Templates.
Stock Photo Business Growth Strategy Coins Concept Of Financial Pictures Images
Compel Fate With Our stock photo business growth strategy coins concept of financial pictures images. The Dice Will Fall As Per Your Forecast. Acquire Fame As An Accurate Forecaster. Our marketing Ensure The Fall Of The Dice.
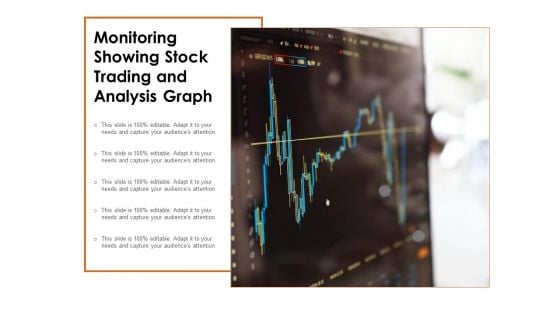
Monitoring Showing Stock Trading And Analysis Graph Ppt PowerPoint Presentation Ideas Slideshow PDF
Presenting this set of slides with name monitoring showing stock trading and analysis graph ppt powerpoint presentation ideas slideshow pdf. This is a one stage process. The stage in this process is monitoring showing stock trading and analysis graph. This is a completely editable PowerPoint presentation and is available for immediate download. Download now and impress your audience.
Stock Photo Business Growth Strategy Coins Concept Of Money Pictures Images
Control The Fall Of The Dice With Our stock photo business growth strategy coins concept of money pictures images. Your Forecasts Will Come Out Correct. Our marketing Can Control Fate. The Dice Will Fall As Per Your Call.
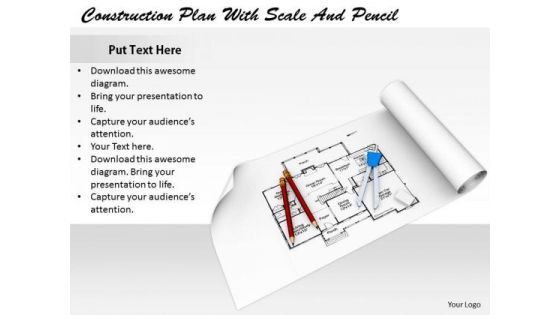
Stock Photo Business Planning Strategy Construction With Scale And Pencil Pictures Images
Disregard Any Foreboding With Our stock photo business planning strategy construction with scale and pencil pictures images. They Ensure A Bright Forecast. Our Education Can Be Very Arousing. Develop On The Drive In Them To Excel.
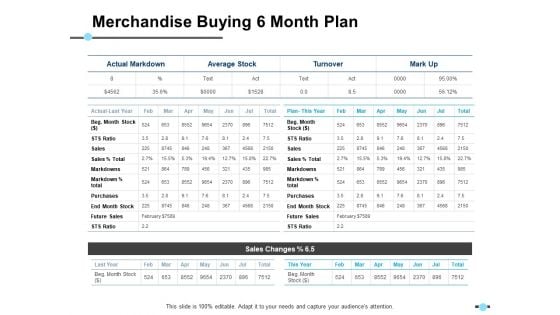
Merchandise Buying 6 Month Plan Average Stock Ppt PowerPoint Presentation Gallery Example File
This is a merchandise buying 6 month plan average stock ppt powerpoint presentation gallery example file. This is a four stage process. The stages in this process are business, management, strategy, analysis, marketing.
Stock Photo It Business Strategy Money Pot With Calculator Icons Images
Good Camaraderie Is A Key To Teamwork. Our stock photo it business strategy money pot with calculator icons images Powerpoint Templates Can Be A Cementing Force. Our Money Powerpoint Templates Are An Agent Of Change. Let Your Thoughts Go Down Uncharted Courses.
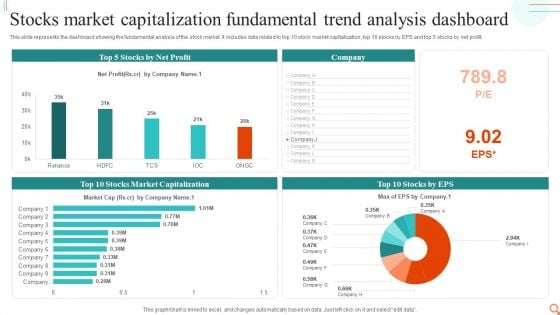
Stocks Market Capitalization Fundamental Trend Analysis Dashboard Designs PDF
This slide represents the dashboard showing the fundamental analysis of the stock market. It includes data related to top 10 stock market capitalization, top 10 stocks by EPS and top 5 stocks by net profit.Showcasing this set of slides titled Stocks Market Capitalization Fundamental Trend Analysis Dashboard Designs PDF. The topics addressed in these templates are Market Capitalization, Net Profit. All the content presented in this PPT design is completely editable. Download it and make adjustments in color, background, font etc. as per your unique business setting.
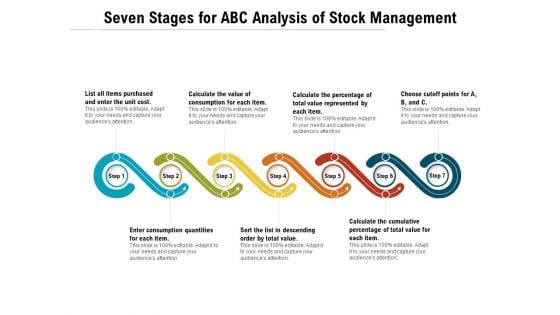
Seven Stages For ABC Analysis Of Stock Management Ppt PowerPoint Presentation File Microsoft PDF
Persuade your audience using this seven stages for abc analysis of stock management ppt powerpoint presentation file microsoft pdf. This PPT design covers seven stages, thus making it a great tool to use. It also caters to a variety of topics including list all items purchased and enter the unit cost, calculate the value of consumption for each item, calculate the percentage of total value represented by each item, choose cutoff points for a, b, and c, calculate the cumulative percentage of total value for each item, sort the list in descending order by total value, enter consumption quantities for each item. Download this PPT design now to present a convincing pitch that not only emphasizes the topic but also showcases your presentation skills
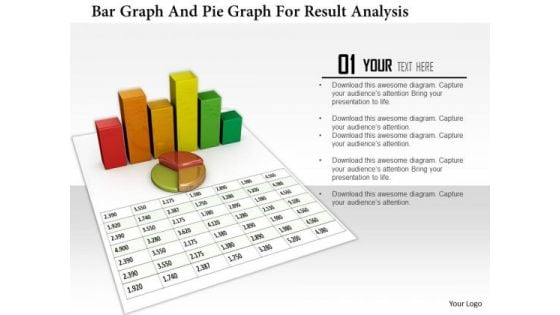
Stock Photo Bar Graph And Pie Graph For Result Analysis PowerPoint Slide
3D business graphs have been used to design this PowerPoint template. This Image slide is suitable to make business reports and charts. This slide can be used for business and marketing presentations.
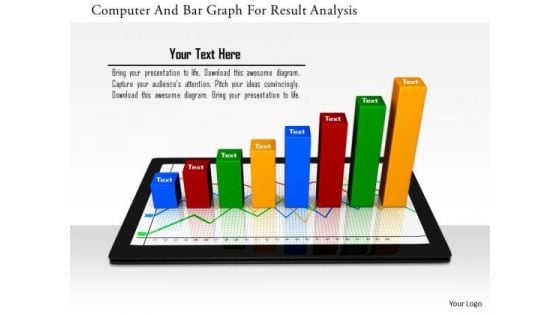
Stock Photo Computer And Bar Graph For Result Analysis PowerPoint Slide
This Power point template has been crafted with graphic of computer and bar graph. This PPT contains the concept of technology and result analysis. Use this PPT for your business and technology related presentations.
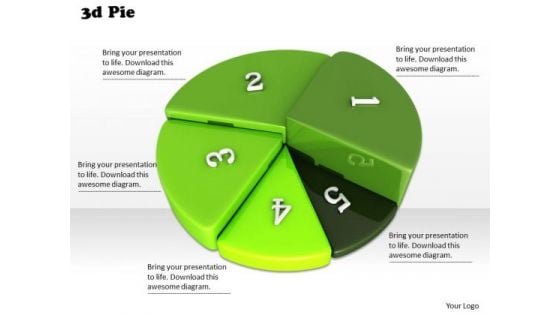
Stock Photo Green 3d Pie Chart For Result Analysis PowerPoint Slide
Develop competitive advantage with this image which contains 3d pie chart with five steps. Use this image to define steps of business process with this image of pie chart. This image is an excellent tool to give an ideal presentation.
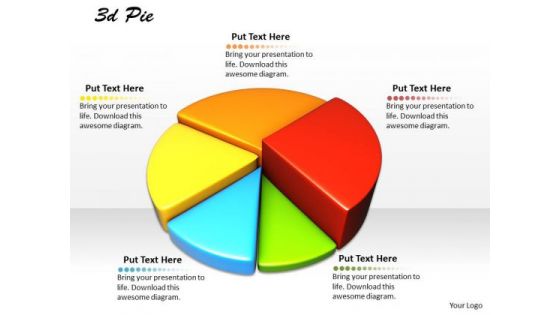
Stock Photo Multicolor Pie Chart For Business Result Analysis PowerPoint Slide
Develop competitive advantage with this image which contains 3d pie chart with five steps. Use this image to define steps of business process with this image of pie chart. This image is an excellent tool to give an ideal presentation.
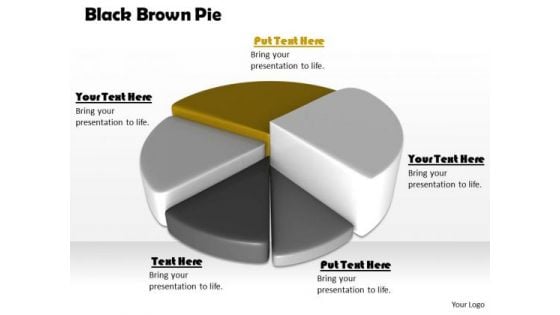
Stock Photo Black Brown Pie Chart For Business Result PowerPoint Slide
This high quality image is designed with pie chart. Use this image to make business reports. Use this outstanding image in presentations relating to data analysis and reports. Go ahead and add charm to your presentations.
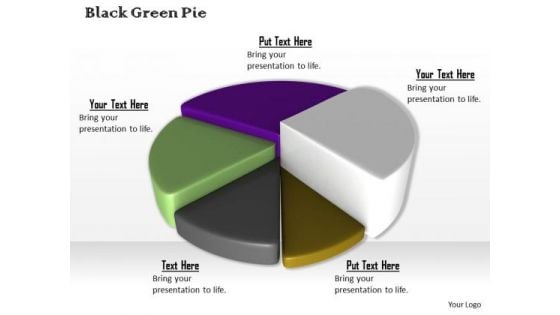
Stock Photo Colorful 3d Pie Chart For Business Result PowerPoint Slide
This high quality image is designed with pie chart. Use this image to make business reports. Use this outstanding image in presentations relating to data analysis and reports. Go ahead and add charm to your presentations.
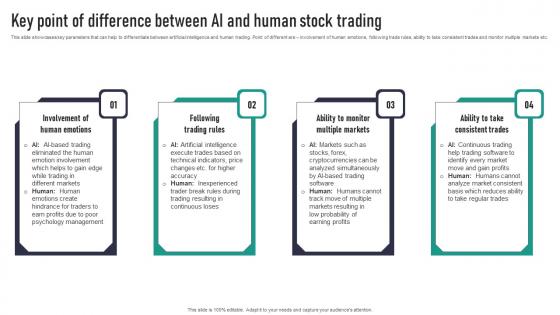
Key Point Of Difference Between AI And Human Stock Trading Infographics Pdf
This slide showcases key parameters that can help to differentiate between artificial intelligence and human trading. Point of different are involvement of human emotions, following trade rules, ability to take consistent trades and monitor multiple markets etc. Retrieve professionally designed Key Point Of Difference Between AI And Human Stock Trading Infographics Pdf to effectively convey your message and captivate your listeners. Save time by selecting pre-made slideshows that are appropriate for various topics, from business to educational purposes. These themes come in many different styles, from creative to corporate, and all of them are easily adjustable and can be edited quickly. Access them as PowerPoint templates or as Google Slides themes. You do not have to go on a hunt for the perfect presentation because Slidegeeks got you covered from everywhere. This slide showcases key parameters that can help to differentiate between artificial intelligence and human trading. Point of different are involvement of human emotions, following trade rules, ability to take consistent trades and monitor multiple markets etc.

Tactical Guide For Stock Administration And Monitoring Ppt PowerPoint Presentation Complete Deck With Slides
This sixty three slide Tactical Guide For Stock Administration And Monitoring Ppt PowerPoint Presentation Complete Deck With Slides is your content ready tool to impress the stakeholders with your business planning and its manner of execution. Showcase your ideas and how you plan to make them real in detail with this PPT Template Bundle. The slides have the conceptual bandwidth to present the crucial aspects of your plan, such as funding, marketing, resource allocation, timeline, roadmap, and more. When you present your plans with this PPT Layout, the stakeholders are sure to come on board because you will be able to present a succinct, thought-out, winning project. Download this Complete Deck now to take control into your hands. The 100 percent customizable offer is just too good to be resisted. Our Tactical Guide For Stock Administration And Monitoring Ppt PowerPoint Presentation Complete Deck With Slides are topically designed to provide an attractive backdrop to any subject. Use them to look like a presentation pro.
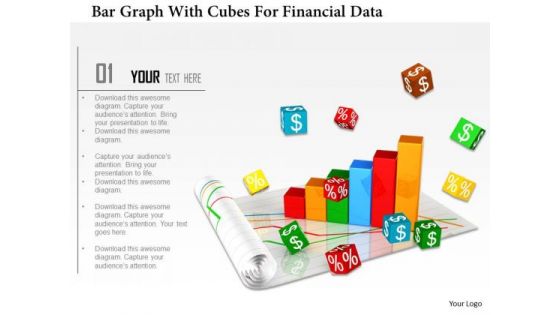
Stock Photo Bar Graph With Cubes For Financial Data PowerPoint Slide
Graphic of bar graph and cubes are used to decorate this image template. This PPT contains the concept of financial data analysis. Use this PPT for finance and business related presentations.
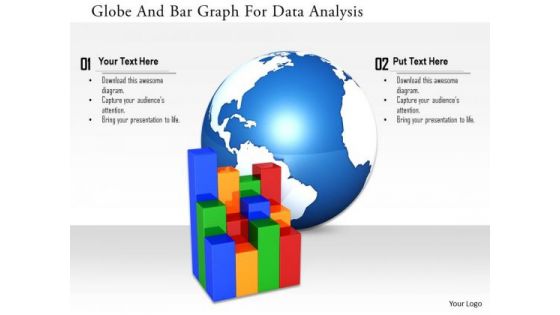
Stock Photo Globe And Bar Graph For Data Analysis Image Graphics For PowerPoint Slide
This image slide has been designed with business graph with globe in background. This image slide represents topics like global business, economic growth. This image will enhance the quality of your presentations.
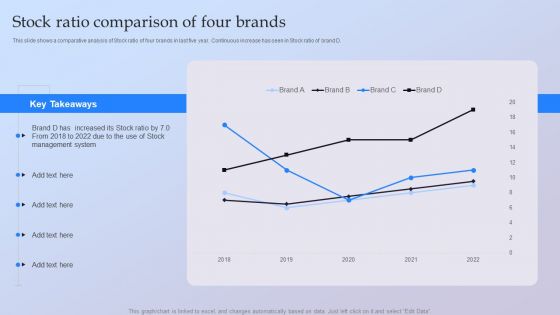
Stock Ratio Comparison Of Four Brands Ppt Model Layout Ideas PDF
This slide shows a comparative analysis of Stock ratio of four brands in last five year. Continuous increase has seen in Stock ratio of brand D. Showcasing this set of slides titled Stock Ratio Comparison Of Four Brands Ppt Model Layout Ideas PDF. The topics addressed in these templates are 2018 To 2022, Stock Ratio, Stock Management System. All the content presented in this PPT design is completely editable. Download it and make adjustments in color, background, font etc. as per your unique business setting.
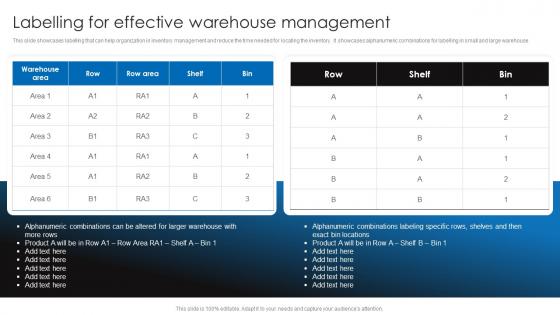
Labelling For Effective Warehouse Management Retail Stock Administration Strategies Diagrams Pdf
This slide showcases labelling that can help organization in inventory management and reduce the time needed for locating the inventory. It showcases alphanumeric combinations for labelling in small and large warehouse.Take your projects to the next level with our ultimate collection of Labelling For Effective Warehouse Management Retail Stock Administration Strategies Diagrams Pdf. Slidegeeks has designed a range of layouts that are perfect for representing task or activity duration, keeping track of all your deadlines at a glance. Tailor these designs to your exact needs and give them a truly corporate look with your own brand colors they all make your projects stand out from the rest. This slide showcases labelling that can help organization in inventory management and reduce the time needed for locating the inventory. It showcases alphanumeric combinations for labelling in small and large warehouse
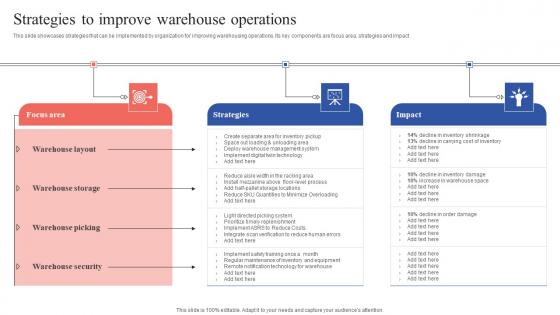
Strategies To Improve Warehouse Operations Tactical Guide Stock Administration Diagrams Pdf
This slide showcases strategies that can be implemented by organization for improving warehousing operations. Its key components are focus area, strategies and impact. Take your projects to the next level with our ultimate collection of Strategies To Improve Warehouse Operations Tactical Guide Stock Administration Diagrams Pdf. Slidegeeks has designed a range of layouts that are perfect for representing task or activity duration, keeping track of all your deadlines at a glance. Tailor these designs to your exact needs and give them a truly corporate look with your own brand colors they will make your projects stand out from the rest This slide showcases strategies that can be implemented by organization for improving warehousing operations. Its key components are focus area, strategies and impact.
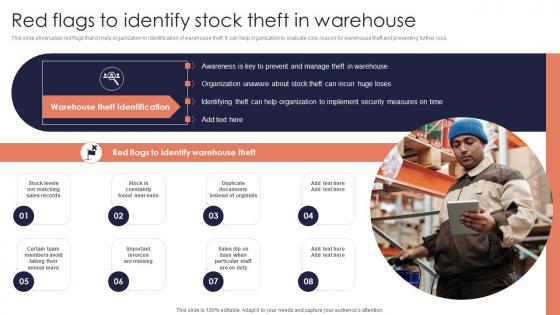
Red Flags To Identify Stock Minimizing Inventory Wastage Through Warehouse Topics Pdf
This slide showcases red flags that cn help organization in identification of warehouse theft. It can help organization to evaluate core reason for warehouse theft and preventing further loss. This modern and well arranged Red Flags To Identify Stock Minimizing Inventory Wastage Through Warehouse Topics Pdf provides lots of creative possibilities. It is very simple to customize and edit with the Powerpoint Software. Just drag and drop your pictures into the shapes. All facets of this template can be edited with Powerpoint, no extra software is necessary. Add your own material, put your images in the places assigned for them, adjust the colors, and then you can show your slides to the world, with an animated slide included. This slide showcases red flags that cn help organization in identification of warehouse theft. It can help organization to evaluate core reason for warehouse theft and preventing further loss.
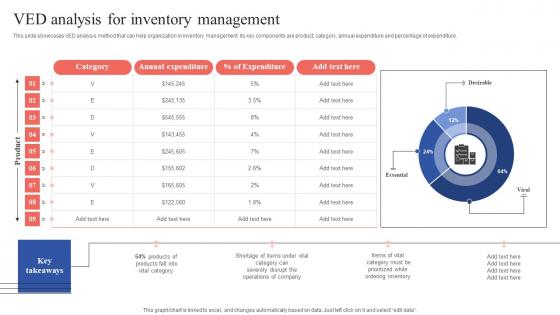
VED Analysis For Inventory Management Tactical Guide Stock Administration Introduction Pdf
This slide showcases VED analysis method that can help organization in inventory management. its key components are product, category, annual expenditure and percentage of expenditure. Slidegeeks is one of the best resources for PowerPoint templates. You can download easily and regulate VED Analysis For Inventory Management Tactical Guide Stock Administration Introduction Pdf for your personal presentations from our wonderful collection. A few clicks is all it takes to discover and get the most relevant and appropriate templates. Use our Templates to add a unique zing and appeal to your presentation and meetings. All the slides are easy to edit and you can use them even for advertisement purposes. This slide showcases VED analysis method that can help organization in inventory management. its key components are product, category, annual expenditure and percentage of expenditure.
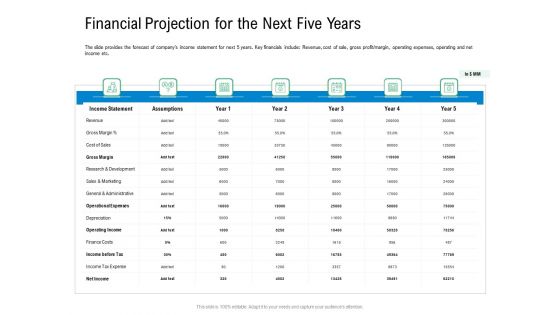
Convertible Preferred Stock Funding Pitch Deck Financial Projection For The Next Five Years Diagrams PDF
The slide provides the forecast of companys income statement for next 5 years. Key financials include Revenue, cost of sale, gross profit or margin, operating expenses, operating and net income etc. Deliver an awe inspiring pitch with this creative convertible preferred stock funding pitch deck financial projection for the next five years diagrams pdf bundle. Topics like sales and marketing, depreciation, cost, finance, administrative can be discussed with this completely editable template. It is available for immediate download depending on the needs and requirements of the user.
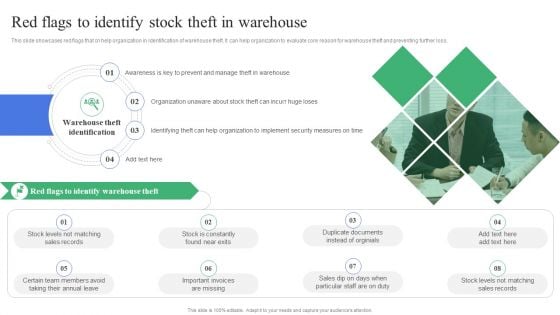
Strategic Guidelines To Administer Red Flags To Identify Stock Theft In Warehouse Brochure PDF
This slide showcases red flags that cn help organization in identification of warehouse theft. It can help organization to evaluate core reason for warehouse theft and preventing further loss. If you are looking for a format to display your unique thoughts, then the professionally designed Strategic Guidelines To Administer Red Flags To Identify Stock Theft In Warehouse Brochure PDF is the one for you. You can use it as a Google Slides template or a PowerPoint template. Incorporate impressive visuals, symbols, images, and other charts. Modify or reorganize the text boxes as you desire. Experiment with shade schemes and font pairings. Alter, share or cooperate with other people on your work. Download Strategic Guidelines To Administer Red Flags To Identify Stock Theft In Warehouse Brochure PDF and find out how to give a successful presentation. Present a perfect display to your team and make your presentation unforgettable.

Stock Inventory Acquisition Forecasting Demand Of Different Types Of Products Slides PDF
This slide showcases graphs that can help organization in forecasting different type of products on the basis of previous data. It showcases quarterly data of three product types. Take your projects to the next level with our ultimate collection of Stock Inventory Acquisition Forecasting Demand Of Different Types Of Products Slides PDF. Slidegeeks has designed a range of layouts that are perfect for representing task or activity duration, keeping track of all your deadlines at a glance. Tailor these designs to your exact needs and give them a truly corporate look with your own brand colors theyll make your projects stand out from the rest.

Procurement Strategies For Reducing Stock Wastage Forecast Demand Using Historical Sales Data Designs PDF
This slide showcases graph that can help organization to forecast the inventory requirement on the basis of sales data of previous financial years. It showcases data of last 3 years. Take your projects to the next level with our ultimate collection of Procurement Strategies For Reducing Stock Wastage Forecast Demand Using Historical Sales Data Designs PDF. Slidegeeks has designed a range of layouts that are perfect for representing task or activity duration, keeping track of all your deadlines at a glance. Tailor these designs to your exact needs and give them a truly corporate look with your own brand colors they will make your projects stand out from the rest.
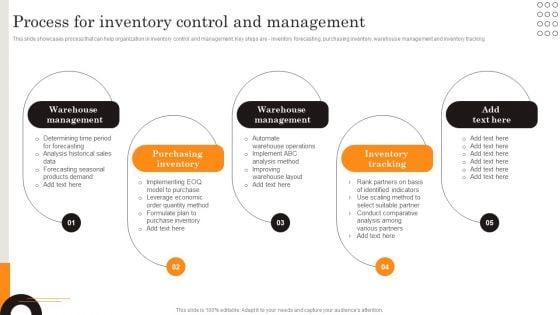
Procurement Strategies For Reducing Stock Wastage Process For Inventory Control Brochure PDF
This slide showcases process that can help organization in inventory control and management. Key steps are inventory forecasting, purchasing inventory, warehouse management and inventory tracking. Are you searching for a Procurement Strategies For Reducing Stock Wastage Process For Inventory Control Brochure PDF that is uncluttered, straightforward, and original Its easy to edit, and you can change the colors to suit your personal or business branding. For a presentation that expresses how much effort you have put in, this template is ideal With all of its features, including tables, diagrams, statistics, and lists, its perfect for a business plan presentation. Make your ideas more appealing with these professional slides. Download Procurement Strategies For Reducing Stock Wastage Process For Inventory Control Brochure PDF from Slidegeeks today.


 Continue with Email

 Home
Home


