Strategy Pillars
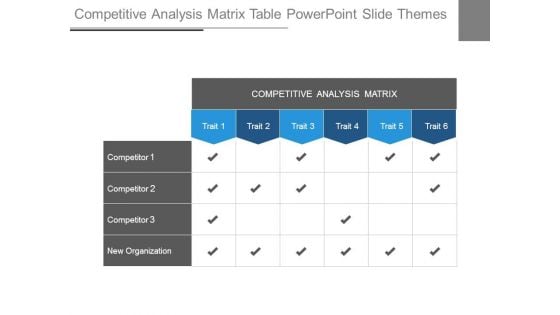
Competitive Analysis Matrix Table Powerpoint Slide Themes
This is a competitive analysis matrix table powerpoint slide themes. This is a six stage process. The stages in this process are competitive analysis matrix, trait, competitor, new organization.
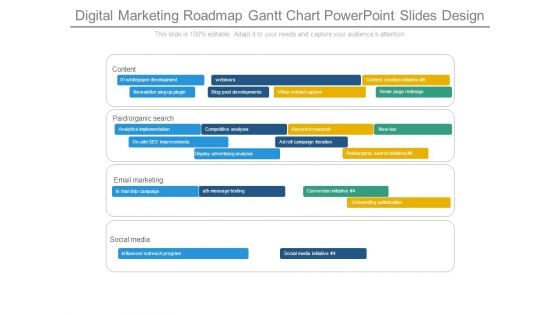
Digital Marketing Roadmap Gantt Chart Powerpoint Slides Design
This is a digital marketing roadmap gantt chart powerpoint slides design. This is a four stage process. The stages in this process are content, whitepaper development, webinars, content creation initiative, newsletter sing up plugin, blog post developments, video lead capture, home page redesign, paid organic search, analytics implementation, competitive analysis, keyword research, new bar, on site seo improvements, ad roll campaign iteration, display advertising analysis, paid organic search initiative, email marketing, trial drip campaign, a b message testing, conversion initiative, onboarding optimization, social media, influencer outreach program , social media initiative.
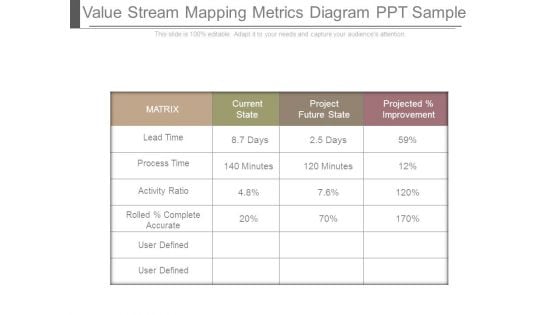
Value Stream Mapping Metrics Diagram Ppt Sample
This is a value stream mapping metrics diagram ppt sample. This is a four stage process. The stages in this process are matrix, current state, project future state, projected improvement, lead time, days, process time, activity ratio, rolled complete accurate, user defined, minutes.
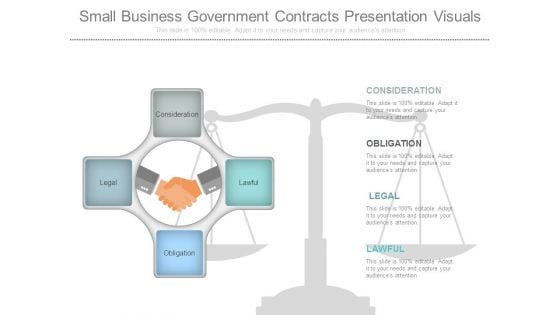
Small Business Government Contracts Presentation Visuals
This is a small business government contracts presentation visuals. This is a four stage process. The stages in this process are consideration, obligation, legal, lawful.
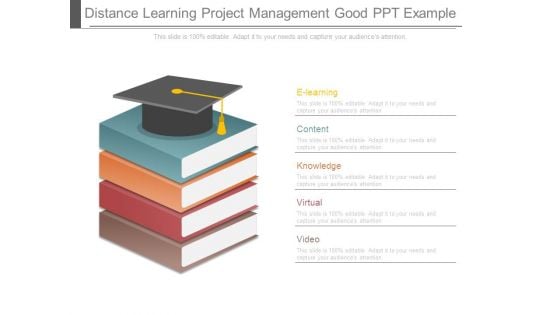
Distance Learning Project Management Good Ppt Example
This is a distance learning project management good ppt example. This is a four stage process. The stages in this process are e learning, content, knowledge, virtual, video.
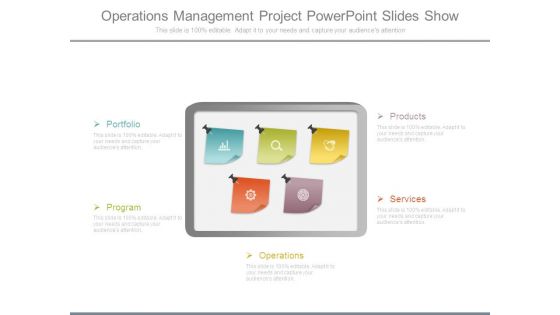
Operations Management Project Powerpoint Slides Show
This is a operations management project powerpoint slides show. This is a five stage process. The stages in this process are portfolio, program, operations, products, services.
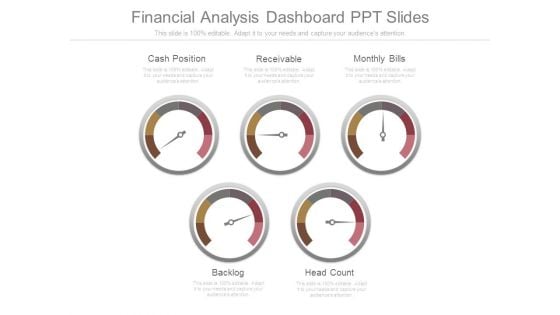
Financial Analysis Dashboard Ppt Slides
This is a financial analysis dashboard ppt slides. This is a five stage process. The stages in this process are cash position, receivable, monthly bills, backlog, head count.
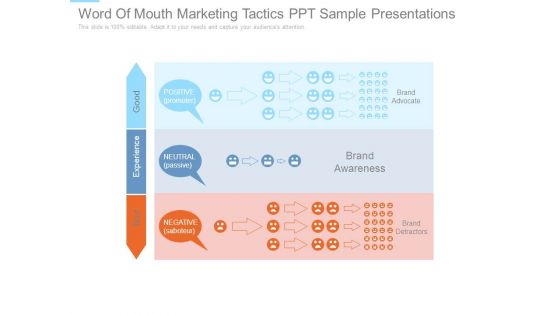
Word Of Mouth Marketing Tactics Ppt Sample Presentations
This is a word of mouth marketing tactics ppt sample presentations. This is a three stage process. The stages in this process are good, experience, bad, positive promoter, neutral passive, negative saboteur brand advocate, brand awareness, brand detractors.
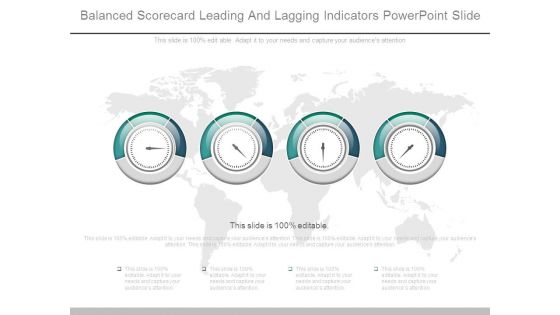
Balanced Scorecard Leading And Lagging Indicators Powerpoint Slide
This is a balanced scorecard leading and lagging indicators powerpoint slide. This is a four stage process. The stages in this process are dashboard, business, marketing, technology, meter.
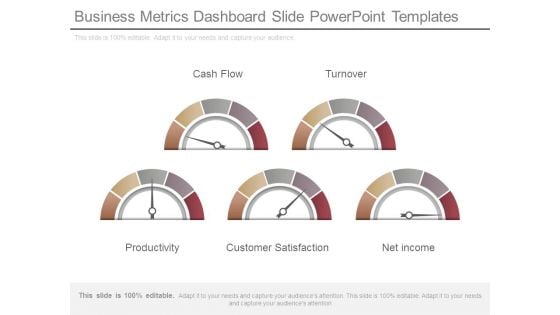
Business Metrics Dashboard Slide Powerpoint Templates
This is a business metrics dashboard slide powerpoint templates. This is a five stage process. The stages in this process are cash flow, turnover, productivity, customer satisfaction, net income.
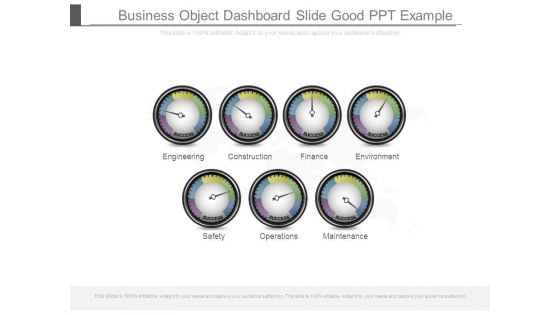
Business Object Dashboard Slide Good Ppt Example
This is a business object dashboard slide good ppt example. This is a seven stage process. The stages in this process are engineering, construction, finance, environment, safety, operations, maintenance.
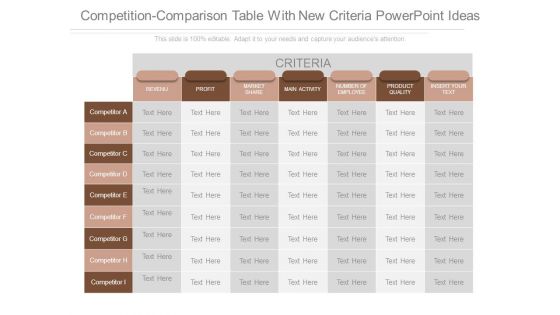
Competition Comparison Table With New Criteria Powerpoint Ideas
This is a competition comparison table with new criteria powerpoint ideas. This is a seven stage process. The stages in this process are revenu, profit, market share, main activity, number of employee, product quality, insert your text.
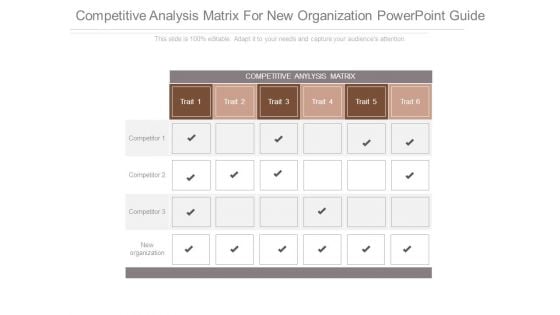
Competitive Analysis Matrix For New Organization Powerpoint Guide
This is a competitive analysis matrix for new organization powerpoint guide. This is a six stage process. The stages in this process are competitive anylysis matrix, new organization.
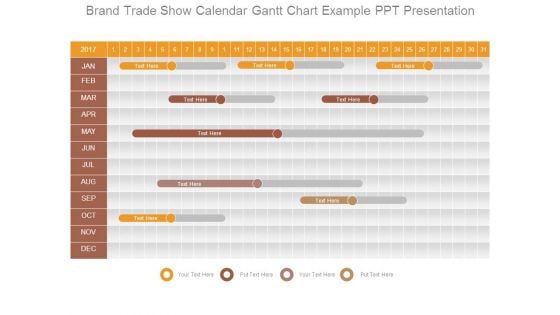
Brand Trade Show Calendar Gantt Chart Example Ppt Presentation
This is a brand trade show calendar gantt chart example ppt presentation. This is a one stage process. The stages in this process are jan, feb, mar, apr, may, jun, jul, aug, sep, oct, nov, dec.
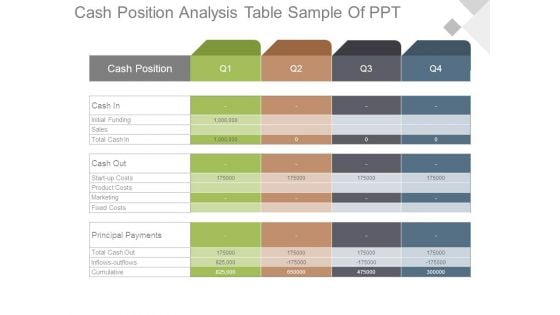
Cash Position Analysis Table Sample Of Ppt
This is a cash position analysis table sample of ppt. This is a four stage process. The stages in this process are cash position, cash in, initial funding, sales, total cash in, cash out, start up costs, product costs, marketing, fixed costs, principal payments, total cash out, inflows outflows, cumulative.
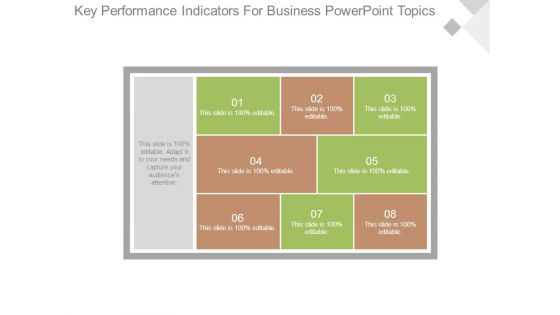
Key Performance Indicators For Business Powerpoint Topics
This is a key performance indicators for business powerpoint topics. This is a eight stage process. The stages in this process are business, marketing, tables, management.

Calendar For Upcoming Trade Shows Powerpoint Layout
This is a calendar for upcoming trade shows powerpoint layout. This is a six stage process. The stages in this process are jan, feb, mar, apr, may, jun, jul, aug, sep, oct, nov, dec.
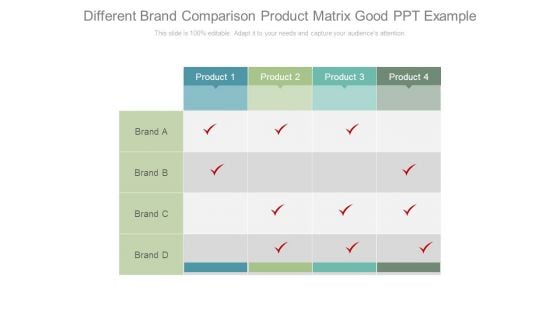
Different Brand Comparison Product Matrix Good Ppt Example
This is a different brand comparison product matrix good ppt example. This is a four stage process. The stages in this process are product, brand.
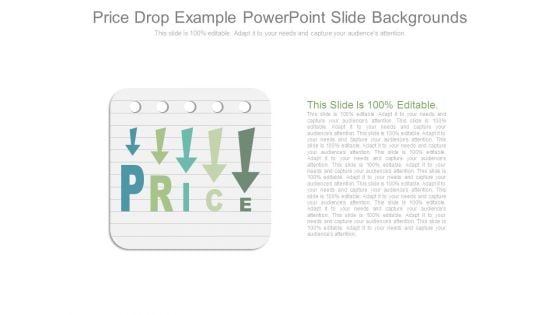
Price Drop Example Powerpoint Slide Backgrounds
This is a price drop example powerpoint slide backgrounds. This is a one stage process. The stages in this process are price.

Four Darts On Target For Success Presentation Backgrounds
This is a four darts on target for success presentation backgrounds. This is a four stage process. The stages in this process are what do we do today, why do we do it, for whom we do it, what is the benefit.
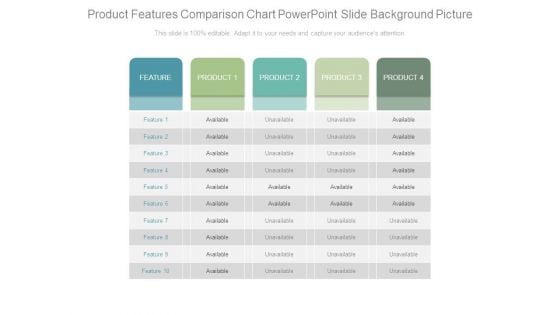
Product Features Comparison Chart Powerpoint Slide Background Picture
This is a product features comparison chart powerpoint slide background picture. This is a four stage process. The stages in this process are feature, product, available, unavailable.
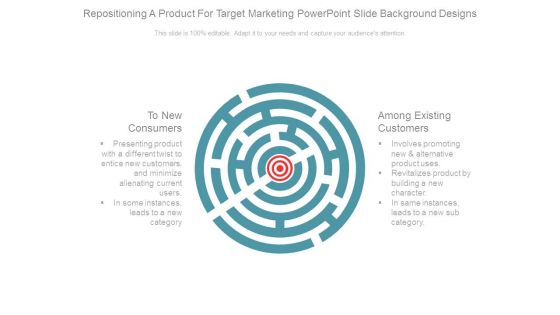
Repositioning A Product For Target Marketing Powerpoint Slide Background Designs
This is a repositioning a product for target marketing powerpoint slide background designs. This is a one stage process. The stages in this process are to new consumers, among existing customers, presenting product with a different twist to entice new customers and minimize alienating current users, in some instances leads to a new category, involves promoting new and alternative product uses, revitalizes product by building a new character, in same instances leads to a new sub category.
Company Mission With Target Analysis Powerpoint Graphics
This is a company mission with target analysis powerpoint graphics. This is a one stage process. The stages in this process are mission.
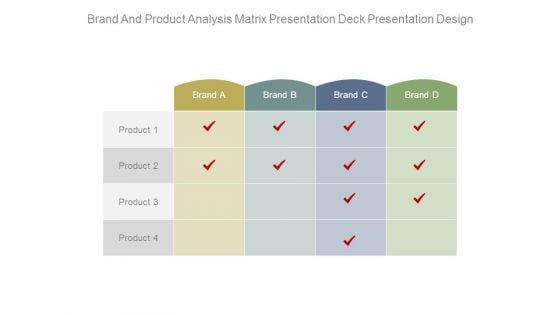
Brand And Product Analysis Matrix Presentation Deck Presentation Design
This is a brand and product analysis matrix presentation deck presentation design. This is a four stage process. The stages in this process are product, brand.
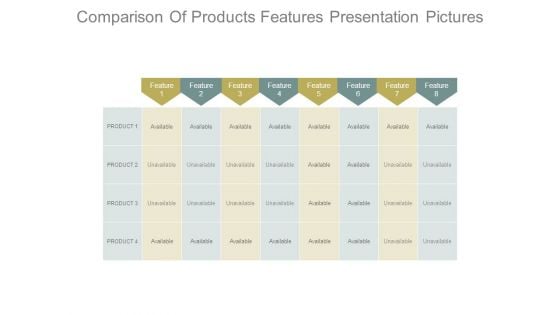
Comparison Of Products Features Presentation Pictures
This is a comparison of products features presentation pictures. This is a eight stage process. The stages in this process are feature, product, available, unavailable.

Product Quality Check Meter Presentation Layouts
This is a product quality check meter presentation layouts. This is a five stage process. The stages in this process are bad, poor, average, good, excellent.
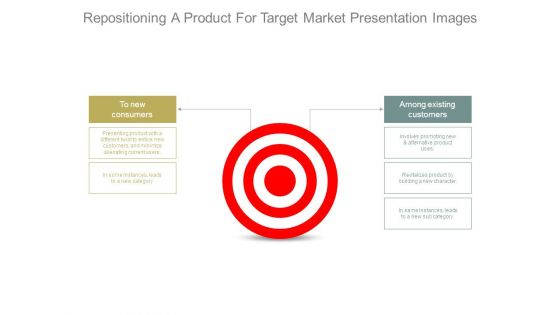
Repositioning A Product For Target Market Presentation Images
This is a repositioning a product for target market presentation images. This is a one stage process. The stages in this process are to new consumers, presenting product with a different twist to entice new customers and minimize alienating current users, in some instances leads to a new category, among existing customers, involves promoting new and alternative product uses, revitalizes product by building a new character, in same instances leads to a new sub category.
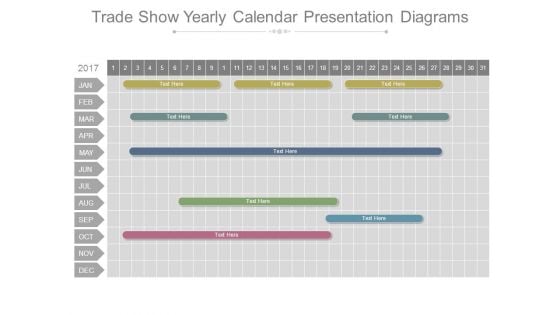
Trade Show Yearly Calendar Presentation Diagrams
This is a trade show yearly calendar presentation diagrams. This is a six stage process. The stages in this process are jan, feb, mar, apr, may, jun, jul, aug, sep, oct, nov, dec.
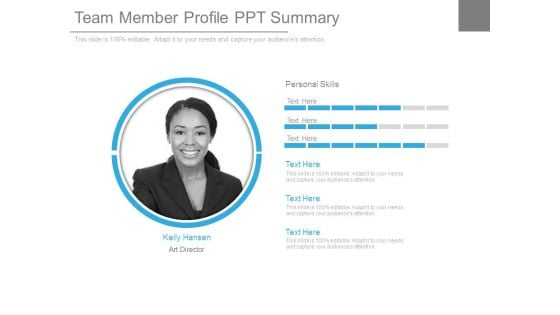
Team Member Profile Ppt Summary
This is a team member profile ppt summary. This is a one stage process. The stages in this process are kelly hansen art director, personal skills.
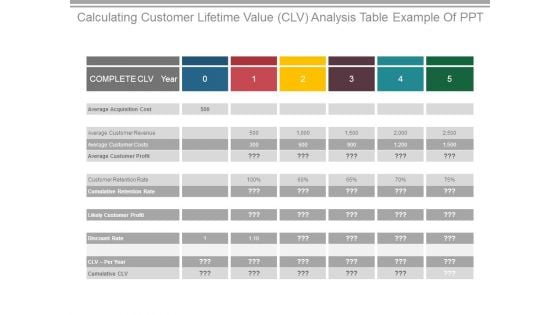
Calculating Customer Lifetime Value Clv Analysis Table Example Of Ppt
This is a calculating customer lifetime value clv analysis table example of ppt. This is a five stage process. The stages in this process are complete clv year, average acquisition cost, average customer revenue, average customer costs, average customer profit, customer retention rate, likely customer profit, discount rate.
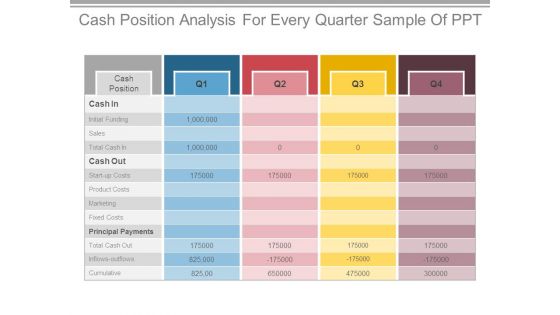
Cash Position Analysis For Every Quarter Sample Of Ppt
This is a cash position analysis for every quarter sample of ppt. This is a four stage process. The stages in this process are cash position, initial funding, sales, start up costs, product costs, marketing, fixed costs, principal payments, total cash out.
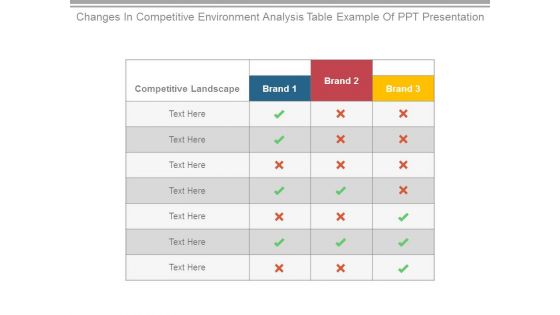
Changes In Competitive Environment Analysis Table Example Of Ppt Presentation
This is a changes in competitive environment analysis table example of ppt presentation. This is a three stage process. The stages in this process are competitive landscape.
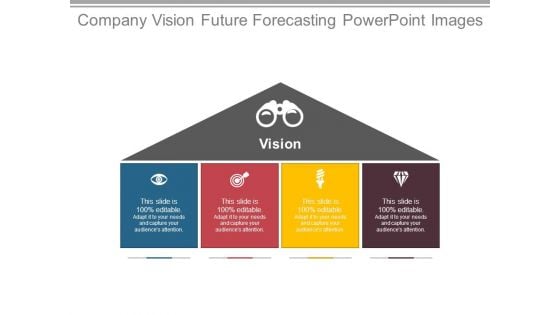
Company Vision Future Forecasting Powerpoint Images
This is a company vision future forecasting powerpoint images. This is a four stage process. The stages in this process are vision.
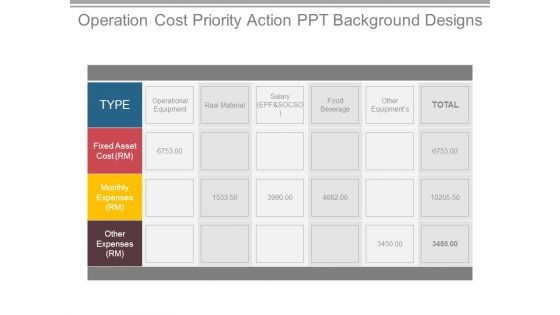
Operation Cost Priority Action Ppt Background Designs
This is a operation cost priority action ppt background designs. This is a four stage process. The stages in this process are fixed asset cost rm, monthly expenses rm, other expenses rm.
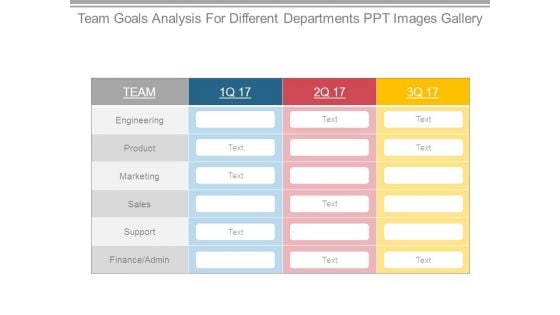
Team Goals Analysis For Different Departments Ppt Images Gallery
This is a team goals analysis for different departments ppt images gallery. This is a three stage process. The stages in this process are engineering, product, marketing, sales, support, finance admin.
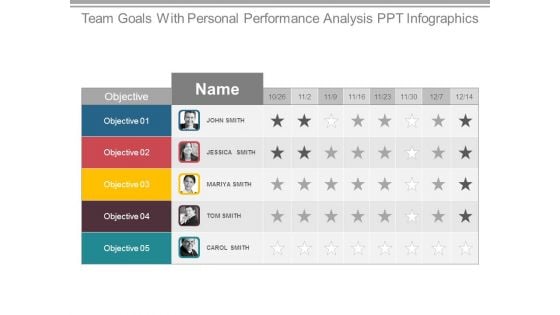
Team Goals With Personal Performance Analysis Ppt Infographics
This is a team goals with personal performance analysis ppt infographics. This is a five stage process. The stages in this process are john smith, jessica smith, mariya smith, tom smith, carol smith.
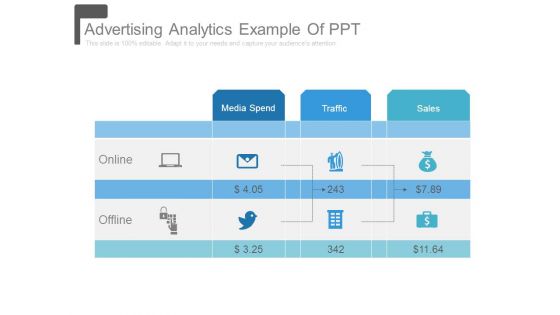
Advertising Analytics Example Of Ppt
This is a advertising analytics example of ppt. This is a three stage process. The stages in this process are media spend, traffic, sales, offline, online.
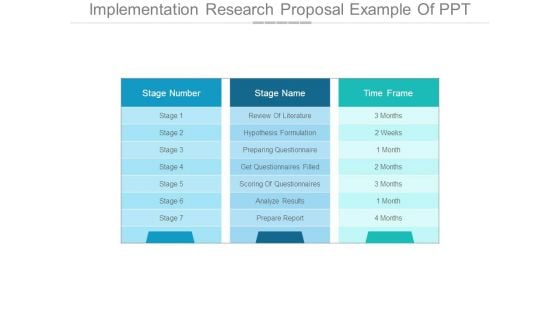
Implementation Research Proposal Example Of Ppt
This is a implementation research proposal example of ppt. This is a three stage process. The stages in this process are review of literature, hypothesis formulation, preparing questionnaire, get questionnaires filled, scoring of questionnaires, analyze results, prepare report.
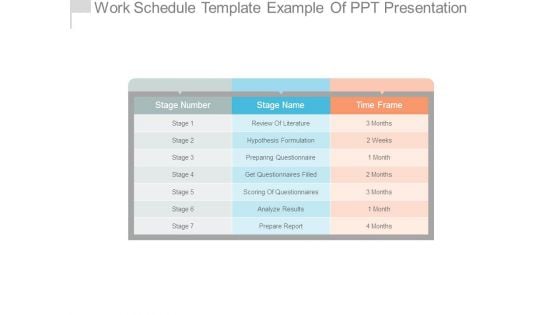
Work Schedule Template Example Of Ppt Presentation
This is a work schedule template example of ppt presentation. This is a seven stage process. The stages in this process are review of literature, hypothesis formulation, preparing questionnaire, get questionnaires filled, scoring of questionnaires, analyze results, prepare report.
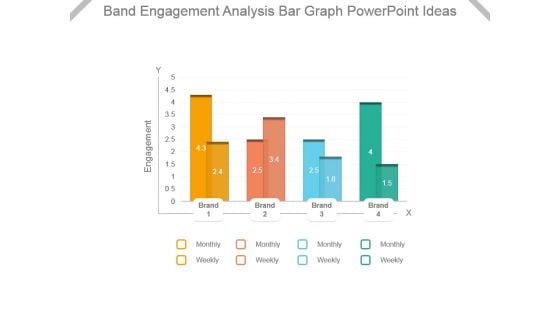
Band Engagement Analysis Bar Graph Powerpoint Ideas
This is a band engagement analysis bar graph powerpoint ideas. This is a four stage process. The stages in this process are engagement, brand, monthly, weekly.
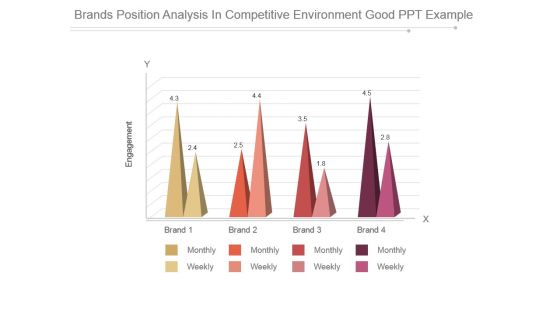
Brands Position Analysis In Competitive Environment Good Ppt Example
This is a brands position analysis in competitive environment good ppt example. This is a four stage process. The stages in this process are engagement, brand, monthly, weekly.
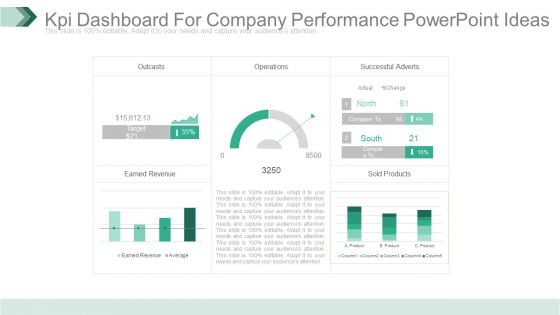
Kpi Dashboard For Company Performance Powerpoint Ideas
This is a kpi dashboard for company performance powerpoint ideas. This is a five stage process. The stages in this process are outcasts, operations, successful adverts, earned revenue, sold products.
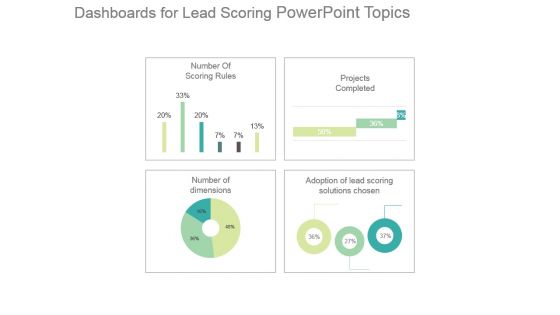
Dashboards For Lead Scoring Powerpoint Topics
This is a dashboards for lead scoring powerpoint topics. This is a four stage process. The stages in this process are number of scoring rules, projects completed, adoption of lead scoring solutions chosen, number of dimensions.
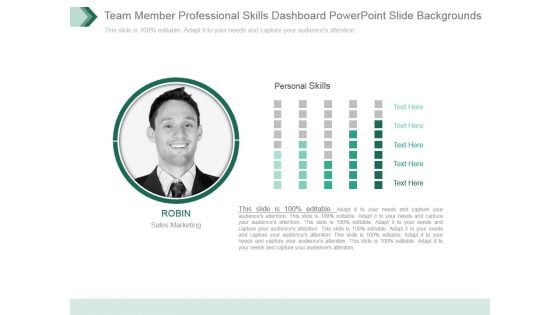
Team Member Professional Skills Dashboard Powerpoint Slide Backgrounds
This is a team member professional skills dashboard powerpoint slide backgrounds. This is a one stage process. The stages in this process are personal skills, sales marketing, business, management, presentation.
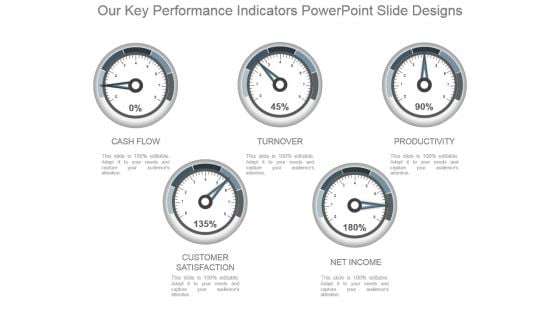
Our Key Performance Indicators Powerpoint Slide Designs
This is a our key performance indicators powerpoint slide designs. This is a five stage process. The stages in this process are cash flow, turnover, productivity, customer satisfaction, net income.
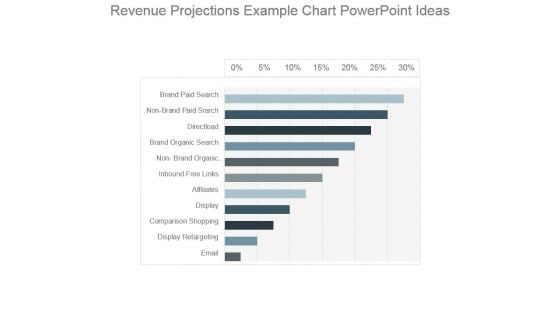
Revenue Projections Example Chart Powerpoint Ideas
This is a revenue projections example chart powerpoint ideas. This is a eleven stage process. The stages in this process are brand paid search, non branded paid search, direct load, brand organic search, non brand organic, inbound free links, affiliates, display, comparison shopping, display retargeting, email.
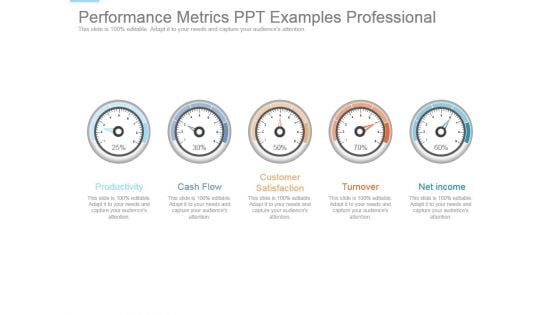
Performance Metrics Ppt Examples Professional
This is a performance metrics ppt examples professional. This is a five stage process. The stages in this process are productivity, cash flow, customer satisfaction, turnover, net income.
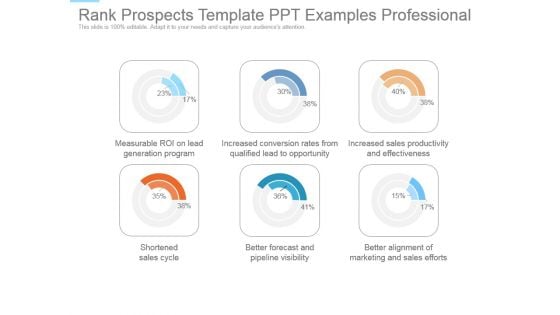
Rank Prospects Template Ppt Examples Professional
This is a rank prospects template ppt examples professional. This is a six stage process. The stages in this process are measurable roi on lead generation program, increased conversion rates from qualified lead to opportunity, increased sales productivity and effectiveness, shortened sales cycle, better forecast and pipeline visibility, better alignment of marketing and sales efforts.
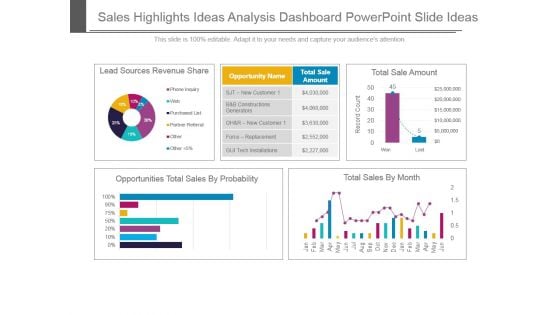
Sales Highlights Ideas Analysis Dashboard Powerpoint Slide Ideas
This is a sales highlights ideas analysis dashboard powerpoint slide ideas. This is a four stage process. The stages in this process are lead sources revenue share, opportunities total sales by probability, total sale amount, total sales by month, opportunity name, total sale amount.
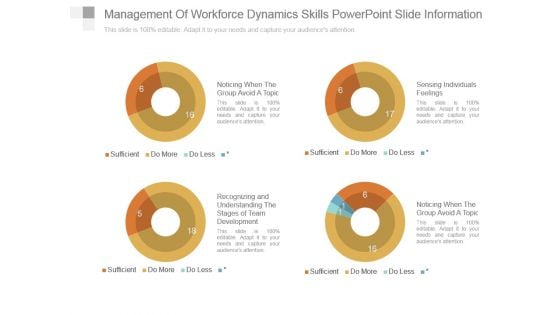
Management Of Workforce Dynamics Skills Powerpoint Slide Information
This is a management of workforce dynamics skills powerpoint slide information. This is a four stage process. The stages in this process are noticing when the group avoid a topic, recognizing and understanding the, stages of team development, sensing individuals feelings, noticing when the group avoid a topic.

Revenue Kpi Dashboard Ppt Infographic Template
This is a revenue kpi dashboard ppt infographic template. This is a five stage process. The stages in this process are outcasts, successful adverts, earned revenue, sold products, operations.
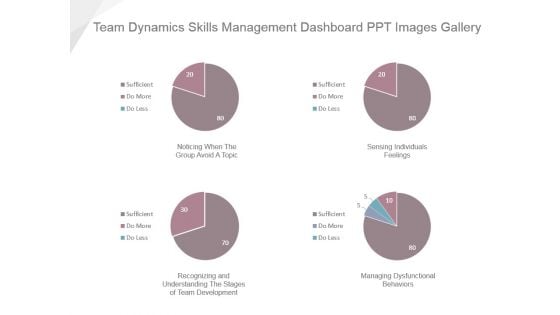
Team Dynamics Skills Management Dashboard Ppt Images Gallery
This is a team dynamics skills management dashboard ppt images gallery. This is a four stage process. The stages in this process are noticing when the group avoid a topic, sensing individuals feelings, recognizing and understanding the stages of team development, managing dysfunctional behaviors.
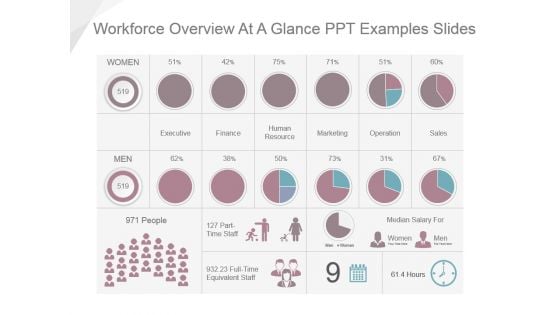
Workforce Overview At A Glance Ppt Examples Slides
This is a workforce overview at a glance ppt examples slides. This is a seven stage process. The stages in this process are executive, finance, human resource, marketing, operation, sales, median salary for.
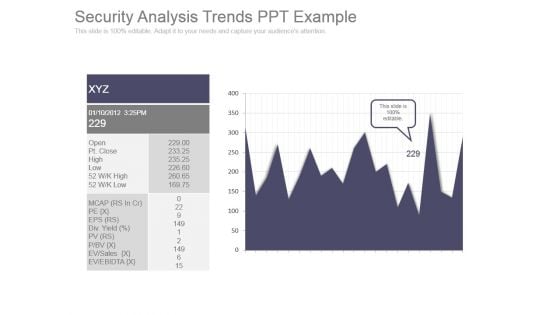
Security Analysis Trends Ppt Example
This is a security analysis trends ppt example. This is a one stage process. The stages in this process are open, pt close, high, low, mcap, pe, eps, div, pv, p bv, ev sales, ev ebidta.
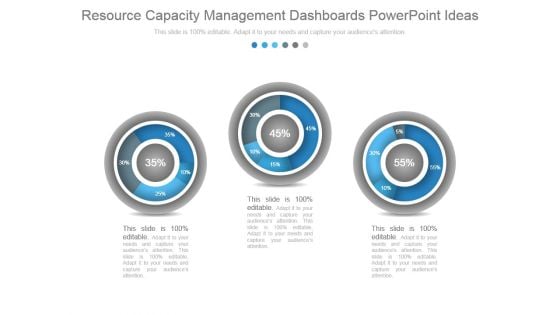
Resource Capacity Management Dashboards Powerpoint Ideas
This is a resource capacity management dashboards powerpoint ideas. This is a three stage process. The stages in this process are dashboard, percentage, measuring, business, marketing.
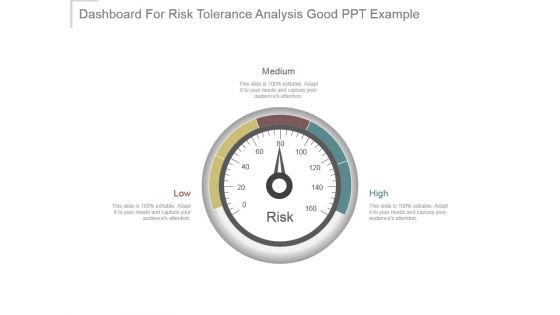
Dashboard For Risk Tolerance Analysis Good Ppt Example
This is a dashboard for risk tolerance analysis good ppt example. This is a three stage process. The stages in this process are low, medium, high, risk.
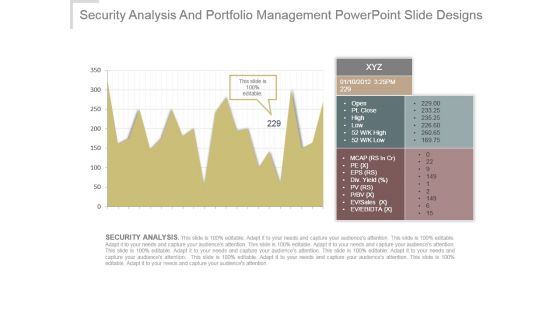
Security Analysis And Portfolio Management Powerpoint Slide Designs
This is a security analysis and portfolio management powerpoint slide designs. This is a one stage process. The stages in this process are xyz, open, pt close, high, low, mcap, pe, eps , div yield, pv, p bv, ev sales, ev ebitda, security analysis.
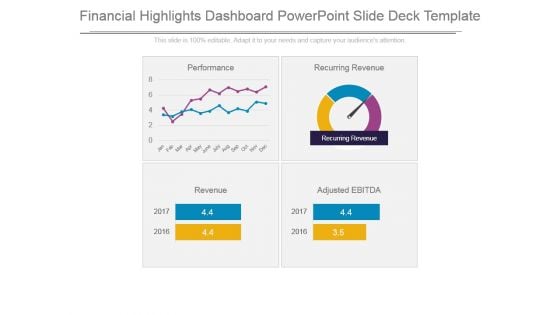
Financial Highlights Dashboard Powerpoint Slide Deck Template
This is a financial highlights dashboard powerpoint slide deck template. This is a four stage process. The stages in this process are recurring revenue, performance, revenue, adjusted ebitda.
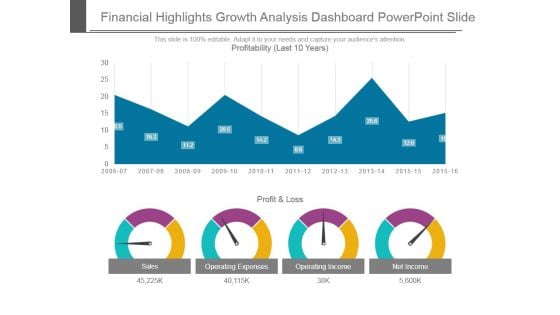
Financial Highlights Growth Analysis Dashboard Powerpoint Slide
This is a financial highlights growth analysis dashboard powerpoint slide. This is a four stage process. The stages in this process are profit and loss, sales, operating expenses, operating income, net income, profitability.
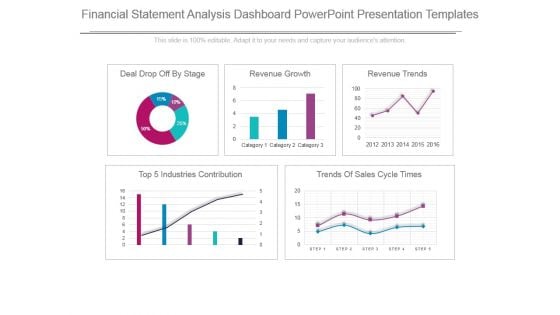
Financial Statement Analysis Dashboard Powerpoint Presentation Templates
This is a financial statement analysis dashboard powerpoint presentation templates. This is a five stage process. The stages in this process are deal drop off by stage, revenue growth, revenue trends, top 5 industries contribution, trends of sales cycle times, category.


 Continue with Email

 Home
Home


