Strength Icons
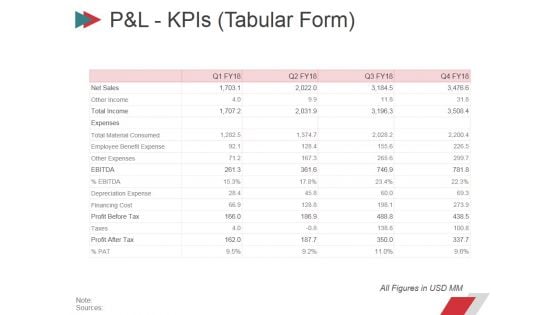
Pandl Kpis Tabular Form Ppt PowerPoint Presentation Summary Layout
This is a pandl kpis tabular form ppt powerpoint presentation summary layout. This is a four stage process. The stages in this process are revenue, cogs, operating profit, net profit.
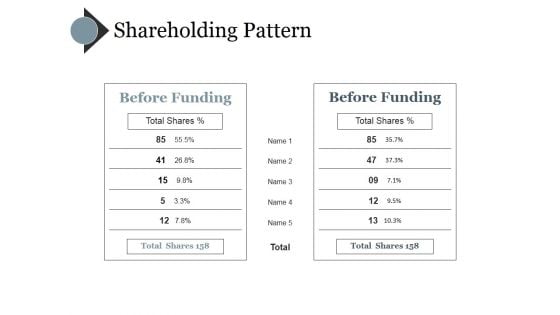
Shareholding Pattern Template Ppt PowerPoint Presentation Inspiration Demonstration
This is a shareholding pattern template ppt powerpoint presentation inspiration demonstration. This is a five stage process. The stages in this process are After funding, before funding.
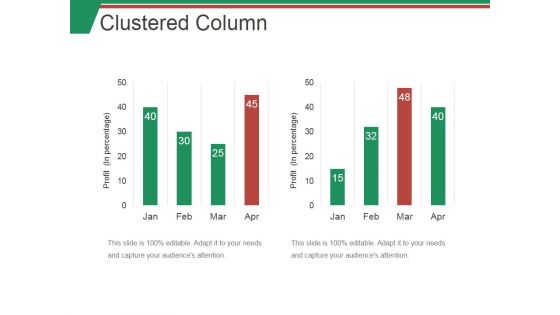
Clustered Column Ppt PowerPoint Presentation Summary Topics
This is a clustered column ppt powerpoint presentation summary topics. This is a two stage process. The stages in this process are bar, graph, finance, marketing, strategy.
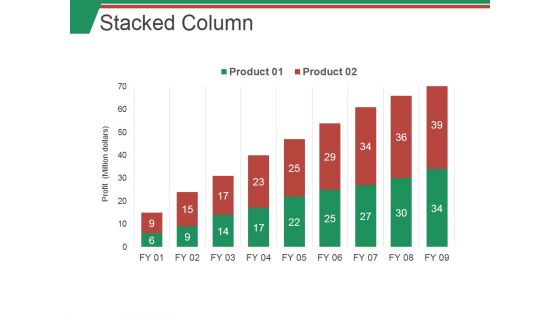
Stacked Column Ppt PowerPoint Presentation Infographic Template Graphics
This is a stacked column ppt powerpoint presentation infographic template graphics. This is a nine stage process. The stages in this process are business, marketing, finance, analysis, planning.
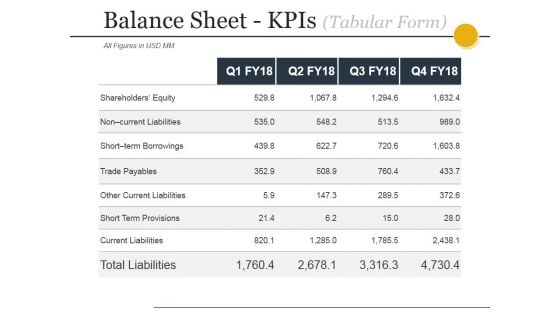
Balance Sheet Kpis Tabular Form Ppt PowerPoint Presentation Infographics Good
This is a balance sheet kpis tabular form ppt powerpoint presentation infographics good. This is a four stage process. The stages in this process are current assets, current liabilities, total assets, total liabilities.
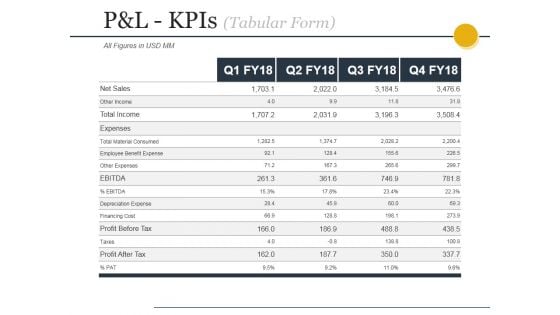
Pandl Kpis Tabular Form Ppt PowerPoint Presentation File Design Templates
This is a pandl kpis tabular form ppt powerpoint presentation file design templates. This is a four stage process. The stages in this process are revenue, cogs, operating profit, net profit.
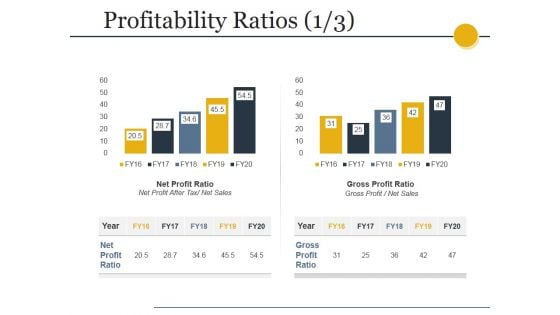
Profitability Ratios Template 1 Ppt PowerPoint Presentation Slides Inspiration
This is a profitability ratios template 1 ppt powerpoint presentation slides inspiration. This is a two stage process. The stages in this process are net profit ratio, net profit after tax net sales, gross profit ratio, gross profit net sales.
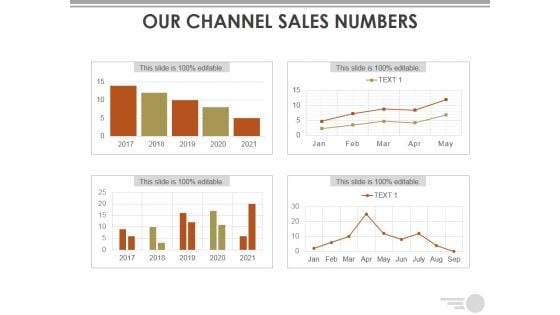
Our Channel Sales Numbers Ppt PowerPoint Presentation Styles Show
This is a our channel sales numbers ppt powerpoint presentation styles show. This is a four stage process. The stages in this process are business, marketing, planning, finance, strategy.
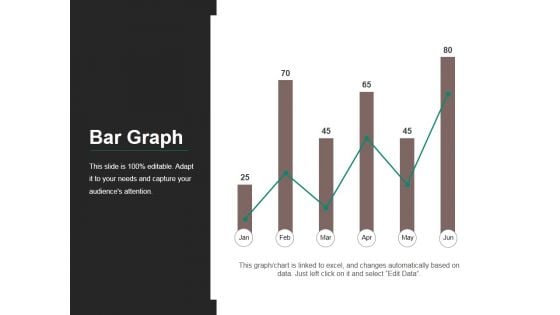
Bar Graph Ppt PowerPoint Presentation Slides Graphic Images
This is a bar graph ppt powerpoint presentation slides graphic images. This is a six stage process. The stages in this process are bar, finance, business, marketing, growth.
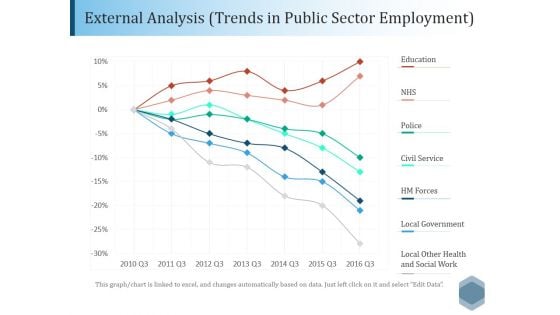
External Analysis Trends In Public Sector Employment Ppt PowerPoint Presentation File Outline
This is a external analysis trends in public sector employment ppt powerpoint presentation file outline. This is a seven stage process. The stages in this process are education, nhs, police, civil service, local government.
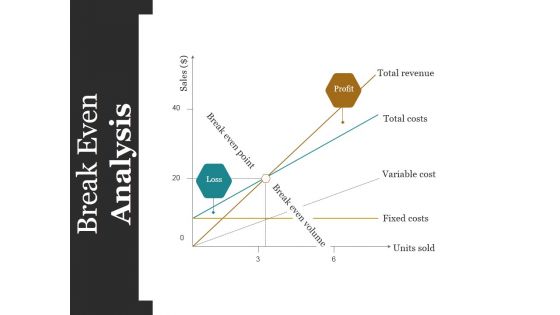
Break Even Analysis Ppt PowerPoint Presentation Inspiration Layouts
This is a break even analysis ppt powerpoint presentation inspiration layouts. This is a three stage process. The stages in this process are total revenue, total costs, variable cost, fixed costs, units sold.
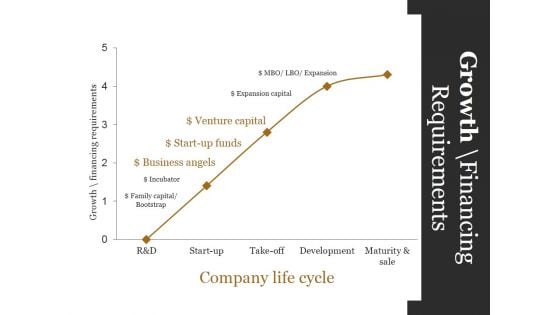
Growth Financing Requirements Ppt PowerPoint Presentation Gallery Ideas
This is a growth financing requirements ppt powerpoint presentation gallery ideas. This is a five stage process. The stages in this process are business angels, startup funds, venture capital, expansion capital, expansion.
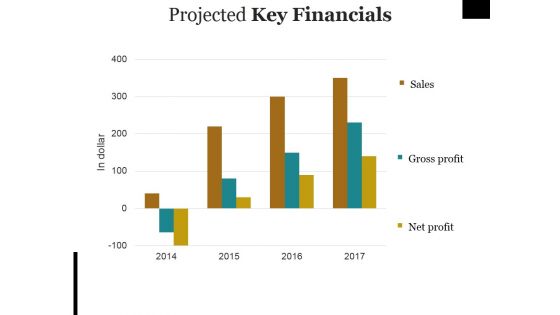
Projected Key Financials Ppt PowerPoint Presentation Pictures Objects
This is a projected key financials ppt powerpoint presentation pictures objects. This is a three stage process. The stages in this process are sales, gross profit, net profit.
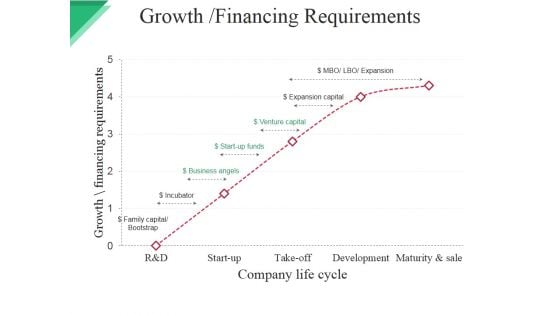
Growth Financing Requirements Ppt PowerPoint Presentation Pictures Slide Download
This is a growth financing requirements ppt powerpoint presentation pictures slide download. This is a five stage process. The stages in this process are development maturity and sale, company life cycle, growth, finance.
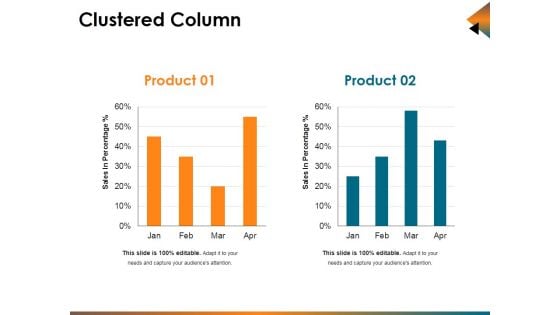
Clustered Column Ppt PowerPoint Presentation Infographic Template Background Designs
This is a clustered column ppt powerpoint presentation infographic template background designs. This is a two stage process. The stages in this process are sales in percentage, bar, business, marketing, planning.
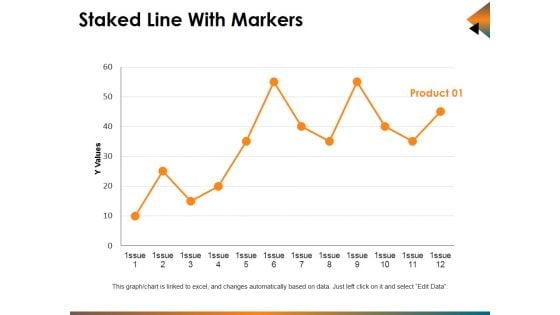
Staked Line With Markers Ppt PowerPoint Presentation Infographics Show
This is a staked line with markers ppt powerpoint presentation infographics show. This is a one stage process. The stages in this process are business, marketing, finance, line, analysis.
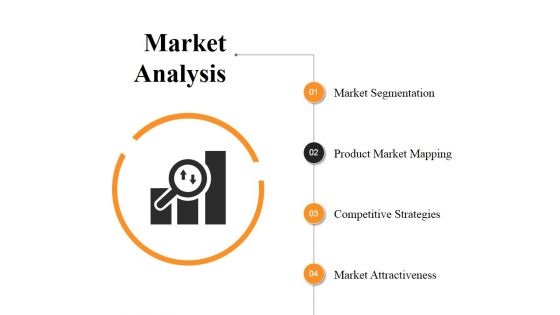
Market Analysis Ppt PowerPoint Presentation Show Design Inspiration
This is a market analysis ppt powerpoint presentation show design inspiration. This is a four stage process. The stages in this process are market segmentation, product market mapping, competitive strategies, market attractiveness.
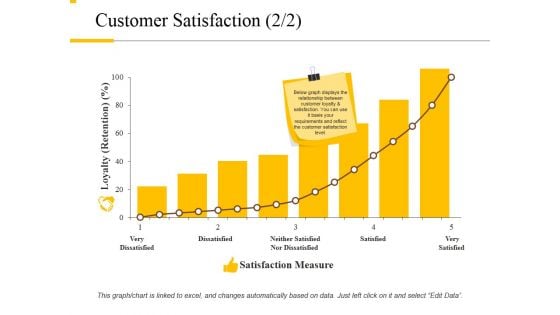
Customer Satisfaction Template 2 Ppt PowerPoint Presentation Professional Pictures
This is a customer satisfaction template 2 ppt powerpoint presentation professional pictures. This is a eight stage process. The stages in this process are loyalty, dissatisfied, satisfied, satisfaction measure, very satisfied.
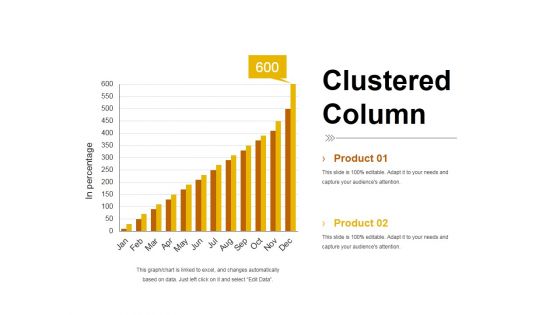
Clustered Column Template 2 Ppt PowerPoint Presentation Summary Smartart
This is a clustered column template 2 ppt powerpoint presentation summary smartart. This is a two stage process. The stages in this process are product, bar graph, in percentage, clustered column, growth.
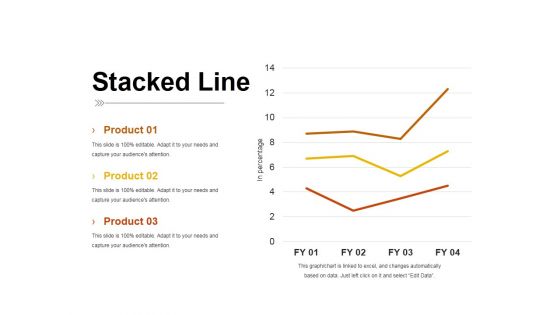
Stacked Line Ppt PowerPoint Presentation Inspiration Pictures
This is a stacked line ppt powerpoint presentation inspiration pictures. This is a three stage process. The stages in this process are product, stacked line, in percentage, business, growth.
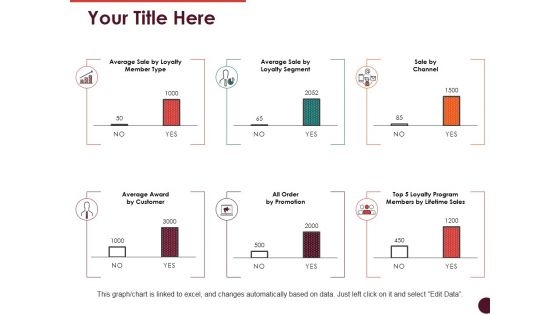
Your Title Here Ppt PowerPoint Presentation Show Good
This is a your title here ppt powerpoint presentation show good. This is a six stage process. The stages in this process are sale by channel, average award by customer, all order by promotion.
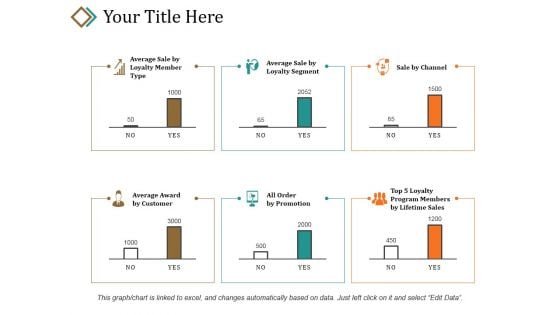
Your Title Here Ppt PowerPoint Presentation Layouts Introduction
This is a your title here ppt powerpoint presentation layouts introduction. This is a six stage process. The stages in this process are sale by channel, average award by customer, all order by promotion.
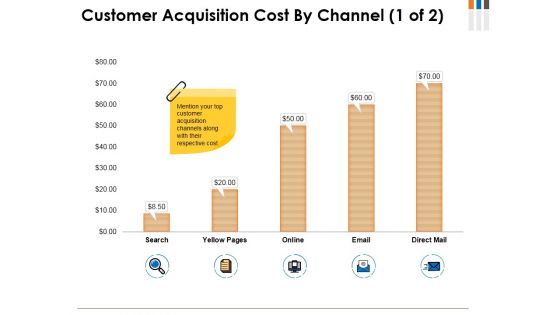
Customer Acquisition Cost By Channel Template 1 Ppt PowerPoint Presentation Model Inspiration
This is a customer acquisition cost by channel template 1 ppt powerpoint presentation model inspiration. This is a five stage process. The stages in this process are search, yellow pages, online, email, direct mail.
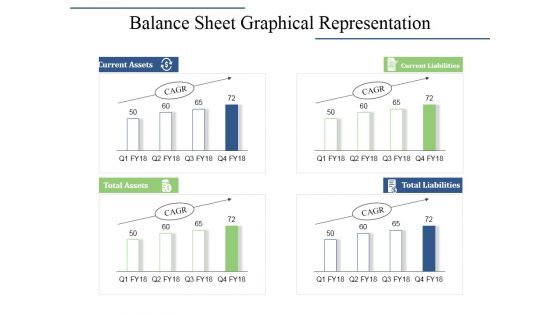
Balance Sheet Graphical Representation Ppt PowerPoint Presentation Inspiration Design Inspiration
This is a balance sheet graphical representation ppt powerpoint presentation inspiration design inspiration. This is a four stage process. The stages in this process are current assets, current liabilities, total assets, total liabilities.
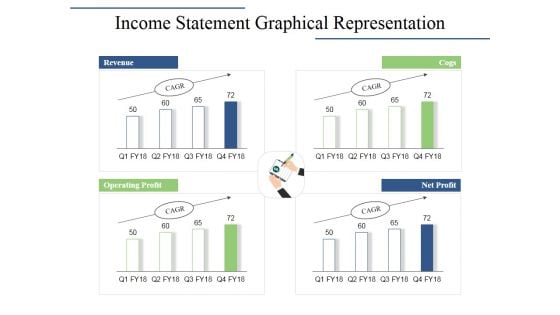
Income Statement Graphical Representation Ppt PowerPoint Presentation Infographics Layouts
This is a income statement graphical representation ppt powerpoint presentation infographics layouts. This is a four stage process. The stages in this process are revenue, cogs, operating profit, net profit.
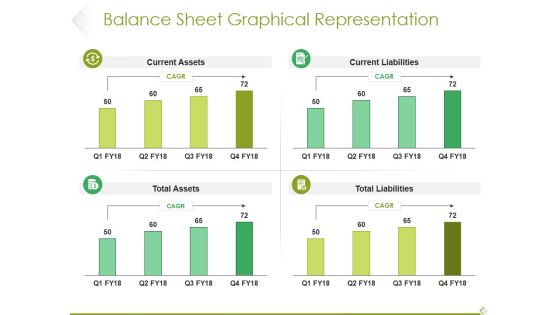
Balance Sheet Graphical Representation Ppt PowerPoint Presentation Outline Microsoft
This is a balance sheet graphical representation ppt powerpoint presentation outline microsoft. This is a four stage process. The stages in this process are current assets, current liabilities, total assets, total liabilities.
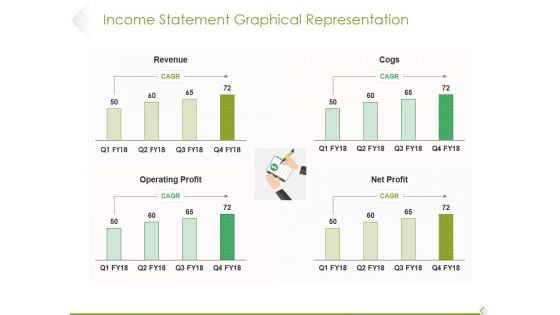
Income Statement Graphical Representation Ppt PowerPoint Presentation Infographic Template Influencers
This is a income statement graphical representation ppt powerpoint presentation infographic template influencers. This is a four stage process. The stages in this process are revenue, cogs, operating profit, profit.
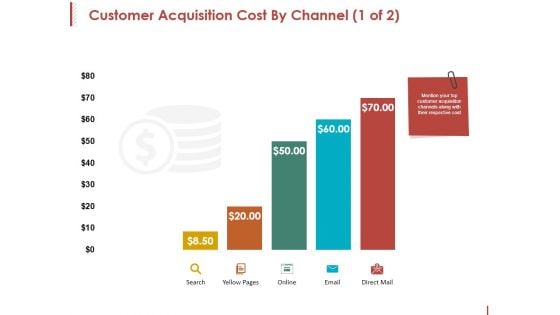
Customer Acquisition Cost By Channel Template 1 Ppt PowerPoint Presentation File Aids
This is a customer acquisition cost by channel template 1 ppt powerpoint presentation file aids. This is a five stage process. The stages in this process are search, yellow pages, online, email, direct mail.
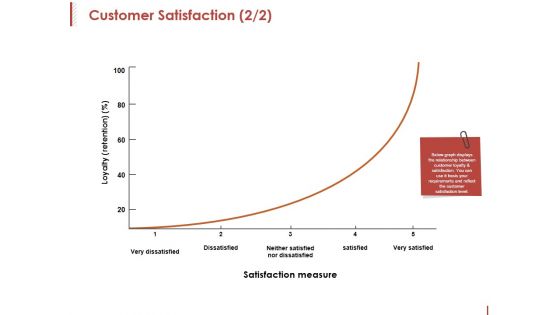
Customer Satisfaction Template 2 Ppt PowerPoint Presentation Slides Ideas
This is a customer satisfaction template 2 ppt powerpoint presentation slides ideas. This is a one stage process. The stages in this process are loyalty, satisfaction measure, dissatisfied, satisfied, very satisfied.
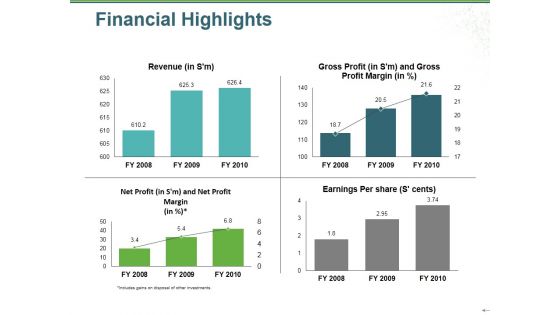
Financial Highlights Ppt PowerPoint Presentation Gallery Graphics Example
This is a financial highlights ppt powerpoint presentation gallery graphics example. This is a four stage process. The stages in this process are revenue, gross profit, net profit, earnings per share, bar graph.
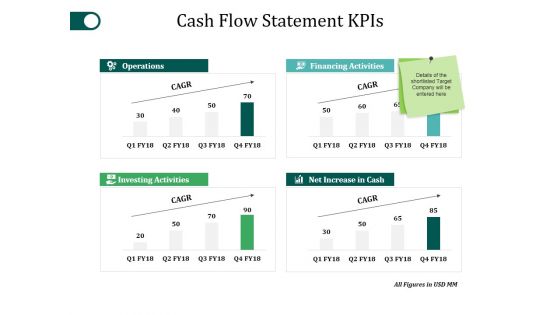
Cash Flow Statement Kpis Template 2 Ppt PowerPoint Presentation Summary Guidelines
This is a cash flow statement kpis template 2 ppt powerpoint presentation summary guidelines. This is a four stage process. The stages in this process are operations, investing activities, net increase in cash, financing activities.
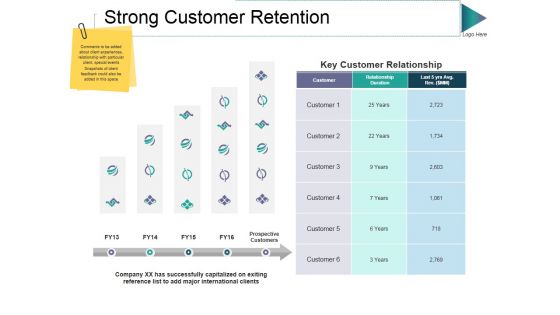
Strong Customer Retention Ppt PowerPoint Presentation Show Guide
This is a strong customer retention ppt powerpoint presentation show guide. This is a two stage process. The stages in this process are prospective customers, relationship duration, key customer relationship, prospective customers, customer.
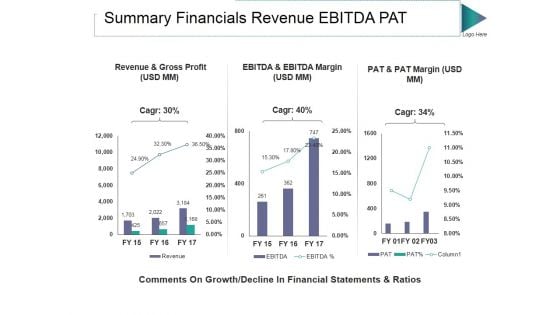
Summary Financials Revenue Ebitda Pat Ppt PowerPoint Presentation Visuals
This is a summary financials revenue ebitda pat ppt powerpoint presentation visuals. This is a three stage process. The stages in this process are revenue and gross profit, pat and pat margin, ebitda and ebitda margin.
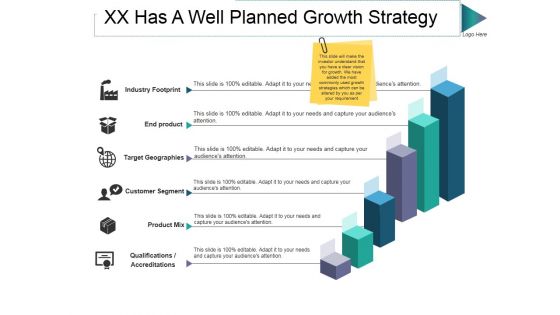
Xx Has A Well Planned Growth Strategy Ppt PowerPoint Presentation Slides Visual Aids
This is a xx has a well planned growth strategy ppt powerpoint presentation slides visual aids. This is a six stage process. The stages in this process are end product, target geographies, customer segment, product mix, industry footprint.
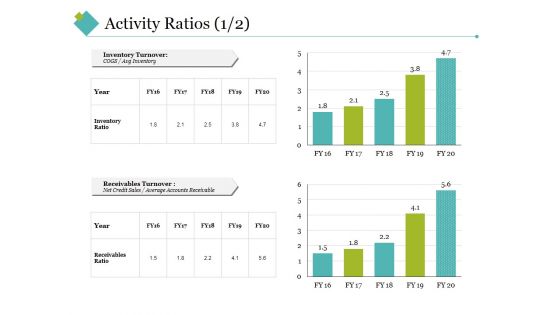
Activity Ratios Template 2 Ppt PowerPoint Presentation Show Images
This is a activity ratios template 2 ppt powerpoint presentation show images. This is a two stage process. The stages in this process are inventory turnover, receivables turnover, inventory ratio, receivables ratio, year.
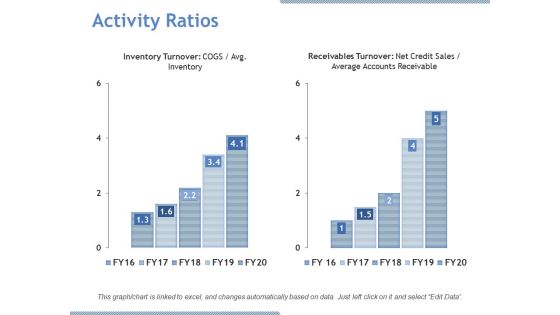
Activity Ratios Ppt PowerPoint Presentation Gallery Microsoft
This is a activity ratios ppt powerpoint presentation gallery microsoft. This is a two stage process. The stages in this process are inventory turnover, receivables turnover, net credit sales, average accounts receivable.
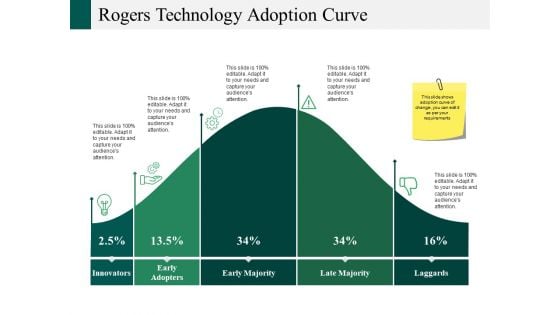
Rogers Technology Adoption Curve Ppt PowerPoint Presentation Portfolio Elements
This is a rogers technology adoption curve ppt powerpoint presentation portfolio elements. This is a five stage process. The stages in this process are innovators, early majority, majority, laggards, early adopters.
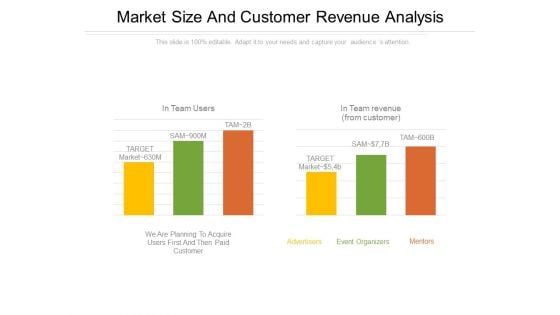
Market Size And Customer Revenue Analysis PowerPoint Presentation Examples
This is a market size and customer revenue analysis powerpoint presentation examples. This is a two stage process. The stages in this process are advertisers, mentors, event organizers, target, in team users.
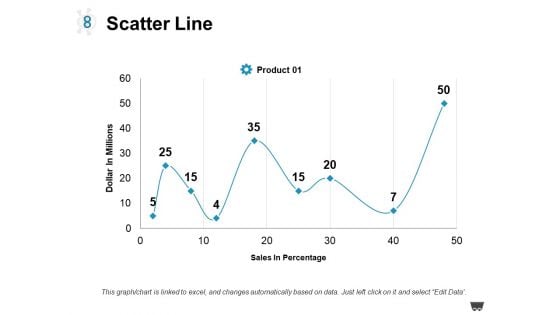
Scatter Line Ppt PowerPoint Presentation Styles Graphics Pictures
This is a scatter line ppt powerpoint presentation styles graphics pictures. This is a one stage process. The stages in this process are product, dollar in millions, sales in percentage.
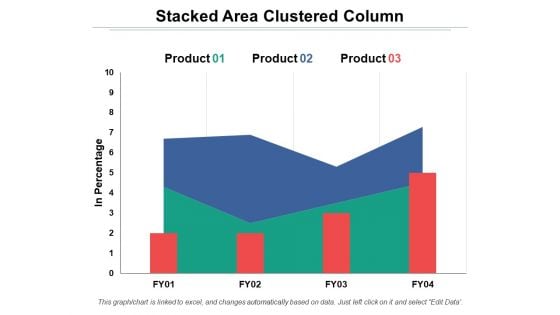
Stacked Area Clustered Column Ppt PowerPoint Presentation Professional Influencers
This is a stacked area clustered column ppt powerpoint presentation professional influencers. This is a three stage process. The stages in this process are stacked area clustered column, percentage, product, year.
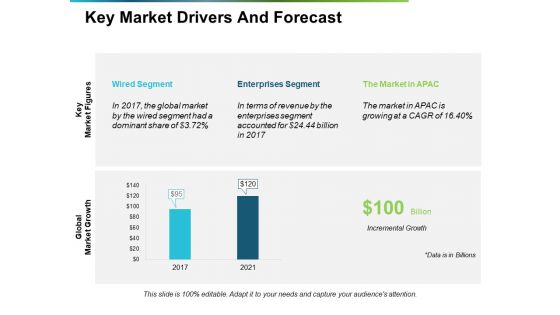
Key Market Drivers And Forecast Ppt PowerPoint Presentation Summary Templates
This is a key market drivers and forecast ppt powerpoint presentation summary templates. This is a two stage process. The stages in this process are key market drivers, forecast, growth, bar graph, business.
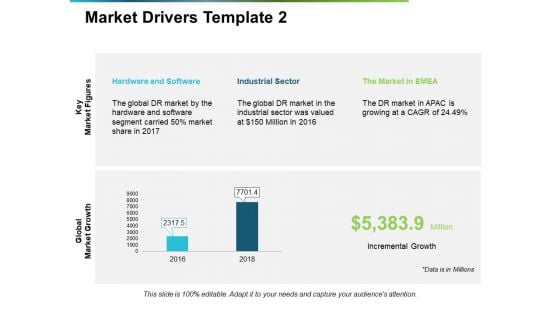
Market Drivers Hardware And Software Ppt PowerPoint Presentation Inspiration Graphics Design
This is a market drivers hardware and software ppt powerpoint presentation inspiration graphics design. This is a two stage process. The stages in this process are key market drivers, forecast, growth, bar graph, business.
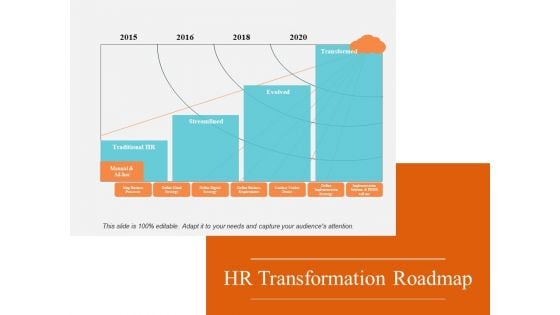
HR Transformation Roadmap Ppt PowerPoint Presentation Portfolio Example
This is a hr transformation roadmap ppt powerpoint presentation portfolio example. This is a four stage process. The stages in this process are traditional, streamlined, evolved, transformed, growth.
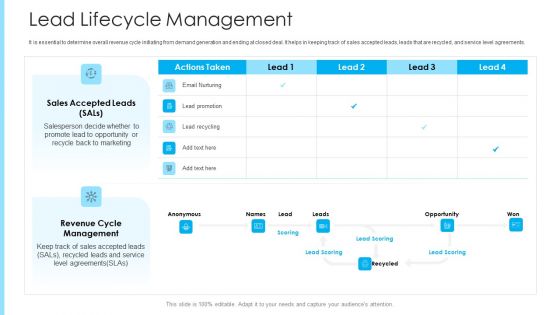
How To Build A Revenue Funnel Lead Lifecycle Management Diagrams PDF
It is essential to determine overall revenue cycle initiating from demand generation and ending at closed deal. It helps in keeping track of sales accepted leads, leads that are recycled, and service level agreements. Deliver and pitch your topic in the best possible manner with this how to build a revenue funnel lead lifecycle management diagrams pdf. Use them to share invaluable insights on opportunity, management, revenue, sales and impress your audience. This template can be altered and modified as per your expectations. So, grab it now.
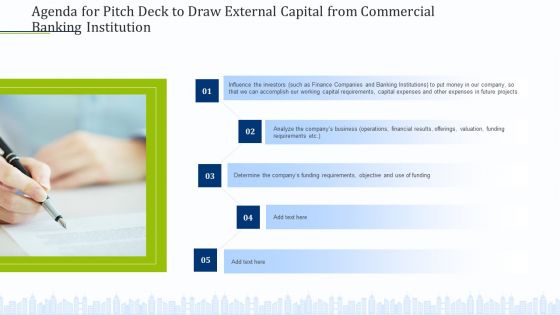
Agenda For Pitch Deck To Draw External Capital From Commercial Banking Institution Diagrams PDF
This is a agenda for pitch deck to draw external capital from commercial banking institution diagrams pdf template with various stages. Focus and dispense information on five stages using this creative set, that comes with editable features. It contains large content boxes to add your information on topics like determine the companys funding requirements objective and use of funding, requirements, analyze the companys business operations, financial results, offerings, valuation, funding requirements etc. You can also showcase facts, figures, and other relevant content using this PPT layout. Grab it now.
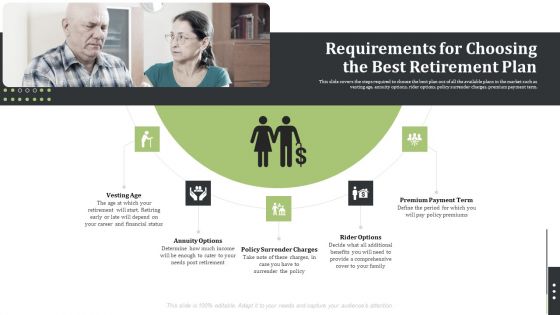
Pension Alimony Requirements For Choosing The Best Retirement Plan Diagrams PDF
This slide covers the steps required to choose the best plan out of all the available plans in the market such as vesting age, annuity options, rider options, policy surrender charges, premium payment term. This is a pension alimony requirements for choosing the best retirement plan diagrams pdf template with various stages. Focus and dispense information on five stages using this creative set, that comes with editable features. It contains large content boxes to add your information on topics like financial, retirement, determine, benefits, premiums. You can also showcase facts, figures, and other relevant content using this PPT layout. Grab it now.
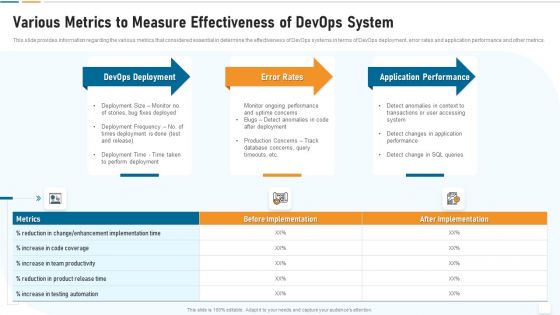
Strategic Development And Operations Execution IT Various Metrics To Measure Diagrams PDF
This slide provides information regarding the various metrics that considered essential in determine the effectiveness of DevOps systems in terms of DevOps deployment, error rates and application performance and other metrics. This is a strategic development and operations execution it various metrics to measure diagrams pdf template with various stages. Focus and dispense information on three stages using this creative set, that comes with editable features. It contains large content boxes to add your information on topics like devops deployment, error rates, application performance. You can also showcase facts, figures, and other relevant content using this PPT layout. Grab it now.
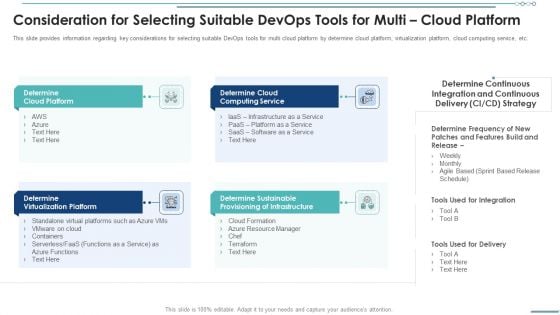
Consideration For Selecting Suitable Devops Tools For Multi Cloud Platform Diagrams PDF
This slide provides information regarding key considerations for selecting suitable DevOps tools for multi cloud platform by determine cloud platform, virtualization platform, cloud computing service, etc. Presenting consideration for selecting suitable devops tools for multi cloud platform diagrams pdf to provide visual cues and insights. Share and navigate important information on four stages that need your due attention. This template can be used to pitch topics like cloud platform, virtualization, infrastructure. In addtion, this PPT design contains high resolution images, graphics, etc, that are easily editable and available for immediate download.
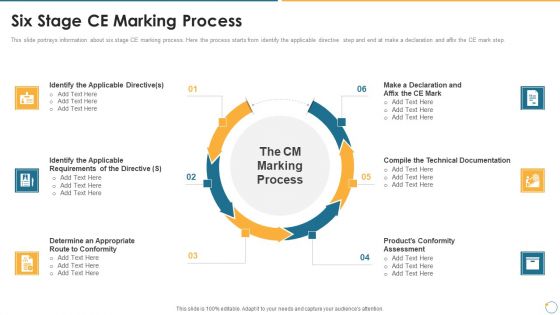
Collection Of Quality Assurance PPT Six Stage CE Marking Process Diagrams PDF
This slide portrays information about six stage CE marking process. Here the process starts from identify the applicable directive step and end at make a declaration and affix the CE mark step. Presenting collection of quality assurance ppt six stage ce marking process diagrams pdf to provide visual cues and insights. Share and navigate important information on six stages that need your due attention. This template can be used to pitch topics like determine, requirements, applicable directive, products conformity. In addtion, this PPT design contains high resolution images, graphics, etc, that are easily editable and available for immediate download.
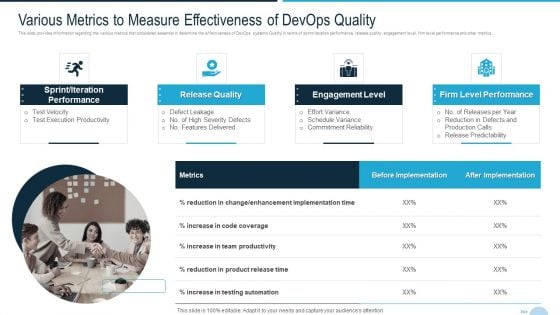
Development And Operations Quality Assurance And Validation IT Various Metrics To Measure Diagrams PDF
This slide provides information regarding the various metrics that considered essential in determine the effectiveness of DevOps systems Quality in terms of sprint or iteration performance, release quality, engagement level, firm level performance and other metrics. Presenting development and operations quality assurance and validation it various metrics to measure diagrams pdf to provide visual cues and insights. Share and navigate important information on four stages that need your due attention. This template can be used to pitch topics like engagement level, firm level performance, release quality In addtion, this PPT design contains high resolution images, graphics, etc, that are easily editable and available for immediate download.
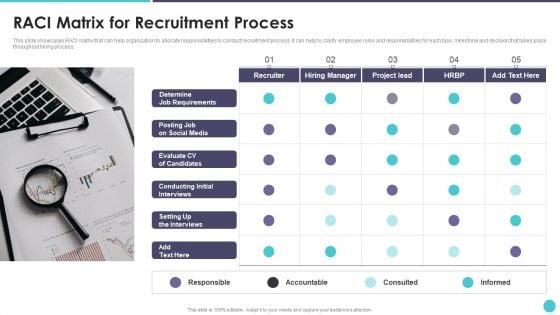
Action Plan To Optimize Hiring Process RACI Matrix For Recruitment Process Diagrams PDF
This slide showcases RACI matrix that can help organization to allocate responsibilities to conduct recruitment process. It can help to clarify employee roles and responsibilities for each task, milestone and decision that takes place throughout hiring process.This is a Action Plan To Optimize Hiring Process RACI Matrix For Recruitment Process Diagrams PDF template with various stages. Focus and dispense information on one stage using this creative set, that comes with editable features. It contains large content boxes to add your information on topics like Determine, Job Requirements, Conducting Initial Interviews You can also showcase facts, figures, and other relevant content using this PPT layout. Grab it now.
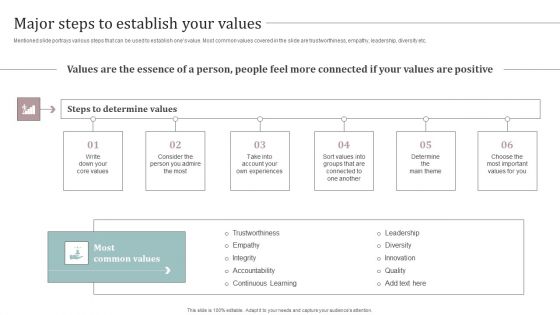
Major Steps To Establish Your Values Ultimate Guide To Develop Personal Branding Strategy Diagrams PDF
Mentioned slide portrays various steps that can be used to establish ones value. Most common values covered in the slide are trustworthiness, empathy, leadership, diversity etc. Presenting Major Steps To Establish Your Values Ultimate Guide To Develop Personal Branding Strategy Diagrams PDF to provide visual cues and insights. Share and navigate important information on six stages that need your due attention. This template can be used to pitch topics like Determine Values, Common Values, Values Are Positive. In addtion, this PPT design contains high resolution images, graphics, etc, that are easily editable and available for immediate download.
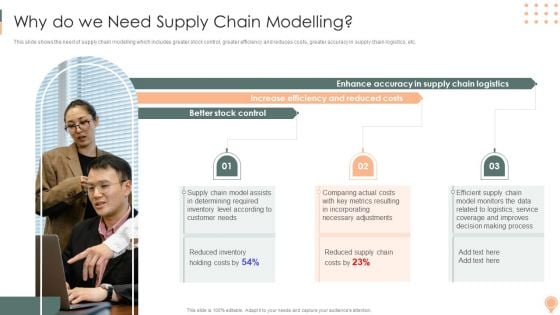
Supply Chain Approaches Why Do We Needsupply Chain Modelling Diagrams PDF
This slide shows the need of supply chain modelling which includes greater stock control, greater efficiency and reduces costs, greater accuracy in supply chain logistics, etc.Presenting Supply Chain Approaches Why Do We Needsupply Chain Modelling Diagrams PDF to provide visual cues and insights. Share and navigate important information on three stages that need your due attention. This template can be used to pitch topics like Determining Require, Inventory Level According, Metrics Resulting. In addtion, this PPT design contains high resolution images, graphics, etc, that are easily editable and available for immediate download.
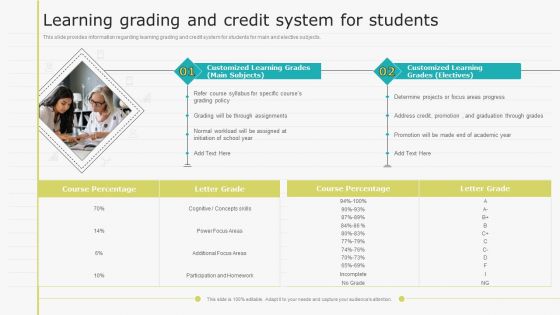
Virtual Learning Playbook Learning Grading And Credit System For Students Diagrams PDF
This slide provides information regarding learning grading and credit system for students for main and elective subjects. This is a Virtual Learning Playbook Learning Grading And Credit System For Students Diagrams PDF template with various stages. Focus and dispense information on two stages using this creative set, that comes with editable features. It contains large content boxes to add your information on topics like Determine Projects, Learning Grading, Credit System. You can also showcase facts, figures, and other relevant content using this PPT layout. Grab it now.
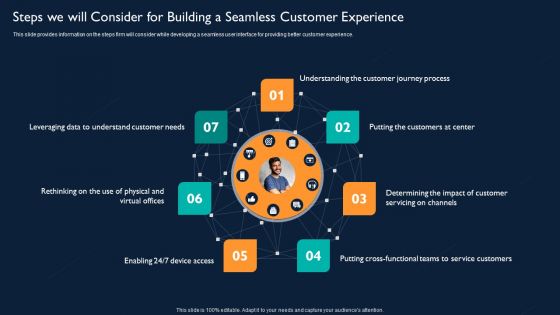
Steps We Will Consider For Building A Seamless Customer Experience Diagrams PDF
This slide provides information on the steps firm will consider while developing a seamless user interface for providing better customer experience. This is a Steps We Will Consider For Building A Seamless Customer Experience Diagrams PDF template with various stages. Focus and dispense information on seven stages using this creative set, that comes with editable features. It contains large content boxes to add your information on topics like Customer Journey Process, Determining, Service Customers. You can also showcase facts, figures, and other relevant content using this PPT layout. Grab it now.
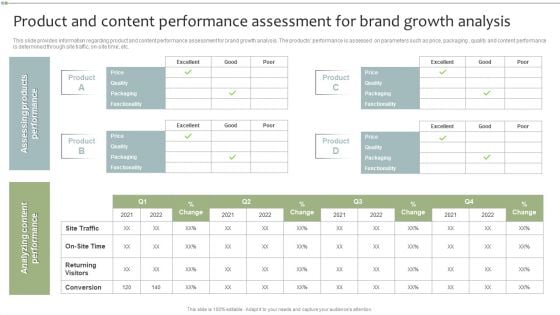
Brand Maintenance Toolkit Product And Content Performance Assessment For Brand Growth Analysis Diagrams PDF
This slide provides information regarding product and content performance assessment for brand growth analysis. The products performance is assessed on parameters such as price, packaging , quality and content performance is determined through site traffic, on site time, etc. Deliver and pitch your topic in the best possible manner with this Brand Maintenance Toolkit Product And Content Performance Assessment For Brand Growth Analysis Diagrams PDF. Use them to share invaluable insights on Quality, Price, Product and impress your audience. This template can be altered and modified as per your expectations. So, grab it now.
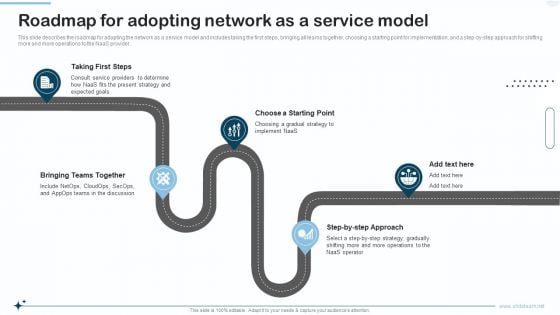
Naas Integrated Solution IT Roadmap For Adopting Network As A Service Model Diagrams PDF
This slide describes the roadmap for adopting the network as a service model and includes taking the first steps, bringing all teams together, choosing a starting point for implementation, and a step by step approach for shifting more and more operations to the NaaS provider. Presenting Naas Integrated Solution IT Roadmap For Adopting Network As A Service Model Diagrams PDF to provide visual cues and insights. Share and navigate important information on five stages that need your due attention. This template can be used to pitch topics like Strategy, Determine, Teams. In addtion, this PPT design contains high resolution images, graphics, etc, that are easily editable and available for immediate download.
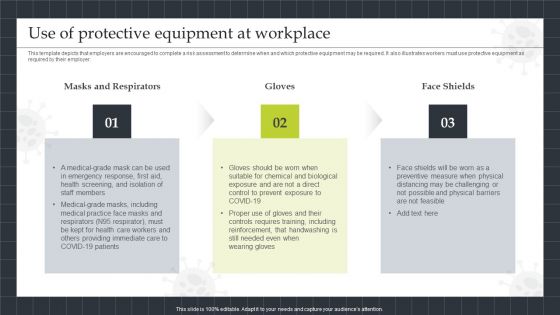
Strategic Playbook Sustaining Business During Pandemic Use Of Protective Equipment Diagrams PDF
This template depicts that employers are encouraged to complete a risk assessment to determine when and which protective equipment may be required. It also illustrates workers must use protective equipment as required by their employer. Presenting Strategic Playbook Sustaining Business During Pandemic Use Of Protective Equipment Diagrams PDF to provide visual cues and insights. Share and navigate important information on three stages that need your due attention. This template can be used to pitch topics like Masks And Respirators, Gloves, Face Shields. In addtion, this PPT design contains high resolution images, graphics, etc, that are easily editable and available for immediate download.
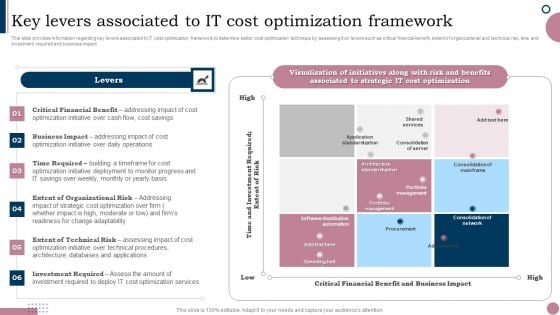
Cios Guide To Optimize Key Levers Associated To IT Cost Optimization Framework Diagrams PDF
This slide provides information regarding key levers associated to IT cost optimization framework to determine better cost optimization technique by assessing it on levers such as critical financial benefit, extent of organizational and technical risk, time and investment required and business impact. The best PPT templates are a great way to save time, energy, and resources. Slidegeeks have 100 percent editable powerpoint slides making them incredibly versatile. With these quality presentation templates, you can create a captivating and memorable presentation by combining visually appealing slides and effectively communicating your message. Download Cios Guide To Optimize Key Levers Associated To IT Cost Optimization Framework Diagrams PDF from Slidegeeks and deliver a wonderful presentation.
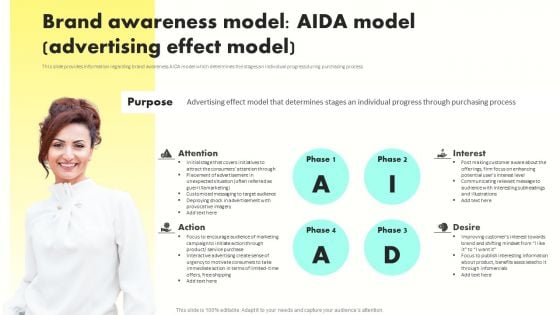
Developing Brand Awareness To Gain Customer Attention Brand Awareness Model AIDA Model Diagrams PDF
This slide provides information regarding brand awareness AIDA model which determines the stages an individual progress during purchasing process. Present like a pro with Developing Brand Awareness To Gain Customer Attention Brand Awareness Model AIDA Model Diagrams PDF Create beautiful presentations together with your team, using our easy-to-use presentation slides. Share your ideas in real-time and make changes on the fly by downloading our templates. So whether you are in the office, on the go, or in a remote location, you can stay in sync with your team and present your ideas with confidence. With Slidegeeks presentation got a whole lot easier. Grab these presentations today.

 Home
Home