Strength Icons
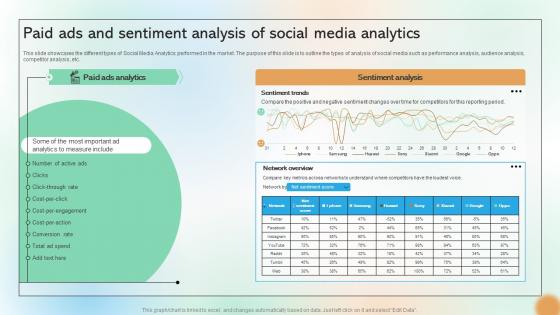
Paid Ads And Sentiment Analysis Of Social Media Analytics Cracking The Code Of Social Media
This slide showcases the different types of Social Media Analytics performed in the market. The purpose of this slide is to outline the types of analysis of social media such as performance analysis, audience analysis, competitor analysis, etc. Do you have to make sure that everyone on your team knows about any specific topic I yes, then you should give Paid Ads And Sentiment Analysis Of Social Media Analytics Cracking The Code Of Social Media a try. Our experts have put a lot of knowledge and effort into creating this impeccable Paid Ads And Sentiment Analysis Of Social Media Analytics Cracking The Code Of Social Media. You can use this template for your upcoming presentations, as the slides are perfect to represent even the tiniest detail. You can download these templates from the Slidegeeks website and these are easy to edit. So grab these today This slide showcases the different types of Social Media Analytics performed in the market. The purpose of this slide is to outline the types of analysis of social media such as performance analysis, audience analysis, competitor analysis, etc.

Industry Wise Market Segmentation Of SWG Web Threat Protection System
This slide demonstrates the contribution of different industries in growth of Secure Web Gateway market. The purpose of this slide is to represent the industry wise market share of different sectors such as BFSI, IT and telecom, retail and e-Commerce, etc. Formulating a presentation can take up a lot of effort and time, so the content and message should always be the primary focus. The visuals of the PowerPoint can enhance the presenters message, so our Industry Wise Market Segmentation Of SWG Web Threat Protection System was created to help save time. Instead of worrying about the design, the presenter can concentrate on the message while our designers work on creating the ideal templates for whatever situation is needed. Slidegeeks has experts for everything from amazing designs to valuable content, we have put everything into Industry Wise Market Segmentation Of SWG Web Threat Protection System This slide demonstrates the contribution of different industries in growth of Secure Web Gateway market. The purpose of this slide is to represent the industry wise market share of different sectors such as BFSI, IT and telecom, retail and e-Commerce, etc.
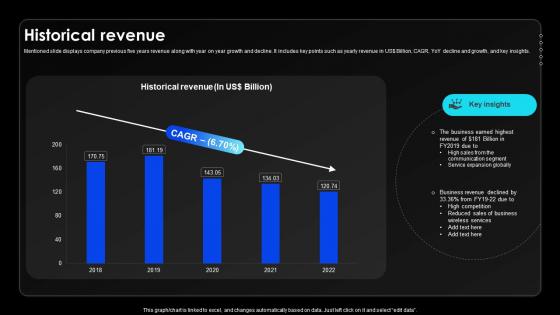
Historical Revenue Wireless Communication Services Provider Company Profile CP SS V
Mentioned slide displays company previous five years revenue along with year on year growth and decline. It includes key points such as yearly revenue in US dollar Billion, CAGR, YoY decline and growth, and key insights.Formulating a presentation can take up a lot of effort and time, so the content and message should always be the primary focus. The visuals of the PowerPoint can enhance the presenters message, so our Historical Revenue Wireless Communication Services Provider Company Profile CP SS V was created to help save time. Instead of worrying about the design, the presenter can concentrate on the message while our designers work on creating the ideal templates for whatever situation is needed. Slidegeeks has experts for everything from amazing designs to valuable content, we have put everything into Historical Revenue Wireless Communication Services Provider Company Profile CP SS V. Mentioned slide displays company previous five years revenue along with year on year growth and decline. It includes key points such as yearly revenue in US dollar Billion, CAGR, YoY decline and growth, and key insights.
Cyber Phishing Attacks Tracking Dashboard Man In The Middle Phishing IT
This slide represents the dashboard to track cyber phishing attacks. The purpose of this slide is to provide a graphical representation of cyber attacks occurred in a specific time span. It also depicts the organizations health risk. Formulating a presentation can take up a lot of effort and time, so the content and message should always be the primary focus. The visuals of the PowerPoint can enhance the presenters message, so our Cyber Phishing Attacks Tracking Dashboard Man In The Middle Phishing IT was created to help save time. Instead of worrying about the design, the presenter can concentrate on the message while our designers work on creating the ideal templates for whatever situation is needed. Slidegeeks has experts for everything from amazing designs to valuable content, we have put everything into Cyber Phishing Attacks Tracking Dashboard Man In The Middle Phishing IT This slide represents the dashboard to track cyber phishing attacks. The purpose of this slide is to provide a graphical representation of cyber attacks occurred in a specific time span. It also depicts the organizations health risk.
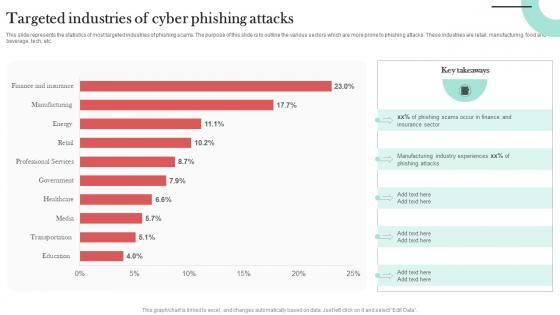
Targeted Industries Of Cyber Phishing Man In The Middle Phishing IT
This slide represents the statistics of most targeted industries of phishing scams. The purpose of this slide is to outline the various sectors which are more prone to phishing attacks. These industries are retail, manufacturing, food and beverage, tech, etc. Coming up with a presentation necessitates that the majority of the effort goes into the content and the message you intend to convey. The visuals of a PowerPoint presentation can only be effective if it supplements and supports the story that is being told. Keeping this in mind our experts created Targeted Industries Of Cyber Phishing Man In The Middle Phishing IT to reduce the time that goes into designing the presentation. This way, you can concentrate on the message while our designers take care of providing you with the right template for the situation. This slide represents the statistics of most targeted industries of phishing scams. The purpose of this slide is to outline the various sectors which are more prone to phishing attacks. These industries are retail, manufacturing, food and beverage, tech, etc.
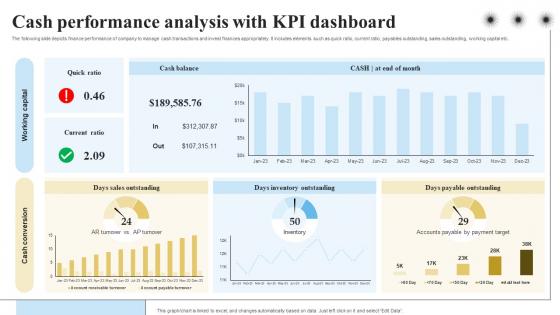
Cash Performance Analysis With KPI Dashboard Objectives And Key Result Methodology For Business
The following slide depicts finance performance of company to manage cash transactions and invest finances appropriately. It includes elements such as quick ratio, current ratio, payables outstanding, sales outstanding, working capital etc. Do you have to make sure that everyone on your team knows about any specific topic I yes, then you should give Cash Performance Analysis With KPI Dashboard Objectives And Key Result Methodology For Business a try. Our experts have put a lot of knowledge and effort into creating this impeccable Cash Performance Analysis With KPI Dashboard Objectives And Key Result Methodology For Business. You can use this template for your upcoming presentations, as the slides are perfect to represent even the tiniest detail. You can download these templates from the Slidegeeks website and these are easy to edit. So grab these today The following slide depicts finance performance of company to manage cash transactions and invest finances appropriately. It includes elements such as quick ratio, current ratio, payables outstanding, sales outstanding, working capital etc.
Loreal SA Company Profile Makeup And Skincare Market IR SS V
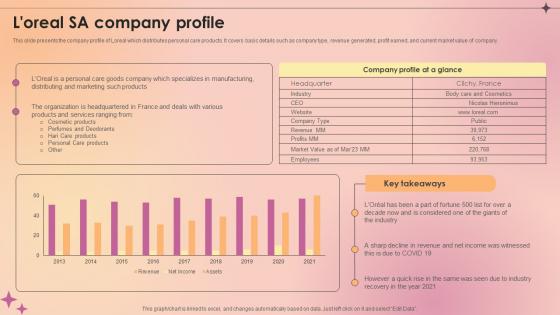
This slide presents the company profile of Loreal which distributes personal care products. It covers basic details such as company type, revenue generated, profit earned, and current market value of company. Formulating a presentation can take up a lot of effort and time, so the content and message should always be the primary focus. The visuals of the PowerPoint can enhance the presenters message, so our Loreal SA Company Profile Makeup And Skincare Market IR SS V was created to help save time. Instead of worrying about the design, the presenter can concentrate on the message while our designers work on creating the ideal templates for whatever situation is needed. Slidegeeks has experts for everything from amazing designs to valuable content, we have put everything into Loreal SA Company Profile Makeup And Skincare Market IR SS V. This slide presents the company profile of Loreal which distributes personal care products. It covers basic details such as company type, revenue generated, profit earned, and current market value of company.

North America Beauty And Personal Care Industry Makeup And Skincare Market IR SS V
This slide presents the North American market size of beauty and personal care products. It highlights key market players, major product segment, import value of beauty and personal care products, millennials and gen Z beauty and personal care products preferences. Coming up with a presentation necessitates that the majority of the effort goes into the content and the message you intend to convey. The visuals of a PowerPoint presentation can only be effective if it supplements and supports the story that is being told. Keeping this in mind our experts created North America Beauty And Personal Care Industry Makeup And Skincare Market IR SS V to reduce the time that goes into designing the presentation. This way, you can concentrate on the message while our designers take care of providing you with the right template for the situation. This slide presents the North American market size of beauty and personal care products. It highlights key market players, major product segment, import value of beauty and personal care products, millennials and gen Z beauty and personal care products preferences.

Revenue Streams Task Management System Investor Funding Elevator Pitch Deck
This slide covers various sources of revenue for the company. The purpose of this template is to provide an overview of stakeholders, investors, or potential partners with a comprehensive understanding of revenue sources such as indirect sources, product subscription, licensing content to third parties, etc. Coming up with a presentation necessitates that the majority of the effort goes into the content and the message you intend to convey. The visuals of a PowerPoint presentation can only be effective if it supplements and supports the story that is being told. Keeping this in mind our experts created Revenue Streams Task Management System Investor Funding Elevator Pitch Deck to reduce the time that goes into designing the presentation. This way, you can concentrate on the message while our designers take care of providing you with the right template for the situation. This slide covers various sources of revenue for the company. The purpose of this template is to provide an overview of stakeholders, investors, or potential partners with a comprehensive understanding of revenue sources such as indirect sources, product subscription, licensing content to third parties, etc.

Create A Restaurant Marketing Organizational Structure Of Restaurant
The following slide showcases the divisional structure of the restaurant marketing team. The key stakeholders mentioned in the slide are the marketing president, secretary, product manager, advertising director, public relations PR manager, market research director, promotion director, and creative services. Coming up with a presentation necessitates that the majority of the effort goes into the content and the message you intend to convey. The visuals of a PowerPoint presentation can only be effective if it supplements and supports the story that is being told. Keeping this in mind our experts created Create A Restaurant Marketing Organizational Structure Of Restaurant to reduce the time that goes into designing the presentation. This way, you can concentrate on the message while our designers take care of providing you with the right template for the situation. The following slide showcases the divisional structure of the restaurant marketing team. The key stakeholders mentioned in the slide are the marketing president, secretary, product manager, advertising director, public relations PR manager, market research director, promotion director, and creative services.
Manual Testing Performance Monitoring Dashboard Gray Box Testing Best Practices
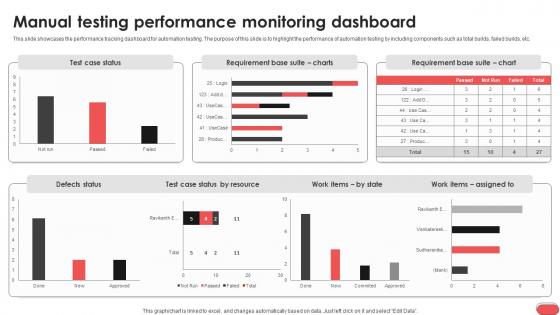
This slide showcases the performance tracking dashboard for automation testing. The purpose of this slide is to highlight the performance of automation testing by including components such as total builds, failed builds, etc. Formulating a presentation can take up a lot of effort and time, so the content and message should always be the primary focus. The visuals of the PowerPoint can enhance the presenters message, so our Manual Testing Performance Monitoring Dashboard Gray Box Testing Best Practices was created to help save time. Instead of worrying about the design, the presenter can concentrate on the message while our designers work on creating the ideal templates for whatever situation is needed. Slidegeeks has experts for everything from amazing designs to valuable content, we have put everything into Manual Testing Performance Monitoring Dashboard Gray Box Testing Best Practices This slide showcases the performance tracking dashboard for automation testing. The purpose of this slide is to highlight the performance of automation testing by including components such as total builds, failed builds, etc.
Impact Of Poor Digital Content Marketing Strategies Comprehensive Guide To Implement Strategy SS V
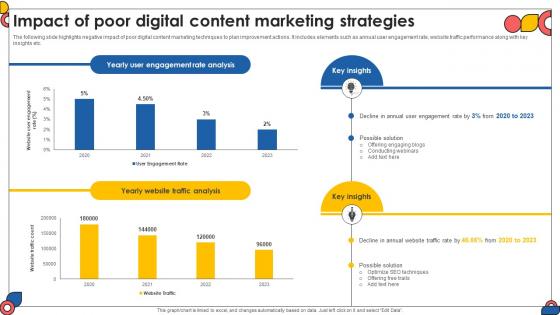
The following slide highlights negative impact of poor digital content marketing techniques to plan improvement actions. It includes elements such as annual user engagement rate, website traffic performance along with key insights etc. Coming up with a presentation necessitates that the majority of the effort goes into the content and the message you intend to convey. The visuals of a PowerPoint presentation can only be effective if it supplements and supports the story that is being told. Keeping this in mind our experts created Impact Of Poor Digital Content Marketing Strategies Comprehensive Guide To Implement Strategy SS V to reduce the time that goes into designing the presentation. This way, you can concentrate on the message while our designers take care of providing you with the right template for the situation. The following slide highlights negative impact of poor digital content marketing techniques to plan improvement actions. It includes elements such as annual user engagement rate, website traffic performance along with key insights etc.
Manufacturing KPI Dashboard For Process Implementing Manufacturing Strategy SS V
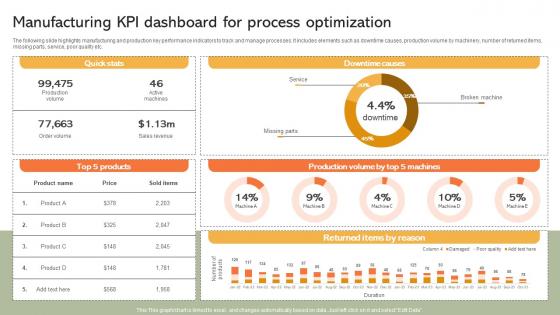
The following slide highlights manufacturing and production key performance indicators to track and manage processes. It includes elements such as downtime causes, production volume by machinery, number of returned items, missing parts, service, poor quality etc. Formulating a presentation can take up a lot of effort and time, so the content and message should always be the primary focus. The visuals of the PowerPoint can enhance the presenters message, so our Manufacturing KPI Dashboard For Process Implementing Manufacturing Strategy SS V was created to help save time. Instead of worrying about the design, the presenter can concentrate on the message while our designers work on creating the ideal templates for whatever situation is needed. Slidegeeks has experts for everything from amazing designs to valuable content, we have put everything into Manufacturing KPI Dashboard For Process Implementing Manufacturing Strategy SS V The following slide highlights manufacturing and production key performance indicators to track and manage processes. It includes elements such as downtime causes, production volume by machinery, number of returned items, missing parts, service, poor quality etc.
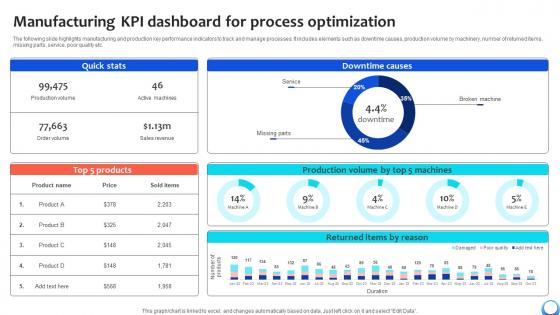
Manufacturing KPI Dashboard For Process Optimization Automating Production Process Strategy SS V
The following slide highlights manufacturing and production key performance indicators to track and manage processes. It includes elements such as downtime causes, production volume by machinery, number of returned items, missing parts, service, poor quality etc. Formulating a presentation can take up a lot of effort and time, so the content and message should always be the primary focus. The visuals of the PowerPoint can enhance the presenters message, so our Manufacturing KPI Dashboard For Process Optimization Automating Production Process Strategy SS V was created to help save time. Instead of worrying about the design, the presenter can concentrate on the message while our designers work on creating the ideal templates for whatever situation is needed. Slidegeeks has experts for everything from amazing designs to valuable content, we have put everything into Manufacturing KPI Dashboard For Process Optimization Automating Production Process Strategy SS V The following slide highlights manufacturing and production key performance indicators to track and manage processes. It includes elements such as downtime causes, production volume by machinery, number of returned items, missing parts, service, poor quality etc.
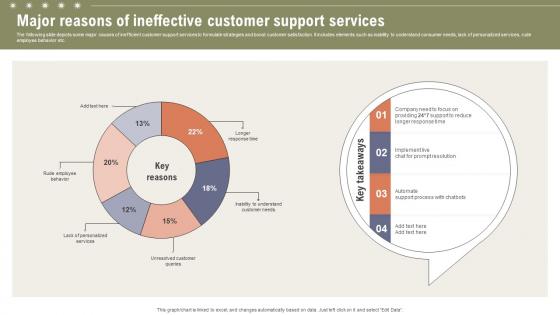
Major Reasons Of Ineffective Customer Support Boosting Customer Retention Rate With Live Chat
The following slide depicts some major causes of inefficient customer support services to formulate strategies and boost customer satisfaction. It includes elements such as inability to understand consumer needs, lack of personalized services, rude employee behavior etc. Coming up with a presentation necessitates that the majority of the effort goes into the content and the message you intend to convey. The visuals of a PowerPoint presentation can only be effective if it supplements and supports the story that is being told. Keeping this in mind our experts created Major Reasons Of Ineffective Customer Support Boosting Customer Retention Rate With Live Chat to reduce the time that goes into designing the presentation. This way, you can concentrate on the message while our designers take care of providing you with the right template for the situation. The following slide depicts some major causes of inefficient customer support services to formulate strategies and boost customer satisfaction. It includes elements such as inability to understand consumer needs, lack of personalized services, rude employee behavior etc.
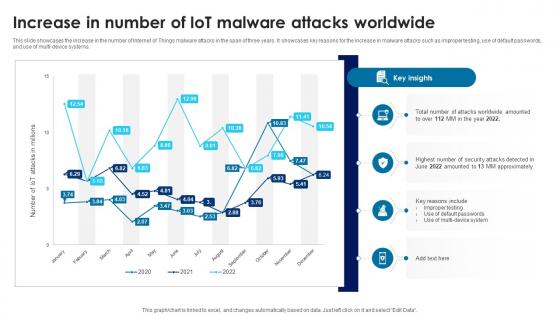
Building Trust With IoT Security Increase In Number Of IoT Malware Attacks Worldwide IoT SS V
This slide showcases the increase in the number of Internet of Things malware attacks in the span of three years. It showcases key reasons for the increase in malware attacks such as improper testing, use of default passwords, and use of multi-device systems. Coming up with a presentation necessitates that the majority of the effort goes into the content and the message you intend to convey. The visuals of a PowerPoint presentation can only be effective if it supplements and supports the story that is being told. Keeping this in mind our experts created Building Trust With IoT Security Increase In Number Of IoT Malware Attacks Worldwide IoT SS V to reduce the time that goes into designing the presentation. This way, you can concentrate on the message while our designers take care of providing you with the right template for the situation. This slide showcases the increase in the number of Internet of Things malware attacks in the span of three years. It showcases key reasons for the increase in malware attacks such as improper testing, use of default passwords, and use of multi-device systems.
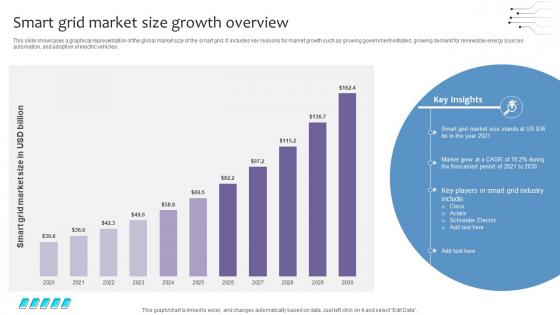
Empowering The Future Smart Grid Market Size Growth Overview IoT SS V
This slide showcases a graphical representation of the global market size of the smart grid. It Includes key reasons for market growth such as growing government-initiated, growing demand for renewable energy sources automation, and adoption of electric vehicles. Coming up with a presentation necessitates that the majority of the effort goes into the content and the message you intend to convey. The visuals of a PowerPoint presentation can only be effective if it supplements and supports the story that is being told. Keeping this in mind our experts created Empowering The Future Smart Grid Market Size Growth Overview IoT SS V to reduce the time that goes into designing the presentation. This way, you can concentrate on the message while our designers take care of providing you with the right template for the situation. This slide showcases a graphical representation of the global market size of the smart grid. It Includes key reasons for market growth such as growing government-initiated, growing demand for renewable energy sources automation, and adoption of electric vehicles.
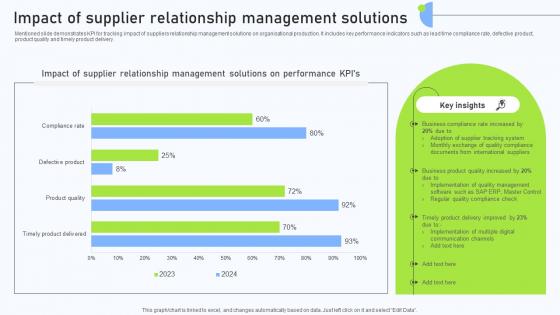
Relationship Management Automation Impact Of Supplier Relationship Management
Mentioned slide demonstrates KPI for tracking impact of suppliers relationship management solutions on organisational production. It includes key performance indicators such as lead time compliance rate, defective product, product quality and timely product delivery. Formulating a presentation can take up a lot of effort and time, so the content and message should always be the primary focus. The visuals of the PowerPoint can enhance the presenters message, so our Relationship Management Automation Impact Of Supplier Relationship Management was created to help save time. Instead of worrying about the design, the presenter can concentrate on the message while our designers work on creating the ideal templates for whatever situation is needed. Slidegeeks has experts for everything from amazing designs to valuable content, we have put everything into Relationship Management Automation Impact Of Supplier Relationship Management Mentioned slide demonstrates KPI for tracking impact of suppliers relationship management solutions on organisational production. It includes key performance indicators such as lead time compliance rate, defective product, product quality and timely product delivery.
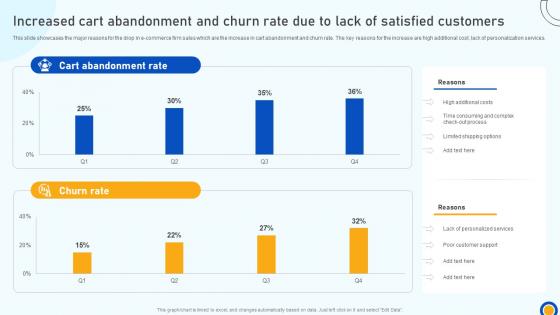
Digital Marketing Strategies Increased Cart Abandonment And Churn Rate Due To Lack SA SS V
This slide showcases the major reasons for the drop in e-commerce firm sales which are the increase in cart abandonment and churn rate. The key reasons for the increase are high additional cost, lack of personalization services. Coming up with a presentation necessitates that the majority of the effort goes into the content and the message you intend to convey. The visuals of a PowerPoint presentation can only be effective if it supplements and supports the story that is being told. Keeping this in mind our experts created Digital Marketing Strategies Increased Cart Abandonment And Churn Rate Due To Lack SA SS V to reduce the time that goes into designing the presentation. This way, you can concentrate on the message while our designers take care of providing you with the right template for the situation. This slide showcases the major reasons for the drop in e-commerce firm sales which are the increase in cart abandonment and churn rate. The key reasons for the increase are high additional cost, lack of personalization services.
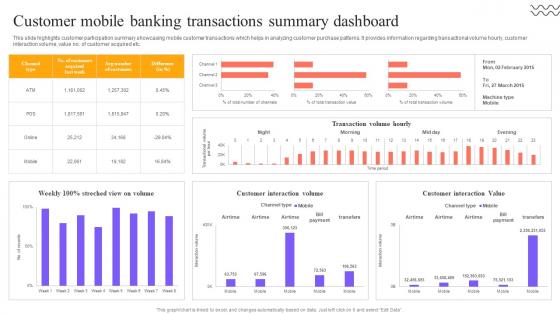
Digital Approach To Client Customer Mobile Banking Transactions Summary Dashboard
This slide highlights customer participation summary showcasing mobile customer transactions which helps in analyzing customer purchase patterns. It provides information regarding transactional volume hourly, customer interaction volume, value no. of customer acquired etc. Formulating a presentation can take up a lot of effort and time, so the content and message should always be the primary focus. The visuals of the PowerPoint can enhance the presenters message, so our Digital Approach To Client Customer Mobile Banking Transactions Summary Dashboard was created to help save time. Instead of worrying about the design, the presenter can concentrate on the message while our designers work on creating the ideal templates for whatever situation is needed. Slidegeeks has experts for everything from amazing designs to valuable content, we have put everything into Digital Approach To Client Customer Mobile Banking Transactions Summary Dashboard. This slide highlights customer participation summary showcasing mobile customer transactions which helps in analyzing customer purchase patterns. It provides information regarding transactional volume hourly, customer interaction volume, value no. of customer acquired etc.
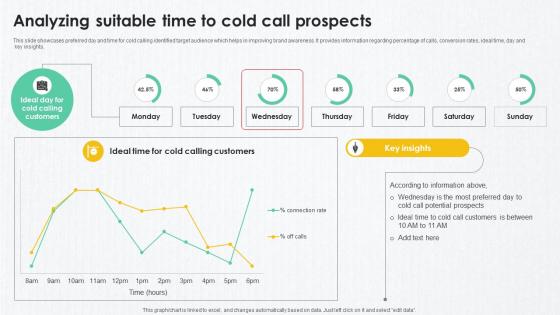
B2B Marketing Techniques Analyzing Suitable Time To Cold Call Prospects
This slide showcases preferred day and time for cold calling identified target audience which helps in improving brand awareness. It provides information regarding percentage of calls, conversion rates, ideal time, day and key insights. Do you have to make sure that everyone on your team knows about any specific topic I yes, then you should give B2B Marketing Techniques Analyzing Suitable Time To Cold Call Prospects a try. Our experts have put a lot of knowledge and effort into creating this impeccable B2B Marketing Techniques Analyzing Suitable Time To Cold Call Prospects. You can use this template for your upcoming presentations, as the slides are perfect to represent even the tiniest detail. You can download these templates from the Slidegeeks website and these are easy to edit. So grab these today This slide showcases preferred day and time for cold calling identified target audience which helps in improving brand awareness. It provides information regarding percentage of calls, conversion rates, ideal time, day and key insights.
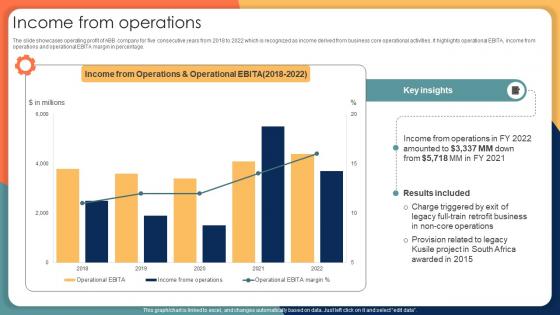
Income From Operations Engineering Solution Provider Company Profile CP SS V
The slide showcases operating profit of ABB company for five consecutive years from 2018 to 2022 which is recognized as income derived from business core operational activities. It highlights operational EBITA, income from operations and operational EBITA margin in percentage. Coming up with a presentation necessitates that the majority of the effort goes into the content and the message you intend to convey. The visuals of a PowerPoint presentation can only be effective if it supplements and supports the story that is being told. Keeping this in mind our experts created Income From Operations Engineering Solution Provider Company Profile CP SS V to reduce the time that goes into designing the presentation. This way, you can concentrate on the message while our designers take care of providing you with the right template for the situation. The slide showcases operating profit of ABB company for five consecutive years from 2018 to 2022 which is recognized as income derived from business core operational activities. It highlights operational EBITA, income from operations and operational EBITA margin in percentage.
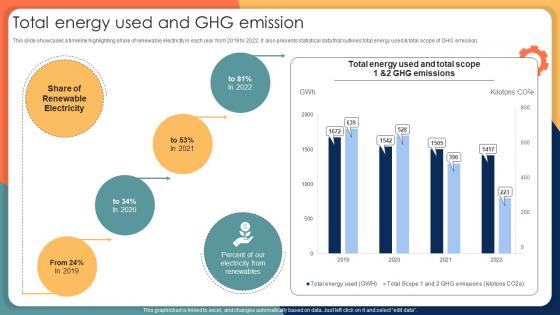
Total Energy Used And Ghg Emission Engineering Solution Provider Company Profile CP SS V
This slide showcases a timeline highlighting share of renewable electricity in each year from 2019 to 2022. It also presents statistical data that outlines total energy used and total scope of GHG emission. Do you have to make sure that everyone on your team knows about any specific topic I yes, then you should give Total Energy Used And Ghg Emission Engineering Solution Provider Company Profile CP SS V a try. Our experts have put a lot of knowledge and effort into creating this impeccable Total Energy Used And Ghg Emission Engineering Solution Provider Company Profile CP SS V. You can use this template for your upcoming presentations, as the slides are perfect to represent even the tiniest detail. You can download these templates from the Slidegeeks website and these are easy to edit. So grab these today This slide showcases a timeline highlighting share of renewable electricity in each year from 2019 to 2022. It also presents statistical data that outlines total energy used and total scope of GHG emission.

Product Analytics KPI Dashboard For Lead Generation Product Analytics Implementation Data Analytics V
This slide illustrates a dashboard to monitor the lead generation on website page using product analytics aimed at making necessary improvements. It covers insights regarding analysis of lead conversions, event retention rate and page views.Do you have to make sure that everyone on your team knows about any specific topic I yes, then you should give Product Analytics KPI Dashboard For Lead Generation Product Analytics Implementation Data Analytics V a try. Our experts have put a lot of knowledge and effort into creating this impeccable Product Analytics KPI Dashboard For Lead Generation Product Analytics Implementation Data Analytics V. You can use this template for your upcoming presentations, as the slides are perfect to represent even the tiniest detail. You can download these templates from the Slidegeeks website and these are easy to edit. So grab these today This slide illustrates a dashboard to monitor the lead generation on website page using product analytics aimed at making necessary improvements. It covers insights regarding analysis of lead conversions, event retention rate and page views
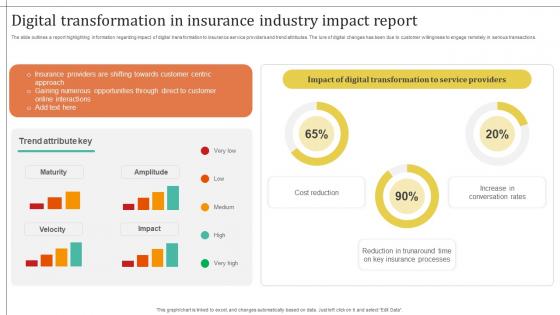
Improving Customer Satisfaction Digital Transformation In Insurance Industry Impact
The slide outlines a report highlighting information regarding impact of digital transformation to insurance service providers and trend attributes. The lure of digital changes has been due to customer willingness to engage remotely in serious transactions. Formulating a presentation can take up a lot of effort and time, so the content and message should always be the primary focus. The visuals of the PowerPoint can enhance the presenters message, so our Improving Customer Satisfaction Digital Transformation In Insurance Industry Impact was created to help save time. Instead of worrying about the design, the presenter can concentrate on the message while our designers work on creating the ideal templates for whatever situation is needed. Slidegeeks has experts for everything from amazing designs to valuable content, we have put everything into Improving Customer Satisfaction Digital Transformation In Insurance Industry Impact. The slide outlines a report highlighting information regarding impact of digital transformation to insurance service providers and trend attributes. The lure of digital changes has been due to customer willingness to engage remotely in serious transactions.
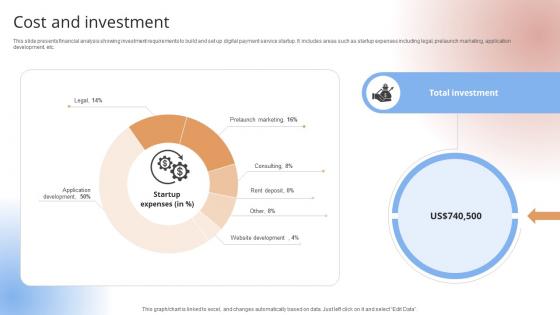
Cost And Investment Payment Gateway Provider Startup GTM Strategy GTM SS V
This slide presents financial analysis showing investment requirements to build and set up digital payment service startup. It includes areas such as startup expenses including legal, prelaunch marketing, application development, etc.This slide presents financial analysis showing investment requirements to build and set up digital payment service startup. It includes areas such as startup expenses including legal, prelaunch marketing, application development, etc.Do you have to make sure that everyone on your team knows about any specific topic I yes, then you should give Cost And Investment Payment Gateway Provider Startup GTM Strategy GTM SS V a try. Our experts have put a lot of knowledge and effort into creating this impeccable Cost And Investment Payment Gateway Provider Startup GTM Strategy GTM SS V. You can use this template for your upcoming presentations, as the slides are perfect to represent even the tiniest detail. You can download these templates from the Slidegeeks website and these are easy to edit. So grab these today This slide presents financial analysis showing investment requirements to build and set up digital payment service startup. It includes areas such as startup expenses including legal, prelaunch marketing, application development, etc.
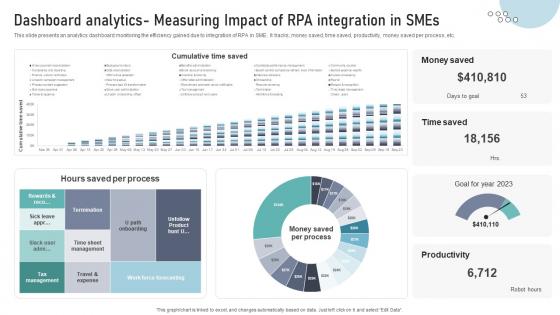
Dashboard Analytics Measuring Impact Of RPA Integration In SMEs DT SS V
This slide presents an analytics dashboard monitoring the efficiency gained due to integration of RPA in SME. It tracks, money saved, time saved, productivity, money saved per process, etc.Formulating a presentation can take up a lot of effort and time, so the content and message should always be the primary focus. The visuals of the PowerPoint can enhance the presenters message, so our Dashboard Analytics Measuring Impact Of RPA Integration In SMEs DT SS V was created to help save time. Instead of worrying about the design, the presenter can concentrate on the message while our designers work on creating the ideal templates for whatever situation is needed. Slidegeeks has experts for everything from amazing designs to valuable content, we have put everything into Dashboard Analytics Measuring Impact Of RPA Integration In SMEs DT SS V. This slide presents an analytics dashboard monitoring the efficiency gained due to integration of RPA in SME. It tracks, money saved, time saved, productivity, money saved per process, etc.
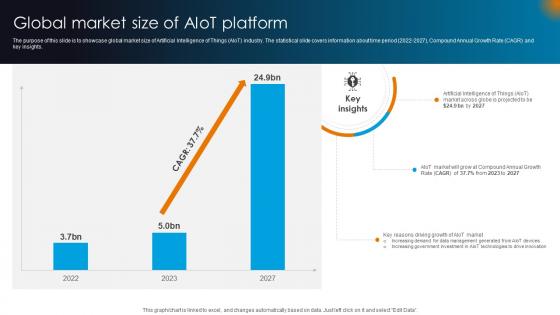
Integrating AI With IoT Global Market Size Of AIoT Platform IoT SS V
The purpose of this slide is to showcase global market size of Artificial Intelligence of Things AIoT industry. The statistical slide covers information about time period 2022-2027, Compound Annual Growth Rate CAGR and key insights. Formulating a presentation can take up a lot of effort and time, so the content and message should always be the primary focus. The visuals of the PowerPoint can enhance the presenters message, so our Integrating AI With IoT Global Market Size Of AIoT Platform IoT SS V was created to help save time. Instead of worrying about the design, the presenter can concentrate on the message while our designers work on creating the ideal templates for whatever situation is needed. Slidegeeks has experts for everything from amazing designs to valuable content, we have put everything into Integrating AI With IoT Global Market Size Of AIoT Platform IoT SS V. The purpose of this slide is to showcase global market size of Artificial Intelligence of Things AIoT industry. The statistical slide covers information about time period 2022-2027, Compound Annual Growth Rate CAGR and key insights.
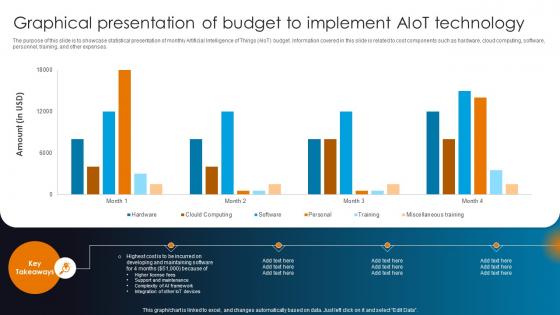
Integrating AI With IoT Graphical Presentation Of Budget To Implement AIoT Technology IoT SS V
The purpose of this slide is to showcase statistical presentation of monthly Artificial Intelligence of Things AIoT budget. Information covered in this slide is related to cost components such as hardware, cloud computing, software, personnel, training, and other expenses. Coming up with a presentation necessitates that the majority of the effort goes into the content and the message you intend to convey. The visuals of a PowerPoint presentation can only be effective if it supplements and supports the story that is being told. Keeping this in mind our experts created Integrating AI With IoT Graphical Presentation Of Budget To Implement AIoT Technology IoT SS V to reduce the time that goes into designing the presentation. This way, you can concentrate on the message while our designers take care of providing you with the right template for the situation. The purpose of this slide is to showcase statistical presentation of monthly Artificial Intelligence of Things AIoT budget. Information covered in this slide is related to cost components such as hardware, cloud computing, software, personnel, training, and other expenses.
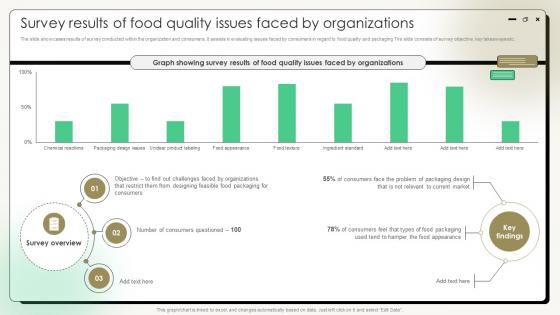
Comprehensive Guide On Current Strategies Survey Results Of Food Quality Issues Faced By Organizations
The slide showcases results of survey conducted within the organization and consumers. It assists in evaluating issues faced by consumers in regard to food quality and packaging The slide consists of survey objective, key takeaways etc. Do you have to make sure that everyone on your team knows about any specific topic I yes, then you should give Comprehensive Guide On Current Strategies Survey Results Of Food Quality Issues Faced By Organizations a try. Our experts have put a lot of knowledge and effort into creating this impeccable Comprehensive Guide On Current Strategies Survey Results Of Food Quality Issues Faced By Organizations. You can use this template for your upcoming presentations, as the slides are perfect to represent even the tiniest detail. You can download these templates from the Slidegeeks website and these are easy to edit. So grab these today The slide showcases results of survey conducted within the organization and consumers. It assists in evaluating issues faced by consumers in regard to food quality and packaging The slide consists of survey objective, key takeaways etc.
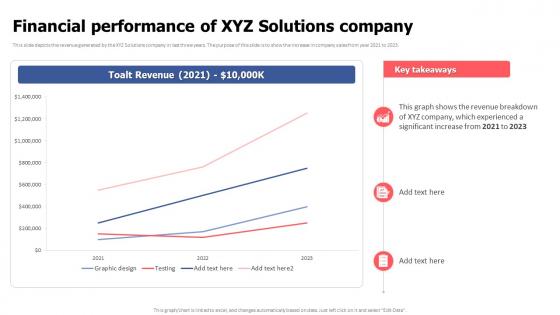
Financial Performance Of XYZ Solutions Company Video Game Financing Pitch Deck
This slide depicts the revenue generated by the XYZ Solutions company in last three years. The purpose of this slide is to show the increase in company sales from year 2021 to 2023. Do you have to make sure that everyone on your team knows about any specific topic I yes, then you should give Financial Performance Of XYZ Solutions Company Video Game Financing Pitch Deck a try. Our experts have put a lot of knowledge and effort into creating this impeccable Financial Performance Of XYZ Solutions Company Video Game Financing Pitch Deck. You can use this template for your upcoming presentations, as the slides are perfect to represent even the tiniest detail. You can download these templates from the Slidegeeks website and these are easy to edit. So grab these today This slide depicts the revenue generated by the XYZ Solutions company in last three years. The purpose of this slide is to show the increase in company sales from year 2021 to 2023.
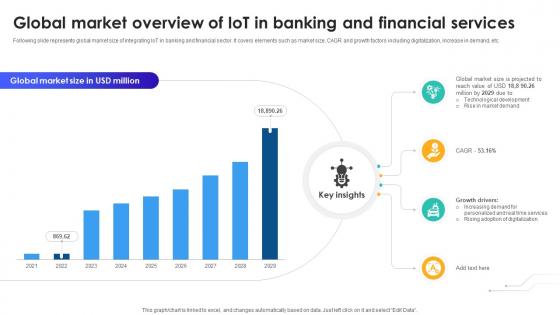
Global Market Overview Of IoT In Banking And Financial Services IoT In Banking For Digital Future IoT SS V
Following slide represents global market size of integrating IoT in banking and financial sector. It covers elements such as market size, CAGR and growth factors including digitalization, increase in demand, etc. Do you have to make sure that everyone on your team knows about any specific topic I yes, then you should give Global Market Overview Of IoT In Banking And Financial Services IoT In Banking For Digital Future IoT SS V a try. Our experts have put a lot of knowledge and effort into creating this impeccable Global Market Overview Of IoT In Banking And Financial Services IoT In Banking For Digital Future IoT SS V. You can use this template for your upcoming presentations, as the slides are perfect to represent even the tiniest detail. You can download these templates from the Slidegeeks website and these are easy to edit. So grab these today Following slide represents global market size of integrating IoT in banking and financial sector. It covers elements such as market size, CAGR and growth factors including digitalization, increase in demand, etc.
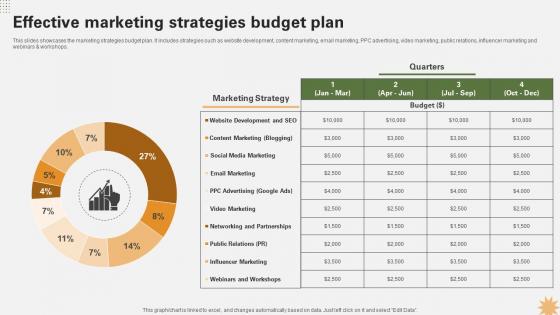
Effective Marketing Strategies Budget Plan Strategy For Launching A Financial Strategy SS V
This slides showcases the marketing strategies budget plan. It includes strategies such as website development, content marketing, email marketing, PPC advertising, video marketing, public relations, influencer marketing and webinars and workshops. Do you have to make sure that everyone on your team knows about any specific topic I yes, then you should give Effective Marketing Strategies Budget Plan Strategy For Launching A Financial Strategy SS V a try. Our experts have put a lot of knowledge and effort into creating this impeccable Effective Marketing Strategies Budget Plan Strategy For Launching A Financial Strategy SS V. You can use this template for your upcoming presentations, as the slides are perfect to represent even the tiniest detail. You can download these templates from the Slidegeeks website and these are easy to edit. So grab these today This slides showcases the marketing strategies budget plan. It includes strategies such as website development, content marketing, email marketing, PPC advertising, video marketing, public relations, influencer marketing and webinars and workshops.
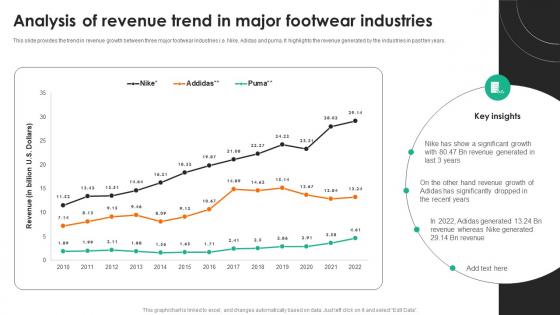
Evaluating Adidas Branding Analysis Of Revenue Trend In Major Footwear Industries Strategy SS V
This slide provides the trend in revenue growth between three major footwear industries i.e. Nike, Adidas and puma. It highlights the revenue generated by the industries in past ten years. Formulating a presentation can take up a lot of effort and time, so the content and message should always be the primary focus. The visuals of the PowerPoint can enhance the presenters message, so our Evaluating Adidas Branding Analysis Of Revenue Trend In Major Footwear Industries Strategy SS V was created to help save time. Instead of worrying about the design, the presenter can concentrate on the message while our designers work on creating the ideal templates for whatever situation is needed. Slidegeeks has experts for everything from amazing designs to valuable content, we have put everything into Evaluating Adidas Branding Analysis Of Revenue Trend In Major Footwear Industries Strategy SS V. This slide provides the trend in revenue growth between three major footwear industries i.e. Nike, Adidas and puma. It highlights the revenue generated by the industries in past ten years.
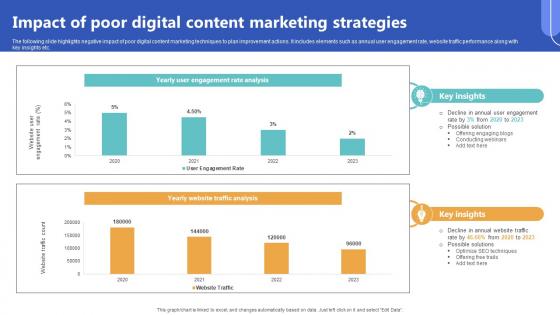
Impact Of Poor Digital Content Marketing Strategies Top Of The Funnel Digital Content Strategy SS V
The following slide highlights negative impact of poor digital content marketing techniques to plan improvement actions. It includes elements such as annual user engagement rate, website traffic performance along with key insights etc. Formulating a presentation can take up a lot of effort and time, so the content and message should always be the primary focus. The visuals of the PowerPoint can enhance the presenters message, so our Impact Of Poor Digital Content Marketing Strategies Top Of The Funnel Digital Content Strategy SS V was created to help save time. Instead of worrying about the design, the presenter can concentrate on the message while our designers work on creating the ideal templates for whatever situation is needed. Slidegeeks has experts for everything from amazing designs to valuable content, we have put everything into Impact Of Poor Digital Content Marketing Strategies Top Of The Funnel Digital Content Strategy SS V The following slide highlights negative impact of poor digital content marketing techniques to plan improvement actions. It includes elements such as annual user engagement rate, website traffic performance along with key insights etc.

Immersive Training For Practical Post Training Impact Of Simulation Training On Decision DTE SS V
This slide includes key performance indicators that the company has a positive impact on due to effective training programs such as team collaboration rate, error rate, etc. Formulating a presentation can take up a lot of effort and time, so the content and message should always be the primary focus. The visuals of the PowerPoint can enhance the presenters message, so our Immersive Training For Practical Post Training Impact Of Simulation Training On Decision DTE SS V was created to help save time. Instead of worrying about the design, the presenter can concentrate on the message while our designers work on creating the ideal templates for whatever situation is needed. Slidegeeks has experts for everything from amazing designs to valuable content, we have put everything into Immersive Training For Practical Post Training Impact Of Simulation Training On Decision DTE SS V. This slide includes key performance indicators that the company has a positive impact on due to effective training programs such as team collaboration rate, error rate, etc.
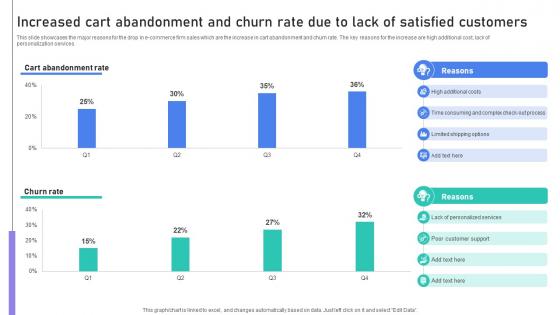
Building Stronger Customer Increased Cart Abandonment And Churn Rate Due To Lack SA SS V
This slide showcases the major reasons for the drop in e-commerce firm sales which are the increase in cart abandonment and churn rate. The key reasons for the increase are high additional cost, lack of personalization services. Coming up with a presentation necessitates that the majority of the effort goes into the content and the message you intend to convey. The visuals of a PowerPoint presentation can only be effective if it supplements and supports the story that is being told. Keeping this in mind our experts created Building Stronger Customer Increased Cart Abandonment And Churn Rate Due To Lack SA SS V to reduce the time that goes into designing the presentation. This way, you can concentrate on the message while our designers take care of providing you with the right template for the situation. This slide showcases the major reasons for the drop in e-commerce firm sales which are the increase in cart abandonment and churn rate. The key reasons for the increase are high additional cost, lack of personalization services.
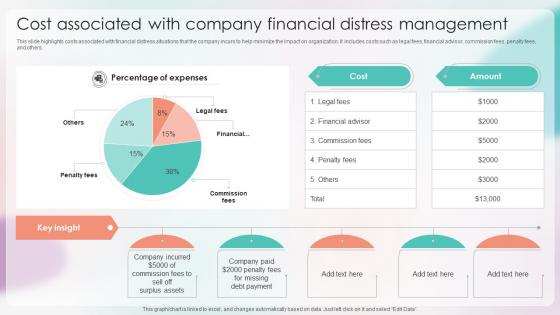
Strategies For Stabilizing Corporate Cost Associated With Company Financial Distress Management
This slide highlights costs associated with financial distress situations that the company incurs to help minimize the impact on organization. It includes costs such as legal fees, financial advisor, commission fees, penalty fees, and others. Do you have to make sure that everyone on your team knows about any specific topic I yes, then you should give Strategies For Stabilizing Corporate Cost Associated With Company Financial Distress Management a try. Our experts have put a lot of knowledge and effort into creating this impeccable Strategies For Stabilizing Corporate Cost Associated With Company Financial Distress Management. You can use this template for your upcoming presentations, as the slides are perfect to represent even the tiniest detail. You can download these templates from the Slidegeeks website and these are easy to edit. So grab these today This slide highlights costs associated with financial distress situations that the company incurs to help minimize the impact on organization. It includes costs such as legal fees, financial advisor, commission fees, penalty fees, and others.

Complete Beginners Guide Bitcoin Price Forecast To Predict Future Trends Fin SS V
This slide shows information which can be used to analyze the future trends or future growth in the price of Bitcoin. It also includes information about growth drivers and market restraints. Do you have to make sure that everyone on your team knows about any specific topic I yes, then you should give Complete Beginners Guide Bitcoin Price Forecast To Predict Future Trends Fin SS V a try. Our experts have put a lot of knowledge and effort into creating this impeccable Complete Beginners Guide Bitcoin Price Forecast To Predict Future Trends Fin SS V. You can use this template for your upcoming presentations, as the slides are perfect to represent even the tiniest detail. You can download these templates from the Slidegeeks website and these are easy to edit. So grab these today This slide shows information which can be used to analyze the future trends or future growth in the price of Bitcoin. It also includes information about growth drivers and market restraints.
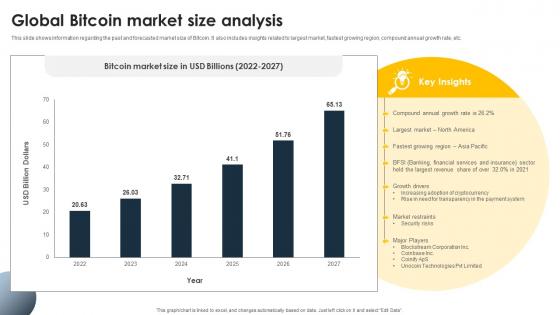
Complete Beginners Guide Global Bitcoin Market Size Analysis Fin SS V
This slide shows information regarding the past and forecasted market size of Bitcoin. It also includes insights related to largest market, fastest growing region, compound annual growth rate, etc. Formulating a presentation can take up a lot of effort and time, so the content and message should always be the primary focus. The visuals of the PowerPoint can enhance the presenters message, so our Complete Beginners Guide Global Bitcoin Market Size Analysis Fin SS V was created to help save time. Instead of worrying about the design, the presenter can concentrate on the message while our designers work on creating the ideal templates for whatever situation is needed. Slidegeeks has experts for everything from amazing designs to valuable content, we have put everything into Complete Beginners Guide Global Bitcoin Market Size Analysis Fin SS V. This slide shows information regarding the past and forecasted market size of Bitcoin. It also includes insights related to largest market, fastest growing region, compound annual growth rate, etc.
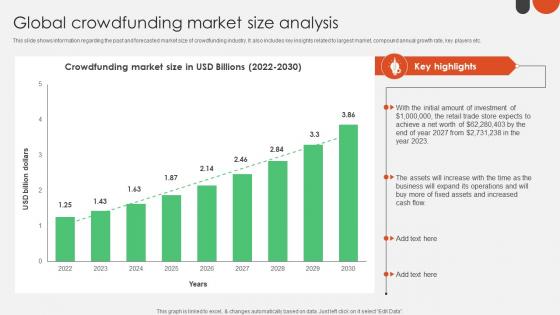
Global Crowdfunding Market Size Analysis Crowdfunding For Nonprofits To Support Fin SS V
This slide shows information regarding the past and forecasted market size of crowdfunding industry. It also includes key insights related to largest market, compound annual growth rate, key players etc. Formulating a presentation can take up a lot of effort and time, so the content and message should always be the primary focus. The visuals of the PowerPoint can enhance the presenters message, so our Global Crowdfunding Market Size Analysis Crowdfunding For Nonprofits To Support Fin SS V was created to help save time. Instead of worrying about the design, the presenter can concentrate on the message while our designers work on creating the ideal templates for whatever situation is needed. Slidegeeks has experts for everything from amazing designs to valuable content, we have put everything into Global Crowdfunding Market Size Analysis Crowdfunding For Nonprofits To Support Fin SS V This slide shows information regarding the past and forecasted market size of crowdfunding industry. It also includes key insights related to largest market, compound annual growth rate, key players etc.
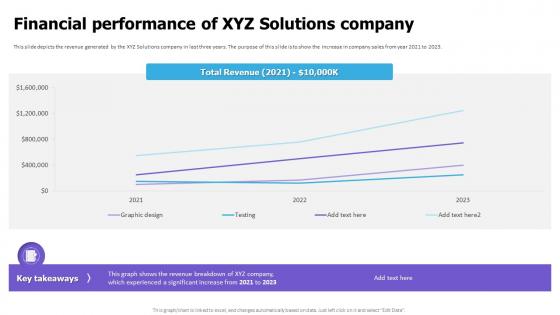
Financial Performance Of XYZ Solutions Company Cloud Game Development Fundraising Pitch Deck
This slide depicts the revenue generated by the XYZ Solutions company in last three years. The purpose of this slide is to show the increase in company sales from year 2021 to 2023. Do you have to make sure that everyone on your team knows about any specific topic I yes, then you should give Financial Performance Of XYZ Solutions Company Cloud Game Development Fundraising Pitch Deck a try. Our experts have put a lot of knowledge and effort into creating this impeccable Financial Performance Of XYZ Solutions Company Cloud Game Development Fundraising Pitch Deck. You can use this template for your upcoming presentations, as the slides are perfect to represent even the tiniest detail. You can download these templates from the Slidegeeks website and these are easy to edit. So grab these today This slide depicts the revenue generated by the XYZ Solutions company in last three years. The purpose of this slide is to show the increase in company sales from year 2021 to 2023.
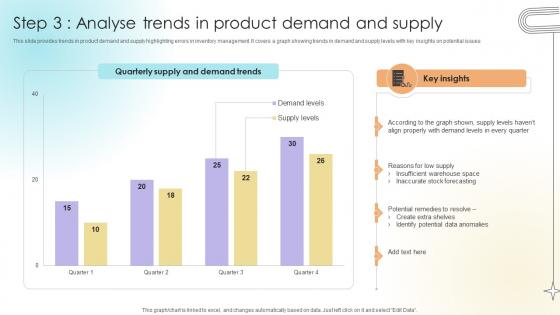
Step 3 Analyse Trends In Product Demand And Supply Data Analytics SS V
This slide provides trends in product demand and supply highlighting errors in inventory management. It covers a graph showing trends in demand and supply levels with key insights on potential issues.Formulating a presentation can take up a lot of effort and time, so the content and message should always be the primary focus. The visuals of the PowerPoint can enhance the presenters message, so our Step 3 Analyse Trends In Product Demand And Supply Data Analytics SS V was created to help save time. Instead of worrying about the design, the presenter can concentrate on the message while our designers work on creating the ideal templates for whatever situation is needed. Slidegeeks has experts for everything from amazing designs to valuable content, we have put everything into Step 3 Analyse Trends In Product Demand And Supply Data Analytics SS V. This slide provides trends in product demand and supply highlighting errors in inventory management. It covers a graph showing trends in demand and supply levels with key insights on potential issues.

Enhancing Profitability Modelling Source Of Capital Structure Funding
This slide provides information about the funding of firm through owner and borrowed funds. Owners funds consists of equity in terms of equity share capital, whereas borrowed funds consists of loans, debentures, lease financing etc. Formulating a presentation can take up a lot of effort and time, so the content and message should always be the primary focus. The visuals of the PowerPoint can enhance the presenters message, so our Enhancing Profitability Modelling Source Of Capital Structure Funding was created to help save time. Instead of worrying about the design, the presenter can concentrate on the message while our designers work on creating the ideal templates for whatever situation is needed. Slidegeeks has experts for everything from amazing designs to valuable content, we have put everything into Enhancing Profitability Modelling Source Of Capital Structure Funding. This slide provides information about the funding of firm through owner and borrowed funds. Owners funds consists of equity in terms of equity share capital, whereas borrowed funds consists of loans, debentures, lease financing etc.
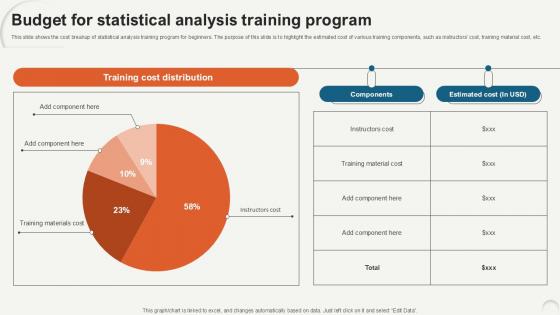
Budget For Statistical Data Analytics For Informed Decision Ppt Slide
This slide shows the cost breakup of statistical analysis training program for beginners. The purpose of this slide is to highlight the estimated cost of various training components, such as instructors cost, training material cost, etc. Do you have to make sure that everyone on your team knows about any specific topic I yes, then you should give Budget For Statistical Data Analytics For Informed Decision Ppt Slide a try. Our experts have put a lot of knowledge and effort into creating this impeccable Budget For Statistical Data Analytics For Informed Decision Ppt Slide. You can use this template for your upcoming presentations, as the slides are perfect to represent even the tiniest detail. You can download these templates from the Slidegeeks website and these are easy to edit. So grab these today This slide shows the cost breakup of statistical analysis training program for beginners. The purpose of this slide is to highlight the estimated cost of various training components, such as instructors cost, training material cost, etc.
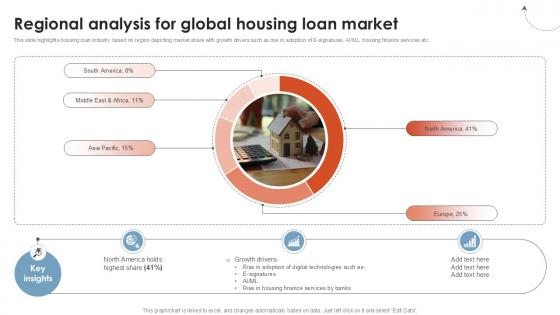
Regional Analysis For Global Housing Global Consumer Financial Ppt PowerPoint CRP DK SS V
This slide highlights housing loan industry based on region depicting market share with growth drivers such as rise in adoption of E-signatures, AI and ML, housing finance services etc. Formulating a presentation can take up a lot of effort and time, so the content and message should always be the primary focus. The visuals of the PowerPoint can enhance the presenters message, so our Regional Analysis For Global Housing Global Consumer Financial Ppt PowerPoint CRP DK SS V was created to help save time. Instead of worrying about the design, the presenter can concentrate on the message while our designers work on creating the ideal templates for whatever situation is needed. Slidegeeks has experts for everything from amazing designs to valuable content, we have put everything into Regional Analysis For Global Housing Global Consumer Financial Ppt PowerPoint CRP DK SS V This slide highlights housing loan industry based on region depicting market share with growth drivers such as rise in adoption of E-signatures, AI and ML, housing finance services etc.
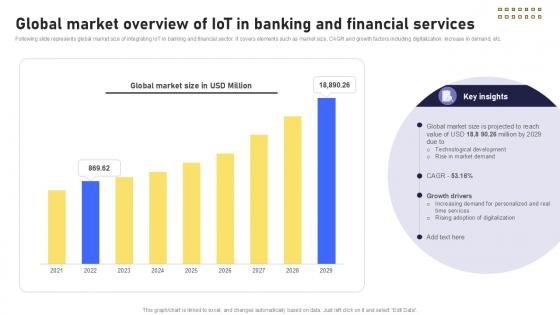
Global Market Overview Of Banking Future With IoT Ppt Powerpoint IoT SS V
Following slide represents global market size of integrating IoT in banking and financial sector. It covers elements such as market size, CAGR and growth factors including digitalization, increase in demand, etc. Do you have to make sure that everyone on your team knows about any specific topic I yes, then you should give Global Market Overview Of Banking Future With IoT Ppt Powerpoint IoT SS V a try. Our experts have put a lot of knowledge and effort into creating this impeccable Global Market Overview Of Banking Future With IoT Ppt Powerpoint IoT SS V. You can use this template for your upcoming presentations, as the slides are perfect to represent even the tiniest detail. You can download these templates from the Slidegeeks website and these are easy to edit. So grab these today Following slide represents global market size of integrating IoT in banking and financial sector. It covers elements such as market size, CAGR and growth factors including digitalization, increase in demand, etc.

Financial Metrics Of Electric Vehicles Luxury Automobile Vehicles PPT Sample CP SS V
This slide showcases the financial metrics of passenger vehicles. It includes metrics such as sales volume in units, EV penetration percent, market share and public charging and Y-O-Y growth. Formulating a presentation can take up a lot of effort and time, so the content and message should always be the primary focus. The visuals of the PowerPoint can enhance the presenters message, so our Financial Metrics Of Electric Vehicles Luxury Automobile Vehicles PPT Sample CP SS V was created to help save time. Instead of worrying about the design, the presenter can concentrate on the message while our designers work on creating the ideal templates for whatever situation is needed. Slidegeeks has experts for everything from amazing designs to valuable content, we have put everything into Financial Metrics Of Electric Vehicles Luxury Automobile Vehicles PPT Sample CP SS V This slide showcases the financial metrics of passenger vehicles. It includes metrics such as sales volume in units, EV penetration percent, market share and public charging and Y-O-Y growth.
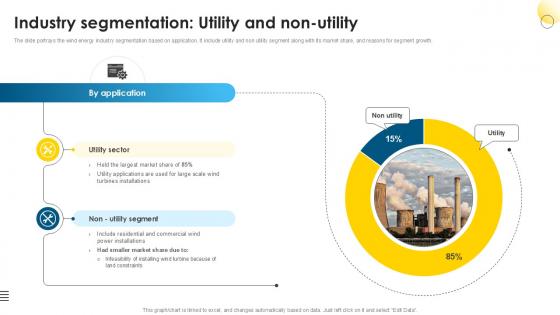
Industry Segmentation Utility Global Wind Power Market PPT Sample IR SS V
The slide portrays the wind energy industry segmentation based on application. It include utility and non utility segment along with its market share, and reasons for segment growth. Formulating a presentation can take up a lot of effort and time, so the content and message should always be the primary focus. The visuals of the PowerPoint can enhance the presenters message, so our Industry Segmentation Utility Global Wind Power Market PPT Sample IR SS V was created to help save time. Instead of worrying about the design, the presenter can concentrate on the message while our designers work on creating the ideal templates for whatever situation is needed. Slidegeeks has experts for everything from amazing designs to valuable content, we have put everything into Industry Segmentation Utility Global Wind Power Market PPT Sample IR SS V The slide portrays the wind energy industry segmentation based on application. It include utility and non utility segment along with its market share, and reasons for segment growth.

Major Reasons Of Ineffective Improving Customer Retention PPT Slide
The following slide depicts some major causes of inefficient customer support services to formulate strategies and boost customer satisfaction. It includes elements such as inability to understand consumer needs, lack of personalized services, rude employee behavior etc. Coming up with a presentation necessitates that the majority of the effort goes into the content and the message you intend to convey. The visuals of a PowerPoint presentation can only be effective if it supplements and supports the story that is being told. Keeping this in mind our experts created Major Reasons Of Ineffective Improving Customer Retention PPT Slide to reduce the time that goes into designing the presentation. This way, you can concentrate on the message while our designers take care of providing you with the right template for the situation. The following slide depicts some major causes of inefficient customer support services to formulate strategies and boost customer satisfaction. It includes elements such as inability to understand consumer needs, lack of personalized services, rude employee behavior etc.
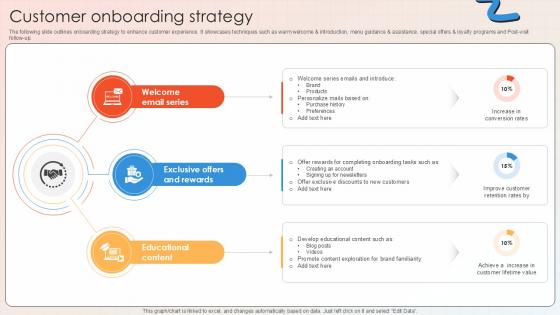
Customer Onboarding Strategy Apparel And Shoes E Commerce Market PPT Example GTM SS V
The following slide outlines onboarding strategy to enhance customer experience. It showcases techniques such as warm welcome and introduction, menu guidance and assistance, special offers and loyalty programs and Post-visit follow-up. Do you have to make sure that everyone on your team knows about any specific topic I yes, then you should give Customer Onboarding Strategy Apparel And Shoes E Commerce Market PPT Example GTM SS V a try. Our experts have put a lot of knowledge and effort into creating this impeccable Customer Onboarding Strategy Apparel And Shoes E Commerce Market PPT Example GTM SS V. You can use this template for your upcoming presentations, as the slides are perfect to represent even the tiniest detail. You can download these templates from the Slidegeeks website and these are easy to edit. So grab these today The following slide outlines onboarding strategy to enhance customer experience. It showcases techniques such as warm welcome and introduction, menu guidance and assistance, special offers and loyalty programs and Post-visit follow-up.

Revenue Streams Private School Investor Funding Elevator Pitch Deck PPT Template
This slide explores how our private school generates income, including tuition fees and additional services. It includes revenue sources such as, tuition fees after school programs, summer camps, and corporate training contracts. Formulating a presentation can take up a lot of effort and time, so the content and message should always be the primary focus. The visuals of the PowerPoint can enhance the presenters message, so our Revenue Streams Private School Investor Funding Elevator Pitch Deck PPT Template was created to help save time. Instead of worrying about the design, the presenter can concentrate on the message while our designers work on creating the ideal templates for whatever situation is needed. Slidegeeks has experts for everything from amazing designs to valuable content, we have put everything into Revenue Streams Private School Investor Funding Elevator Pitch Deck PPT Template This slide explores how our private school generates income, including tuition fees and additional services. It includes revenue sources such as, tuition fees after school programs, summer camps, and corporate training contracts.
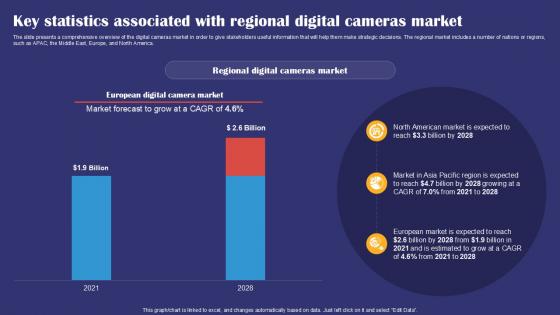
Key Statistics Associated With Regional Digital Cameras Smartphones Industry Report PPT Example IR SS V
The slide presents a comprehensive overview of the digital cameras market in order to give stakeholders useful information that will help them make strategic decisions. The regional market includes a number of nations or regions, such as APAC, the Middle East, Europe, and North America. Coming up with a presentation necessitates that the majority of the effort goes into the content and the message you intend to convey. The visuals of a PowerPoint presentation can only be effective if it supplements and supports the story that is being told. Keeping this in mind our experts created Key Statistics Associated With Regional Digital Cameras Smartphones Industry Report PPT Example IR SS V to reduce the time that goes into designing the presentation. This way, you can concentrate on the message while our designers take care of providing you with the right template for the situation. The slide presents a comprehensive overview of the digital cameras market in order to give stakeholders useful information that will help them make strategic decisions. The regional market includes a number of nations or regions, such as APAC, the Middle East, Europe, and North America.
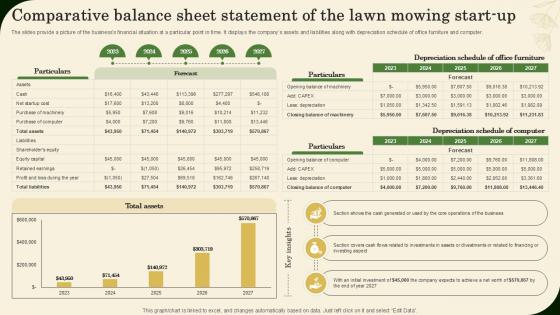
Comparative Balance Sheet Statement Of The Lawn Mowing Landscaping Business Plan Ppt Slide BP SS V
The slides provide a picture of the businesss financial situation at a particular point in time. It displays the companys assets and liabilities along with depreciation schedule of office furniture and computer. Do you have to make sure that everyone on your team knows about any specific topic I yes, then you should give Comparative Balance Sheet Statement Of The Lawn Mowing Landscaping Business Plan Ppt Slide BP SS V a try. Our experts have put a lot of knowledge and effort into creating this impeccable Comparative Balance Sheet Statement Of The Lawn Mowing Landscaping Business Plan Ppt Slide BP SS V You can use this template for your upcoming presentations, as the slides are perfect to represent even the tiniest detail. You can download these templates from the Slidegeeks website and these are easy to edit. So grab these today The slides provide a picture of the businesss financial situation at a particular point in time. It displays the companys assets and liabilities along with depreciation schedule of office furniture and computer.
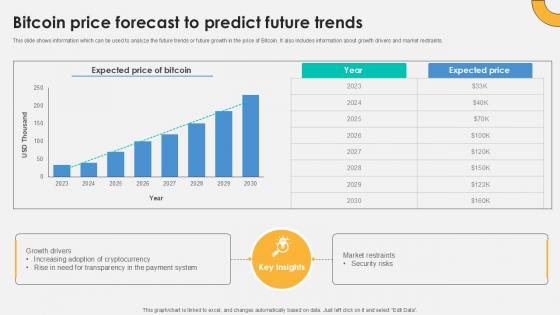
Bitcoin Price Forecast To Predict Everything About Bitcoin PPT Sample Fin SS V
This slide shows information which can be used to analyze the future trends or future growth in the price of Bitcoin. It also includes information about growth drivers and market restraints. Do you have to make sure that everyone on your team knows about any specific topic I yes, then you should give Bitcoin Price Forecast To Predict Everything About Bitcoin PPT Sample Fin SS V a try. Our experts have put a lot of knowledge and effort into creating this impeccable Bitcoin Price Forecast To Predict Everything About Bitcoin PPT Sample Fin SS V. You can use this template for your upcoming presentations, as the slides are perfect to represent even the tiniest detail. You can download these templates from the Slidegeeks website and these are easy to edit. So grab these today This slide shows information which can be used to analyze the future trends or future growth in the price of Bitcoin. It also includes information about growth drivers and market restraints.

Quarterly Project Status Report With Timeline Quarterly Report Ppt Presentation
The following slide highlights the quarterly project status report with timeline illustrating key headings which includes timelines for quarter 1, Project finance in millions, allocated resources and potential risks. It assists the organization to monitor quarterly performance for each project Do you have to make sure that everyone on your team knows about any specific topic I yes, then you should give Quarterly Project Status Report With Timeline Quarterly Report Ppt Presentation a try. Our experts have put a lot of knowledge and effort into creating this impeccable Quarterly Project Status Report With Timeline Quarterly Report Ppt Presentation You can use this template for your upcoming presentations, as the slides are perfect to represent even the tiniest detail. You can download these templates from the Slidegeeks website and these are easy to edit. So grab these today The following slide highlights the quarterly project status report with timeline illustrating key headings which includes timelines for quarter 1, Project finance in millions, allocated resources and potential risks. It assists the organization to monitor quarterly performance for each project

Customer Attrition Rate In IBN Outsourcing Company For 5 Years PPT Slide SS
This slide shows an increase in the Customer Attrition Rate in IBN Outsourcing Company due to certain factors such as Poor Onboarding Procedures, Lack of Proactive Customer Support and Communication, increased product, service bugginess due to use of outdated technologies etc. for a period of 5 years starting from 2017 to 2021. Do you have to make sure that everyone on your team knows about any specific topic I yes, then you should give Customer Attrition Rate In IBN Outsourcing Company For 5 Years PPT Slide SS a try. Our experts have put a lot of knowledge and effort into creating this impeccable Customer Attrition Rate In IBN Outsourcing Company For 5 Years PPT Slide SS. You can use this template for your upcoming presentations, as the slides are perfect to represent even the tiniest detail. You can download these templates from the Slidegeeks website and these are easy to edit. So grab these today This slide shows an increase in the Customer Attrition Rate in IBN Outsourcing Company due to certain factors such as Poor Onboarding Procedures, Lack of Proactive Customer Support and Communication, increased product, service bugginess due to use of outdated technologies etc. for a period of 5 years starting from 2017 to 2021.

Problem And Solution 2 Low Product Adoption Rate PPT Example SS
This slide shows the problem that the company is facing related to Product Adoption Rate that is constantly declining as customers are leaving the company services and opting for another services due to poor customer onboarding procedures followed. Also, some recommendations are provided to solve the problem. Formulating a presentation can take up a lot of effort and time, so the content and message should always be the primary focus. The visuals of the PowerPoint can enhance the presenters message, so our Problem And Solution 2 Low Product Adoption Rate PPT Example SS was created to help save time. Instead of worrying about the design, the presenter can concentrate on the message while our designers work on creating the ideal templates for whatever situation is needed. Slidegeeks has experts for everything from amazing designs to valuable content, we have put everything into Problem And Solution 2 Low Product Adoption Rate PPT Example SS This slide shows the problem that the company is facing related to Product Adoption Rate that is constantly declining as customers are leaving the company services and opting for another services due to poor customer onboarding procedures followed. Also, some recommendations are provided to solve the problem.
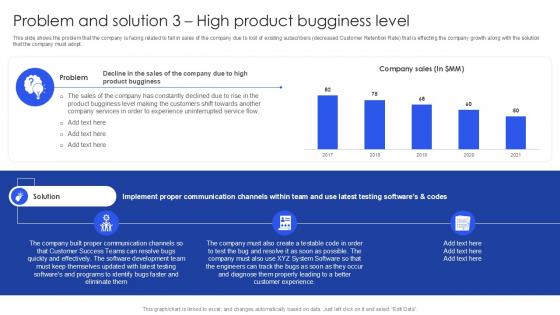
Problem And Solution 3 High Product Bugginess Level PPT Example SS
This slide shows the problem that the company is facing related to fall in sales of the company due to lost of existing subscribers decreased Customer Retention Rate that is effecting the company growth along with the solution that the company must adopt. Coming up with a presentation necessitates that the majority of the effort goes into the content and the message you intend to convey. The visuals of a PowerPoint presentation can only be effective if it supplements and supports the story that is being told. Keeping this in mind our experts created Problem And Solution 3 High Product Bugginess Level PPT Example SS to reduce the time that goes into designing the presentation. This way, you can concentrate on the message while our designers take care of providing you with the right template for the situation. This slide shows the problem that the company is facing related to fall in sales of the company due to lost of existing subscribers decreased Customer Retention Rate that is effecting the company growth along with the solution that the company must adopt.
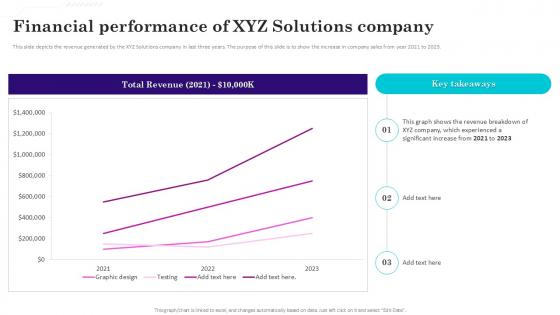
Financial Performance Of XYZ Gaming Venture Investment Elevator Pitch Deck Ppt Template
This slide depicts the revenue generated by the XYZ Solutions company in last three years. The purpose of this slide is to show the increase in company sales from year 2021 to 2023. Do you have to make sure that everyone on your team knows about any specific topic I yes, then you should give Financial Performance Of XYZ Gaming Venture Investment Elevator Pitch Deck Ppt Template a try. Our experts have put a lot of knowledge and effort into creating this impeccable Financial Performance Of XYZ Gaming Venture Investment Elevator Pitch Deck Ppt Template You can use this template for your upcoming presentations, as the slides are perfect to represent even the tiniest detail. You can download these templates from the Slidegeeks website and these are easy to edit. So grab these today This slide depicts the revenue generated by the XYZ Solutions company in last three years. The purpose of this slide is to show the increase in company sales from year 2021 to 2023.

 Home
Home