Strength Icons
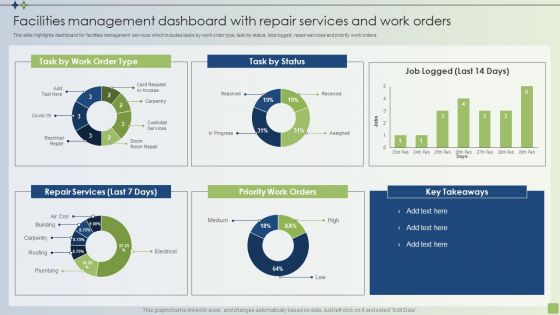
Strategic FM Services Facilities Management Dashboard With Repair Services And Work Orders Infographics PDF
This slide highlights dashboard for facilities management services which includes tasks by work order type, task by status, lobs logged, repair services and priority work orders. Formulating a presentation can take up a lot of effort and time, so the content and message should always be the primary focus. The visuals of the PowerPoint can enhance the presenters message, so our Strategic FM Services Facilities Management Dashboard With Repair Services And Work Orders Infographics PDF was created to help save time. Instead of worrying about the design, the presenter can concentrate on the message while our designers work on creating the ideal templates for whatever situation is needed. Slidegeeks has experts for everything from amazing designs to valuable content, we have put everything into Strategic FM Services Facilities Management Dashboard With Repair Services And Work Orders Infographics PDF.

Infrastructure Monitoring Dashboard Structure PDF
This slide covers the dashboard which can be used to monitor the server count, geo activity, processor, memory space, network security, etc. Formulating a presentation can take up a lot of effort and time, so the content and message should always be the primary focus. The visuals of the PowerPoint can enhance the presenters message, so our Infrastructure Monitoring Dashboard Structure PDF was created to help save time. Instead of worrying about the design, the presenter can concentrate on the message while our designers work on creating the ideal templates for whatever situation is needed. Slidegeeks has experts for everything from amazing designs to valuable content, we have put everything into Infrastructure Monitoring Dashboard Structure PDF.
Transforming Business With AI Digital Media Tracking Dashboard Summary PDF
This slide covers the digital marketing dashboard along with the lead breakdown, google analytics traffic, and social media channels. Do you have to make sure that everyone on your team knows about any specific topic I yes, then you should give Transforming Business With AI Digital Media Tracking Dashboard Summary PDF a try. Our experts have put a lot of knowledge and effort into creating this impeccable Transforming Business With AI Digital Media Tracking Dashboard Summary PDF. You can use this template for your upcoming presentations, as the slides are perfect to represent even the tiniest detail. You can download these templates from the Slidegeeks website and these are easy to edit. So grab these today.
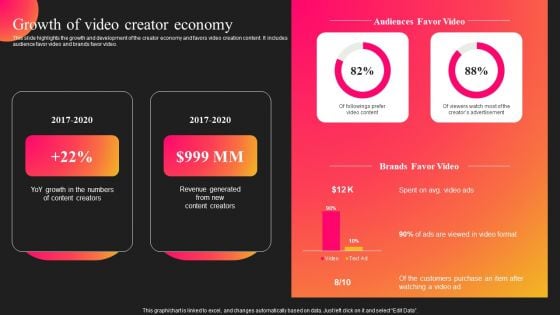
Curastory Editing Platform Pitch Deck Growth Of Video Creator Economy Template PDF
This slide highlights the growth and development of the creator economy and favors video creation content. It includes audience favor video and brands favor video. Coming up with a presentation necessitates that the majority of the effort goes into the content and the message you intend to convey. The visuals of a PowerPoint presentation can only be effective if it supplements and supports the story that is being told. Keeping this in mind our experts created Curastory Editing Platform Pitch Deck Growth Of Video Creator Economy Template PDF to reduce the time that goes into designing the presentation. This way, you can concentrate on the message while our designers take care of providing you with the right template for the situation.
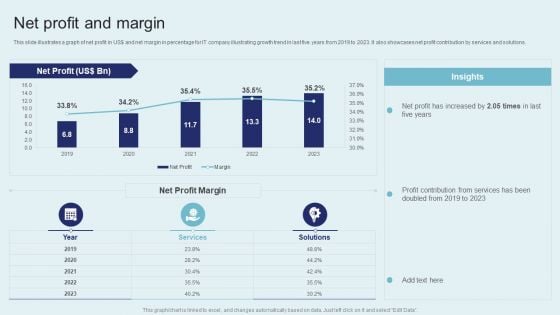
IT Firm Financial Statement Net Profit And Margin Slides PDF
This slide illustrates a graph of net profit in US dollar and net margin in percentage for IT company illustrating growth trend in last five years from 2019 to 2023. It also showcases net profit contribution by services and solutions. Do you have to make sure that everyone on your team knows about any specific topic I yes, then you should give IT Firm Financial Statement Net Profit And Margin Slides PDF a try. Our experts have put a lot of knowledge and effort into creating this impeccable IT Firm Financial Statement Net Profit And Margin Slides PDF. You can use this template for your upcoming presentations, as the slides are perfect to represent even the tiniest detail. You can download these templates from the Slidegeeks website and these are easy to edit. So grab these today.
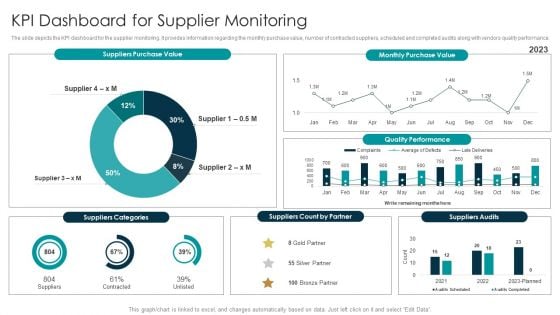
Tactical Approach For Vendor Reskilling KPI Dashboard For Supplier Monitoring Slides PDF
The slide depicts the KPI dashboard for the supplier monitoring. It provides information regarding the monthly purchase value, number of contracted suppliers, scheduled and completed audits along with vendors quality performance. Coming up with a presentation necessitates that the majority of the effort goes into the content and the message you intend to convey. The visuals of a PowerPoint presentation can only be effective if it supplements and supports the story that is being told. Keeping this in mind our experts created Tactical Approach For Vendor Reskilling KPI Dashboard For Supplier Monitoring Slides PDF to reduce the time that goes into designing the presentation. This way, you can concentrate on the message while our designers take care of providing you with the right template for the situation.
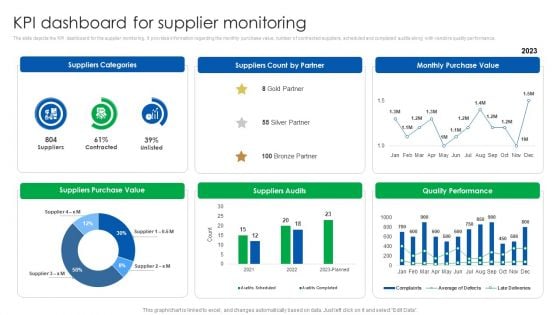
Vendor Relationship Management Strategic Plan KPI Dashboard For Supplier Monitoring Infographics PDF
The slide depicts the KPI dashboard for the supplier monitoring. It provides information regarding the monthly purchase value, number of contracted suppliers, scheduled and completed audits along with vendors quality performance. Coming up with a presentation necessitates that the majority of the effort goes into the content and the message you intend to convey. The visuals of a PowerPoint presentation can only be effective if it supplements and supports the story that is being told. Keeping this in mind our experts created Vendor Relationship Management Strategic Plan KPI Dashboard For Supplier Monitoring Infographics PDF to reduce the time that goes into designing the presentation. This way, you can concentrate on the message while our designers take care of providing you with the right template for the situation.
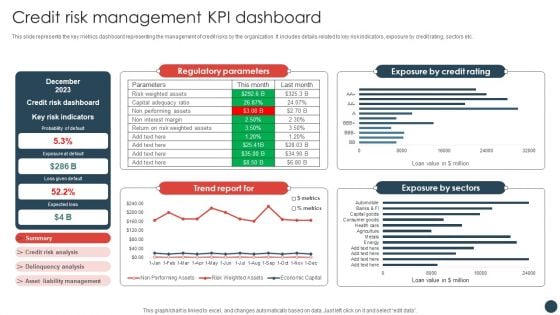
Strategic Risk Management Plan Credit Risk Management KPI Dashboard Information PDF
This slide represents the key metrics dashboard representing the management of credit risks by the organization. It includes details related to key risk indicators, exposure by credit rating, sectors etc.Coming up with a presentation necessitates that the majority of the effort goes into the content and the message you intend to convey. The visuals of a PowerPoint presentation can only be effective if it supplements and supports the story that is being told. Keeping this in mind our experts created Strategic Risk Management Plan Credit Risk Management KPI Dashboard Information PDF to reduce the time that goes into designing the presentation. This way, you can concentrate on the message while our designers take care of providing you with the right template for the situation.
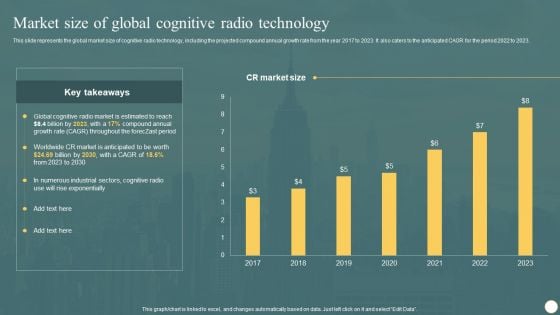
Cognitive Radio Network IT Market Size Of Global Cognitive Radio Technology Portrait PDF
This slide represents the global market size of cognitive radio technology, including the projected compound annual growth rate from the year 2017 to 2023. It also caters to the anticipated CAGR for the period 2022 to 2023. Want to ace your presentation in front of a live audience Our Cognitive Radio Network IT Market Size Of Global Cognitive Radio Technology Portrait PDF can help you do that by engaging all the users towards you. Slidegeeks experts have put their efforts and expertise into creating these impeccable powerpoint presentations so that you can communicate your ideas clearly. Moreover, all the templates are customizable, and easy to edit and downloadable. Use these for both personal and commercial use.
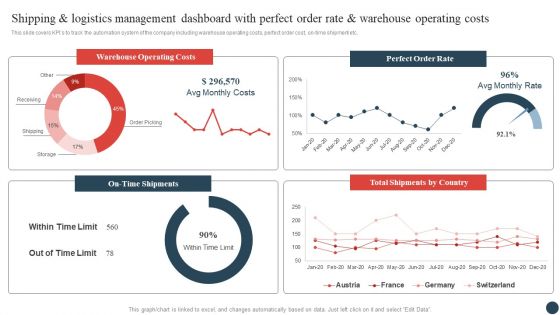
Shipping And Logistics Management Dashboard With Perfect Order Rate And Warehouse Operating Costs Topics PDF
This slide covers KPIs to track the automation system of the company including warehouse operating costs, perfect order cost, on-time shipment etc. Do you have to make sure that everyone on your team knows about any specific topic I yes, then you should give Shipping And Logistics Management Dashboard With Perfect Order Rate And Warehouse Operating Costs Topics PDF a try. Our experts have put a lot of knowledge and effort into creating this impeccable Shipping And Logistics Management Dashboard With Perfect Order Rate And Warehouse Operating Costs Topics PDF. You can use this template for your upcoming presentations, as the slides are perfect to represent even the tiniest detail. You can download these templates from the Slidegeeks website and these are easy to edit. So grab these today.
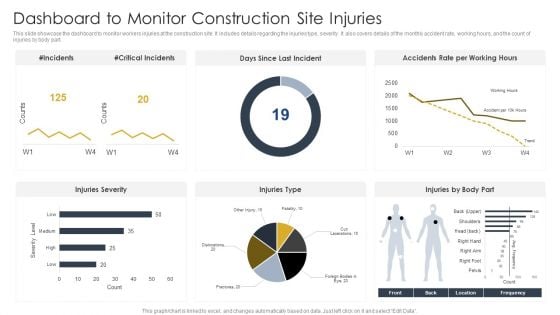
Dashboard To Monitor Construction Site Injuries Construction Site Safety Plan Elements PDF
This slide showcase the dashboard to monitor workers injuries at the construction site. It includes details regarding the injuries type, severity. It also covers details of the monthly accident rate, working hours, and the count of injuries by body part. Coming up with a presentation necessitates that the majority of the effort goes into the content and the message you intend to convey. The visuals of a PowerPoint presentation can only be effective if it supplements and supports the story that is being told. Keeping this in mind our experts created Dashboard To Monitor Construction Site Injuries Construction Site Safety Plan Elements PDF to reduce the time that goes into designing the presentation. This way, you can concentrate on the message while our designers take care of providing you with the right template for the situation.
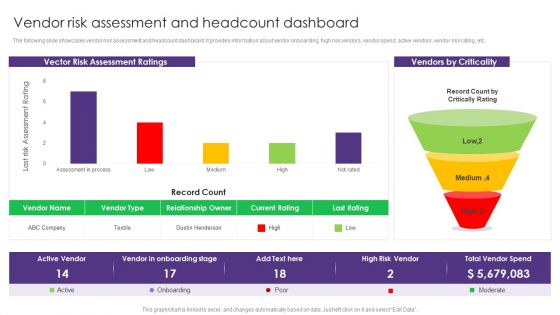
Vendor Risk Assessment And Headcount Dashboard Vendor Management System Deployment Elements PDF
The following slide showcases vendor risk assessment and headcount dashboard. It provides information about vendor onboarding, high risk vendors, vendor spend, active vendors, vendor risk rating, etc. Do you have to make sure that everyone on your team knows about any specific topic I yes, then you should give Vendor Risk Assessment And Headcount Dashboard Vendor Management System Deployment Elements PDF a try. Our experts have put a lot of knowledge and effort into creating this impeccable Vendor Risk Assessment And Headcount Dashboard Vendor Management System Deployment Elements PDF. You can use this template for your upcoming presentations, as the slides are perfect to represent even the tiniest detail. You can download these templates from the Slidegeeks website and these are easy to edit. So grab these today
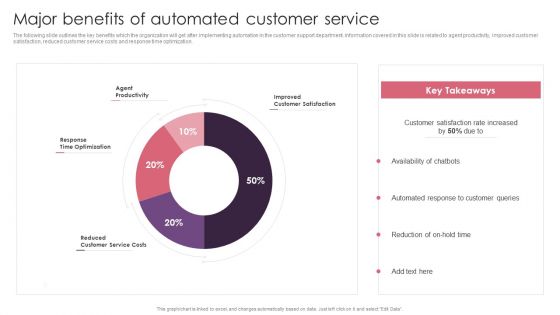
BPA Tools For Process Enhancement And Cost Minimization Major Benefits Of Automated Customer Service Clipart PDF
The following slide outlines the key benefits which the organization will get after implementing automation in the customer support department. Information covered in this slide is related to agent productivity, improved customer satisfaction, reduced customer service costs and response time optimization. Do you have to make sure that everyone on your team knows about any specific topic I yes, then you should give BPA Tools For Process Enhancement And Cost Minimization Major Benefits Of Automated Customer Service Clipart PDF a try. Our experts have put a lot of knowledge and effort into creating this impeccable BPA Tools For Process Enhancement And Cost Minimization Major Benefits Of Automated Customer Service Clipart PDF. You can use this template for your upcoming presentations, as the slides are perfect to represent even the tiniest detail. You can download these templates from the Slidegeeks website and these are easy to edit. So grab these today.
Online Ad Campaign Performance Tracking Dashboard Consumer Contact Point Guide Microsoft PDF
This slide covers the KPI dashboard for measuring digital campaign results. It includes metrics such as Ad cost, clicks, impressions, CTR, cost per click, conversions, conversion rate, cost per click, cost per thousand impressions, etc. Do you have to make sure that everyone on your team knows about any specific topic I yes, then you should give Online Ad Campaign Performance Tracking Dashboard Consumer Contact Point Guide Microsoft PDF a try. Our experts have put a lot of knowledge and effort into creating this impeccable Online Ad Campaign Performance Tracking Dashboard Consumer Contact Point Guide Microsoft PDF. You can use this template for your upcoming presentations, as the slides are perfect to represent even the tiniest detail. You can download these templates from the Slidegeeks website and these are easy to edit. So grab these today
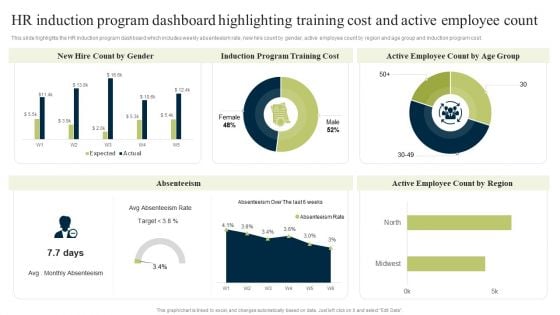
New Staff Onboarding Program HR Induction Program Dashboard Highlighting Training Cost And Active Employee Count Graphics PDF
This slide highlights the HR induction program dashboard which includes weekly absenteeism rate, new hire count by gender, active employee count by region and age group and induction program cost. Coming up with a presentation necessitates that the majority of the effort goes into the content and the message you intend to convey. The visuals of a PowerPoint presentation can only be effective if it supplements and supports the story that is being told. Keeping this in mind our experts created New Staff Onboarding Program HR Induction Program Dashboard Highlighting Training Cost And Active Employee Count Graphics PDF to reduce the time that goes into designing the presentation. This way, you can concentrate on the message while our designers take care of providing you with the right template for the situation.
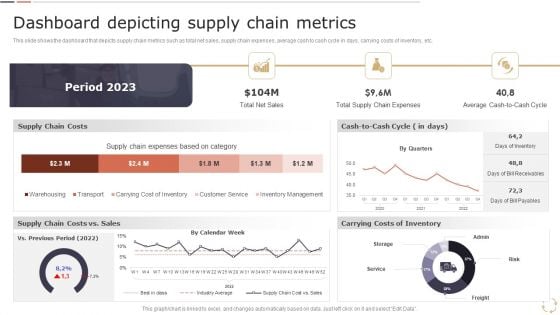
Optimizing Logistics Models To Enhance Supply Chain Management Dashboard Depicting Supply Chain Metrics Download PDF
This slide shows the dashboard that depicts supply chain metrics such as total net sales, supply chain expenses, average cash to cash cycle in days, carrying costs of inventory, etc. Coming up with a presentation necessitates that the majority of the effort goes into the content and the message you intend to convey. The visuals of a PowerPoint presentation can only be effective if it supplements and supports the story that is being told. Keeping this in mind our experts created Optimizing Logistics Models To Enhance Supply Chain Management Dashboard Depicting Supply Chain Metrics Download PDF to reduce the time that goes into designing the presentation. This way, you can concentrate on the message while our designers take care of providing you with the right template for the situation.
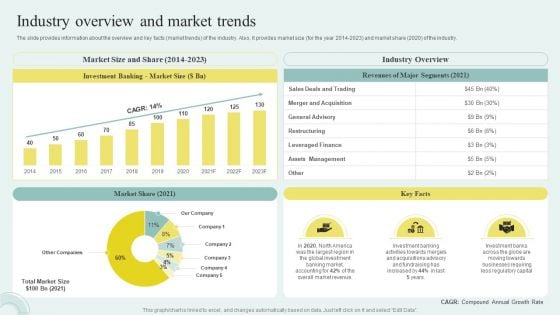
Sell Side M And A Pitchbook With Deal Overview Industry Overview And Market Trends Slides PDF
The slide provides information about the overview and key facts market trends of the industry. Also, it provides market size for the year 2014 2023 and market share 2020 of the industry. Formulating a presentation can take up a lot of effort and time, so the content and message should always be the primary focus. The visuals of the PowerPoint can enhance the presenters message, so our Sell Side M And A Pitchbook With Deal Overview Industry Overview And Market Trends Slides PDF was created to help save time. Instead of worrying about the design, the presenter can concentrate on the message while our designers work on creating the ideal templates for whatever situation is needed. Slidegeeks has experts for everything from amazing designs to valuable content, we have put everything into Sell Side M And A Pitchbook With Deal Overview Industry Overview And Market Trends Slides PDF.
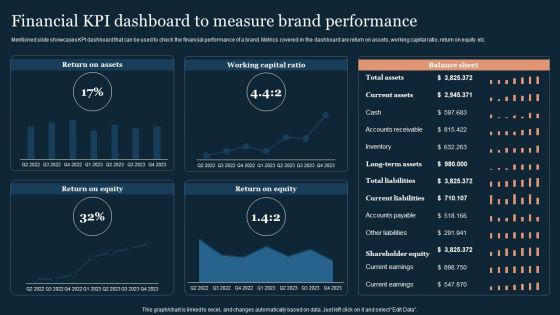
Guide To Develop And Estimate Brand Value Financial KPI Dashboard To Measure Brand Performance Formats PDF
Mentioned slide showcases KPI dashboard that can be used to check the financial performance of a brand. Metrics covered in the dashboard are return on assets, working capital ratio, return on equity etc.Coming up with a presentation necessitates that the majority of the effort goes into the content and the message you intend to convey. The visuals of a PowerPoint presentation can only be effective if it supplements and supports the story that is being told. Keeping this in mind our experts created Guide To Develop And Estimate Brand Value Financial KPI Dashboard To Measure Brand Performance Formats PDF to reduce the time that goes into designing the presentation. This way, you can concentrate on the message while our designers take care of providing you with the right template for the situation.
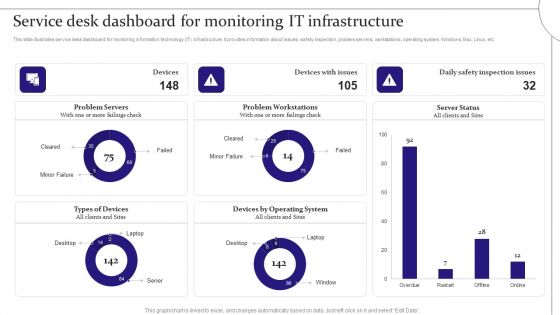
Service Desk Dashboard For Monitoring It Infrastructure Digitalization Of Service Desk Administration Ppt Summary Graphics Example PDF
This slide illustrates service desk dashboard for monitoring information technology IT infrastructure. It provides information about issues, safety inspection, problem servers, workstations, operating system, Windows, Mac, Linux, etc. Do you have to make sure that everyone on your team knows about any specific topic I yes, then you should give Service Desk Dashboard For Monitoring It Infrastructure Digitalization Of Service Desk Administration Ppt Summary Graphics Example PDF a try. Our experts have put a lot of knowledge and effort into creating this impeccable Service Desk Dashboard For Monitoring It Infrastructure Digitalization Of Service Desk Administration Ppt Summary Graphics Example PDF. You can use this template for your upcoming presentations, as the slides are perfect to represent even the tiniest detail. You can download these templates from the Slidegeeks website and these are easy to edit. So grab these today.
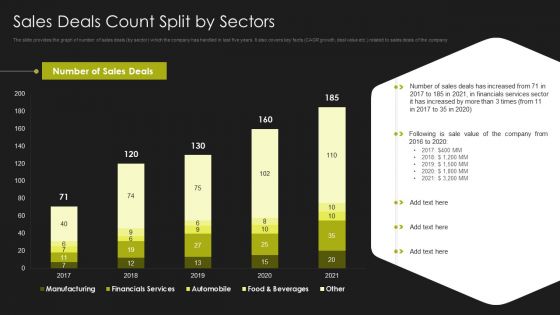
Selling Strategy And Operational Plan Sales Deals Count Split By Sectors Ppt Sample PDF
The slide provides the graph of number of sales deals by sector which the company has handled in last five years. It also covers key facts CAGR growth, deal value etc. related to sales deals of the company. Want to ace your presentation in front of a live audience. Our Selling Strategy And Operational Plan Sales Deals Count Split By Sectors Ppt Sample PDF can help you do that by engaging all the users towards you. Slidegeeks experts have put their efforts and expertise into creating these impeccable powerpoint presentations so that you can communicate your ideas clearly. Moreover, all the templates are customizable, and easy-to-edit and downloadable. Use these for both personal and commercial use.
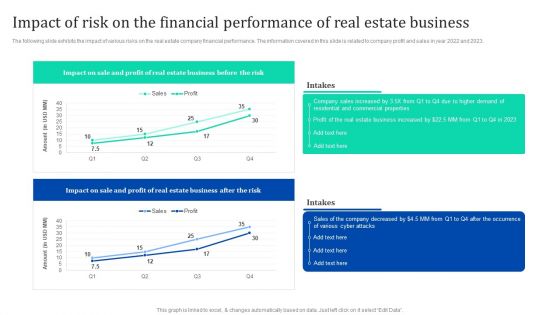
Impact Of Risk On The Financial Performance Of Real Estate Enhancing Process Improvement By Regularly Demonstration PDF
The following slide exhibits the impact of various risks on the real estate company financial performance. The information covered in this slide is related to company profit and sales in year 2022 and 2023. Formulating a presentation can take up a lot of effort and time, so the content and message should always be the primary focus. The visuals of the PowerPoint can enhance the presenters message, so our Impact Of Risk On The Financial Performance Of Real Estate Enhancing Process Improvement By Regularly Demonstration PDF was created to help save time. Instead of worrying about the design, the presenter can concentrate on the message while our designers work on creating the ideal templates for whatever situation is needed. Slidegeeks has experts for everything from amazing designs to valuable content, we have put everything into Impact Of Risk On The Financial Performance Of Real Estate Enhancing Process Improvement By Regularly Demonstration PDF
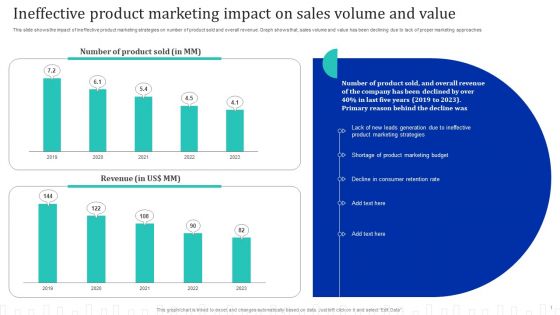
Approach Optimization For Brand Promotion Strategy Ineffective Product Marketing Impact On Sales Designs PDF
This slide shows the impact of ineffective product marketing strategies on number of product sold and overall revenue. Graph shows that, sales volume and value has been declining due to lack of proper marketing approaches.Do you have to make sure that everyone on your team knows about any specific topic I yes, then you should give Approach Optimization For Brand Promotion Strategy Ineffective Product Marketing Impact On Sales Designs PDF a try. Our experts have put a lot of knowledge and effort into creating this impeccable Approach Optimization For Brand Promotion Strategy Ineffective Product Marketing Impact On Sales Designs PDF. You can use this template for your upcoming presentations, as the slides are perfect to represent even the tiniest detail. You can download these templates from the Slidegeeks website and these are easy to edit. So grab these today.
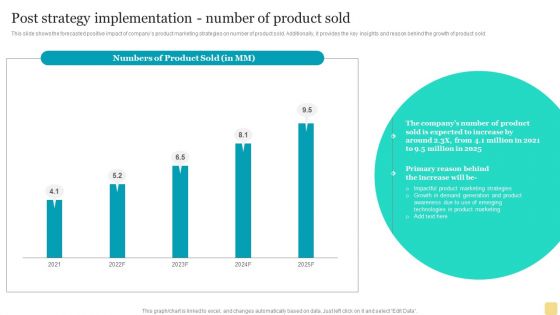
Product Marketing Plan To Enhance Organizational Growth Post Strategy Implementation Number Of Product Sold Clipart PDF
This slide shows the forecasted positive impact of companys product marketing strategies on number of product sold. Additionally, it provides the key insights and reason behind the growth of product sold.Formulating a presentation can take up a lot of effort and time, so the content and message should always be the primary focus. The visuals of the PowerPoint can enhance the presenters message, so our Product Marketing Plan To Enhance Organizational Growth Post Strategy Implementation Number Of Product Sold Clipart PDF was created to help save time. Instead of worrying about the design, the presenter can concentrate on the message while our designers work on creating the ideal templates for whatever situation is needed. Slidegeeks has experts for everything from amazing designs to valuable content, we have put everything into Product Marketing Plan To Enhance Organizational Growth Post Strategy Implementation Number Of Product Sold Clipart PDF.
New Product Launch To Market Playbook Overall Product Management Activities Tracking Dashboard Ideas PDF
This slide provides information regarding essential product management activities tracking dashboard in terms of project budget, workload, overdue tasks, upcoming deadlines, project launch date, etc. Do you have to make sure that everyone on your team knows about any specific topic I yes, then you should give New Product Launch To Market Playbook Overall Product Management Activities Tracking Dashboard Ideas PDF a try. Our experts have put a lot of knowledge and effort into creating this impeccable New Product Launch To Market Playbook Overall Product Management Activities Tracking Dashboard Ideas PDF. You can use this template for your upcoming presentations, as the slides are perfect to represent even the tiniest detail. You can download these templates from the Slidegeeks website and these are easy to edit. So grab these today.
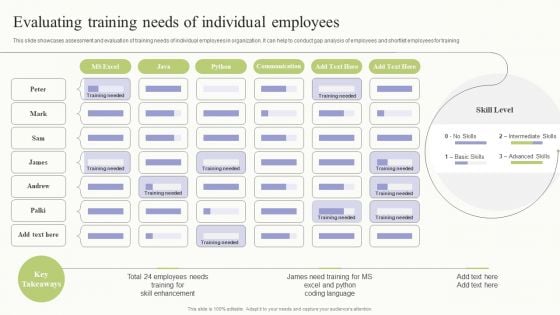
Workplace Training Techniques For Departments And Individual Staff Evaluating Training Needs Of Individual Employees Download PDF
This slide showcases assessment and evaluation of training needs of individual employees in organization. It can help to conduct gap analysis of employees and shortlist employees for training. Do you have to make sure that everyone on your team knows about any specific topic I yes, then you should give Workplace Training Techniques For Departments And Individual Staff Evaluating Training Needs Of Individual Employees Download PDF a try. Our experts have put a lot of knowledge and effort into creating this impeccable Workplace Training Techniques For Departments And Individual Staff Evaluating Training Needs Of Individual Employees Download PDF. You can use this template for your upcoming presentations, as the slides are perfect to represent even the tiniest detail. You can download these templates from the Slidegeeks website and these are easy to edit. So grab these today.
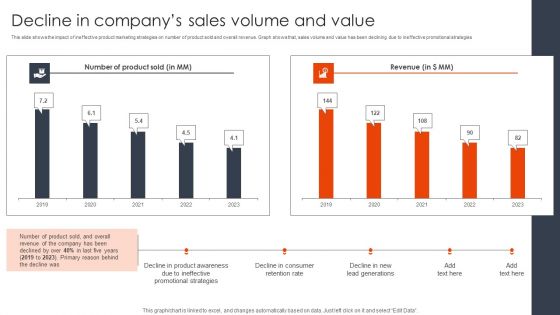
Decline In Companys Sales Volume And Value Client Acquisition Techniques To Boost Sales Slides PDF
This slide shows the impact of ineffective product marketing strategies on number of product sold and overall revenue. Graph shows that, sales volume and value has been declining due to ineffective promotional strategies. Do you have to make sure that everyone on your team knows about any specific topic I yes, then you should give Decline In Companys Sales Volume And Value Client Acquisition Techniques To Boost Sales Slides PDF a try. Our experts have put a lot of knowledge and effort into creating this impeccable Decline In Companys Sales Volume And Value Client Acquisition Techniques To Boost Sales Slides PDF. You can use this template for your upcoming presentations, as the slides are perfect to represent even the tiniest detail. You can download these templates from the Slidegeeks website and these are easy to edit. So grab these today.
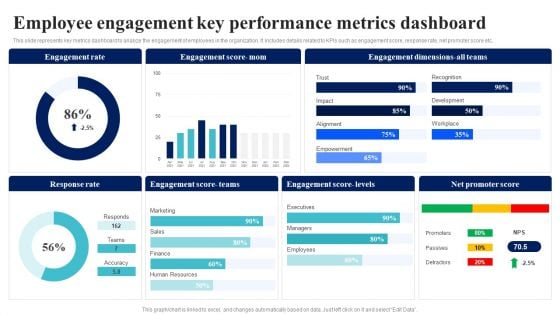
BI Implementation To Enhance Hiring Process Employee Engagement Key Performance Metrics Dashboard Ideas PDF
This slide represents key metrics dashboard to analyze the engagement of employees in the organization. It includes details related to KPIs such as engagement score, response rate, net promoter score etc.Formulating a presentation can take up a lot of effort and time, so the content and message should always be the primary focus. The visuals of the PowerPoint can enhance the presenters message, so our BI Implementation To Enhance Hiring Process Employee Engagement Key Performance Metrics Dashboard Ideas PDF was created to help save time. Instead of worrying about the design, the presenter can concentrate on the message while our designers work on creating the ideal templates for whatever situation is needed. Slidegeeks has experts for everything from amazing designs to valuable content, we have put everything into BI Implementation To Enhance Hiring Process Employee Engagement Key Performance Metrics Dashboard Ideas PDF.
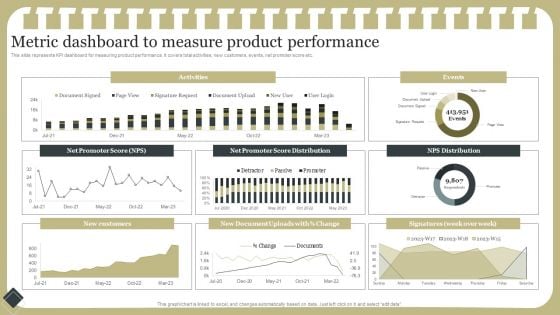
Effective Product Development Strategy Metric Dashboard To Measure Product Performance Information PDF
This slide represents KPI dashboard for measuring product performance. It covers total activities, new customers, events, net promoter score etc.Coming up with a presentation necessitates that the majority of the effort goes into the content and the message you intend to convey. The visuals of a PowerPoint presentation can only be effective if it supplements and supports the story that is being told. Keeping this in mind our experts created Effective Product Development Strategy Metric Dashboard To Measure Product Performance Information PDF to reduce the time that goes into designing the presentation. This way, you can concentrate on the message while our designers take care of providing you with the right template for the situation.
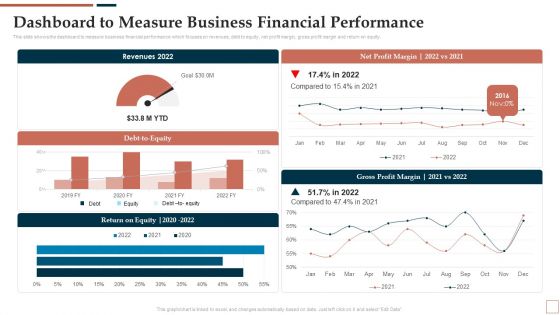
BPR To Develop Operational Effectiveness Dashboard To Measure Business Financial Performance Elements PDF
This slide shows the dashboard to measure business financial performance which focuses on revenues, debt to equity, net profit margin, gross profit margin and return on equity. Coming up with a presentation necessitates that the majority of the effort goes into the content and the message you intend to convey. The visuals of a PowerPoint presentation can only be effective if it supplements and supports the story that is being told. Keeping this in mind our experts created BPR To Develop Operational Effectiveness Dashboard To Measure Business Financial Performance Elements PDF to reduce the time that goes into designing the presentation. This way, you can concentrate on the message while our designers take care of providing you with the right template for the situation.
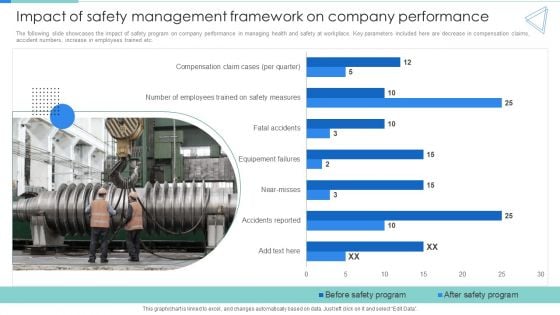
Impact Of Safety Management Framework On Company Performance Clipart PDF
The following slide showcases the impact of safety program on company performance in managing health and safety at workplace. Key parameters included here are decrease in compensation claims, accident numbers, increase in employees trained etc. Do you have to make sure that everyone on your team knows about any specific topic I yes, then you should give Impact Of Safety Management Framework On Company Performance Clipart PDF a try. Our experts have put a lot of knowledge and effort into creating this impeccable Impact Of Safety Management Framework On Company Performance Clipart PDF. You can use this template for your upcoming presentations, as the slides are perfect to represent even the tiniest detail. You can download these templates from the Slidegeeks website and these are easy to edit. So grab these today.
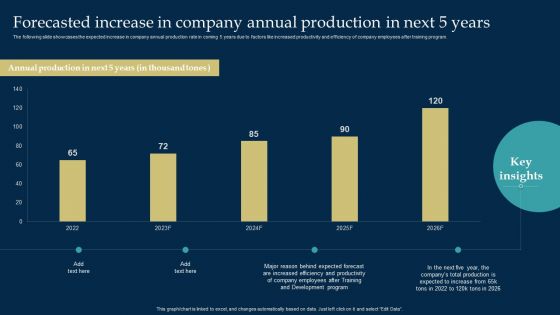
Employee Training And Development Strategy Forecasted Increase In Company Annual Production In Next 5 Years Download PDF
The following slide showcases the expected increase in company annual production rate in coming 5 years due to factors like increased productivity and efficiency of company employees after training program. Do you have to make sure that everyone on your team knows about any specific topic I yes, then you should give Employee Training And Development Strategy Forecasted Increase In Company Annual Production In Next 5 Years Download PDF a try. Our experts have put a lot of knowledge and effort into creating this impeccable Employee Training And Development Strategy Forecasted Increase In Company Annual Production In Next 5 Years Download PDF. You can use this template for your upcoming presentations, as the slides are perfect to represent even the tiniest detail. You can download these templates from the Slidegeeks website and these are easy to edit. So grab these today.
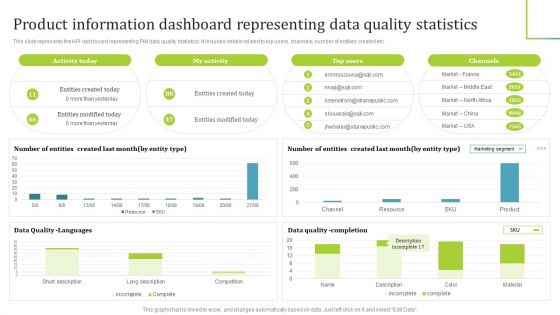
PIM Software Deployment To Enhance Conversion Rates Product Information Dashboard Representing Data Quality Statistics Download PDF
This slide represents the KPI dashboard representing PIM data quality statistics. It includes details related to top users, channels, number of entities created etc. Coming up with a presentation necessitates that the majority of the effort goes into the content and the message you intend to convey. The visuals of a PowerPoint presentation can only be effective if it supplements and supports the story that is being told. Keeping this in mind our experts created PIM Software Deployment To Enhance Conversion Rates Product Information Dashboard Representing Data Quality Statistics Download PDF to reduce the time that goes into designing the presentation. This way, you can concentrate on the message while our designers take care of providing you with the right template for the situation.

PIM Software Deployment To Enhance Conversion Rates Survey Insights On Top Tools Currently Used In PIM Suites Information PDF
This slide represents the results of survey conducted to identify and analyze the tools mostly used in PIM suites. It includes details related to usage of tools used in PIM suites such as spreadsheets, ERP applications etc. Do you have to make sure that everyone on your team knows about any specific topic I yes, then you should give PIM Software Deployment To Enhance Conversion Rates Survey Insights On Top Tools Currently Used In PIM Suites Information PDF a try. Our experts have put a lot of knowledge and effort into creating this impeccable PIM Software Deployment To Enhance Conversion Rates Survey Insights On Top Tools Currently Used In PIM Suites Information PDF. You can use this template for your upcoming presentations, as the slides are perfect to represent even the tiniest detail. You can download these templates from the Slidegeeks website and these are easy to edit. So grab these today.
Elastic NLB Network Load Balancers Performance Tracker Dashboard Background PDF
This slide shows the dashboard for tracking the network load balancers performance by covering details of balancer status, balancer session, balancer throughput, etc. Coming up with a presentation necessitates that the majority of the effort goes into the content and the message you intend to convey. The visuals of a PowerPoint presentation can only be effective if it supplements and supports the story that is being told. Keeping this in mind our experts created Elastic NLB Network Load Balancers Performance Tracker Dashboard Background PDF to reduce the time that goes into designing the presentation. This way, you can concentrate on the message while our designers take care of providing you with the right template for the situation.
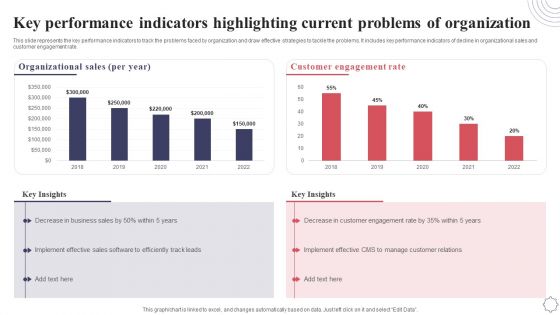
Key Performance Indicators Highlighting Current Problems Of Organization Application Deployment Project Plan Rules PDF
This slide represents the key performance indicators to track the problems faced by organization and draw effective strategies to tackle the problems. It includes key performance indicators of decline in organizational sales and customer engagement rate. Coming up with a presentation necessitates that the majority of the effort goes into the content and the message you intend to convey. The visuals of a PowerPoint presentation can only be effective if it supplements and supports the story that is being told. Keeping this in mind our experts created Key Performance Indicators Highlighting Current Problems Of Organization Application Deployment Project Plan Rules PDF to reduce the time that goes into designing the presentation. This way, you can concentrate on the message while our designers take care of providing you with the right template for the situation.
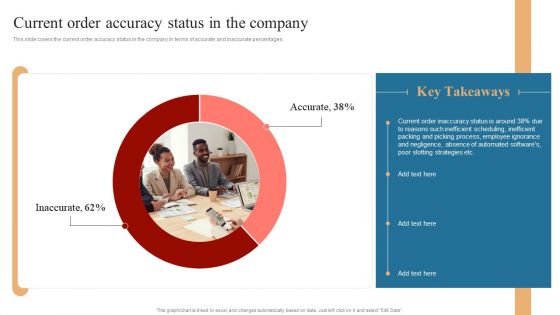
Strategies To Maintain Transportation Current Order Accuracy Status In The Company Ppt Summary Graphics PDF
This slide covers the current order accuracy status in the company in terms of accurate and inaccurate percentages. Do you have to make sure that everyone on your team knows about any specific topic. I yes, then you should give Strategies To Maintain Transportation Current Order Accuracy Status In The Company Ppt Summary Graphics PDF a try. Our experts have put a lot of knowledge and effort into creating this impeccable Strategies To Maintain Transportation Current Order Accuracy Status In The Company Ppt Summary Graphics PDF. You can use this template for your upcoming presentations, as the slides are perfect to represent even the tiniest detail. You can download these templates from the Slidegeeks website and these are easy to edit. So grab these today.
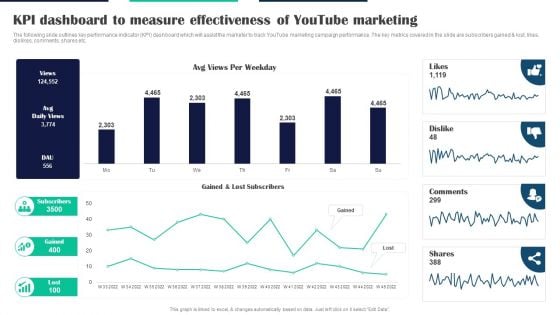
Executing Video Promotional KPI Dashboard To Measure Effectiveness Of Youtube Marketing Professional PDF
The following slide outlines key performance indicator KPI dashboard which will assist the marketer to track YouTube marketing campaign performance. The key metrics covered in the slide are subscribers gained and lost, likes, dislikes, comments, shares etc. Formulating a presentation can take up a lot of effort and time, so the content and message should always be the primary focus. The visuals of the PowerPoint can enhance the presenters message, so our Executing Video Promotional KPI Dashboard To Measure Effectiveness Of Youtube Marketing Professional PDF was created to help save time. Instead of worrying about the design, the presenter can concentrate on the message while our designers work on creating the ideal templates for whatever situation is needed. Slidegeeks has experts for everything from amazing designs to valuable content, we have put everything into Executing Video Promotional KPI Dashboard To Measure Effectiveness Of Youtube Marketing Professional PDF
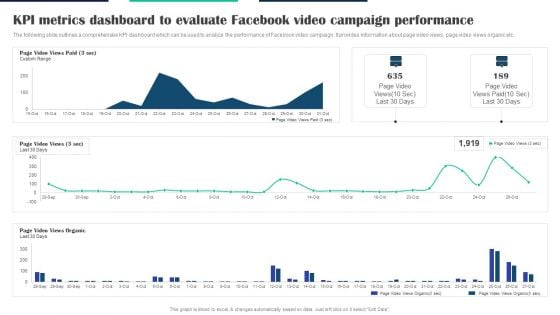
Executing Video Promotional KPI Metrics Dashboard To Evaluate Facebook Video Campaign Summary PDF
The following slide outlines a comprehensive KPI dashboard which can be used to analyze the performance of Facebook video campaign. It provides information about page video views, page video views organic etc. Coming up with a presentation necessitates that the majority of the effort goes into the content and the message you intend to convey. The visuals of a PowerPoint presentation can only be effective if it supplements and supports the story that is being told. Keeping this in mind our experts created Executing Video Promotional KPI Metrics Dashboard To Evaluate Facebook Video Campaign Summary PDF to reduce the time that goes into designing the presentation. This way, you can concentrate on the message while our designers take care of providing you with the right template for the situation.
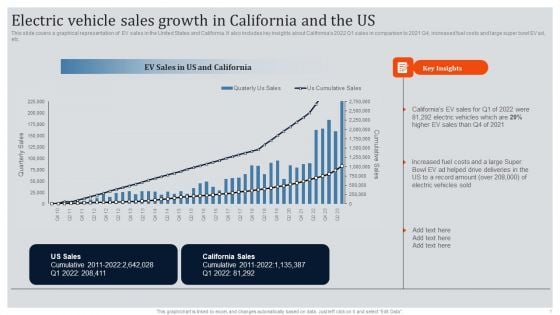
Global Automotive Industry Research And Analysis Electric Vehicle Sales Growth In California And The US Clipart PDF
This slide covers a graphical representation of EV sales in the United States and California. It also includes key insights about Californias 2022 Q1 sales in comparison to 2021 Q4, increased fuel costs and large super bowl EV ad, etc. Do you have to make sure that everyone on your team knows about any specific topic. I yes, then you should give Global Automotive Industry Research And Analysis Electric Vehicle Sales Growth In California And The US Clipart PDF a try. Our experts have put a lot of knowledge and effort into creating this impeccable Global Automotive Industry Research And Analysis Electric Vehicle Sales Growth In California And The US Clipart PDF. You can use this template for your upcoming presentations, as the slides are perfect to represent even the tiniest detail. You can download these templates from the Slidegeeks website and these are easy to edit. So grab these today.
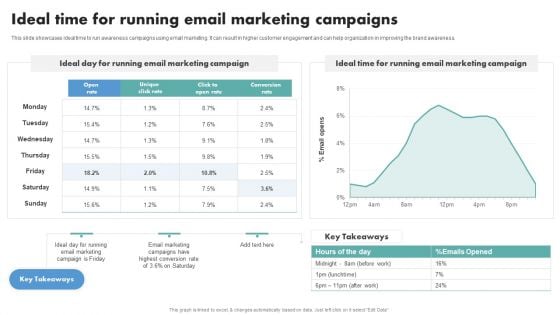
Techniques To Boost Brand Awareness Ideal Time For Running Email Marketing Campaigns Ideas PDF
This slide showcases ideal time to run awareness campaigns using email marketing. It can result in higher customer engagement and can help organization in improving the brand awareness. Coming up with a presentation necessitates that the majority of the effort goes into the content and the message you intend to convey. The visuals of a PowerPoint presentation can only be effective if it supplements and supports the story that is being told. Keeping this in mind our experts created Techniques To Boost Brand Awareness Ideal Time For Running Email Marketing Campaigns Ideas PDF to reduce the time that goes into designing the presentation. This way, you can concentrate on the message while our designers take care of providing you with the right template for the situation.

Social Networks Marketing To Improve Survey Insights On Social Media Platforms Used Rules PDF
This slide represents details related survey conducted for analyzing and identifying the social media networks mostly used by marketers to promote their brands over social media. It includes usage of social media platforms such as Facebook, Instagram etc. by marketers for social media advertising. Want to ace your presentation in front of a live audience Our Social Networks Marketing To Improve Survey Insights On Social Media Platforms Used Rules PDF can help you do that by engaging all the users towards you.. Slidegeeks experts have put their efforts and expertise into creating these impeccable powerpoint presentations so that you can communicate your ideas clearly. Moreover, all the templates are customizable, and easy-to-edit and downloadable. Use these for both personal and commercial use.
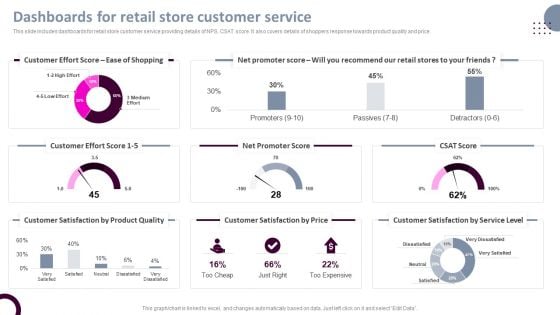
Retail Store Operations Dashboards For Retail Store Customer Service Pictures PDF
This slide includes dashboards for retail store customer service providing details of NPS, CSAT score. It also covers details of shoppers response towards product quality and price. Formulating a presentation can take up a lot of effort and time, so the content and message should always be the primary focus. The visuals of the PowerPoint can enhance the presenters message, so our Retail Store Operations Dashboards For Retail Store Customer Service Pictures PDF was created to help save time. Instead of worrying about the design, the presenter can concentrate on the message while our designers work on creating the ideal templates for whatever situation is needed. Slidegeeks has experts for everything from amazing designs to valuable content, we have put everything into Retail Store Operations Dashboards For Retail Store Customer Service Pictures PDF
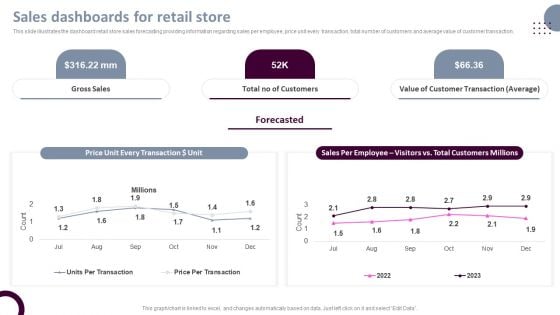
Retail Store Operations Sales Dashboards For Retail Store Structure PDF
This slide illustrates the dashboard retail store sales forecasting providing information regarding sales per employee, price unit every transaction, total number of customers and average value of customer transaction. Coming up with a presentation necessitates that the majority of the effort goes into the content and the message you intend to convey. The visuals of a PowerPoint presentation can only be effective if it supplements and supports the story that is being told. Keeping this in mind our experts created Retail Store Operations Sales Dashboards For Retail Store Structure PDF to reduce the time that goes into designing the presentation. This way, you can concentrate on the message while our designers take care of providing you with the right template for the situation.
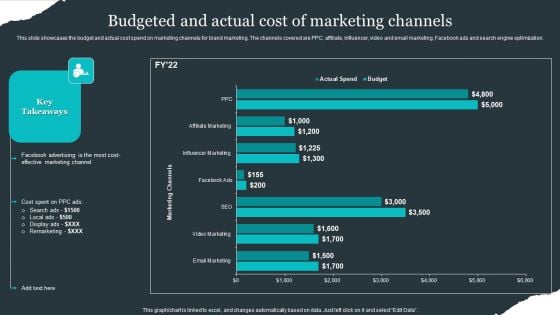
Retail Apparel Online Budgeted And Actual Cost Of Marketing Channels Infographics PDF
This slide showcases the budget and actual cost spend on marketing channels for brand marketing. The channels covered are PPC, affiliate, influencer, video and email marketing, Facebook ads and search engine optimization. Do you have to make sure that everyone on your team knows about any specific topic I yes, then you should give Retail Apparel Online Budgeted And Actual Cost Of Marketing Channels Infographics PDF a try. Our experts have put a lot of knowledge and effort into creating this impeccable Retail Apparel Online Budgeted And Actual Cost Of Marketing Channels Infographics PDF. You can use this template for your upcoming presentations, as the slides are perfect to represent even the tiniest detail. You can download these templates from the Slidegeeks website and these are easy to edit. So grab these today
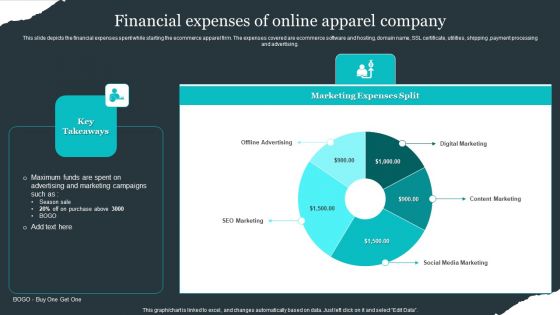
Retail Apparel Online Financial Expenses Of Online Apparel Company Slides PDF
This slide depicts the financial expenses spent while starting the ecommerce apparel firm. The expenses covered are ecommerce software and hosting, domain name, SSL certificate, utilities, shipping ,payment processing and advertising. Formulating a presentation can take up a lot of effort and time, so the content and message should always be the primary focus. The visuals of the PowerPoint can enhance the presenters message, so our Retail Apparel Online Financial Expenses Of Online Apparel Company Slides PDF was created to help save time. Instead of worrying about the design, the presenter can concentrate on the message while our designers work on creating the ideal templates for whatever situation is needed. Slidegeeks has experts for everything from amazing designs to valuable content, we have put everything into Retail Apparel Online Financial Expenses Of Online Apparel Company Slides PDF
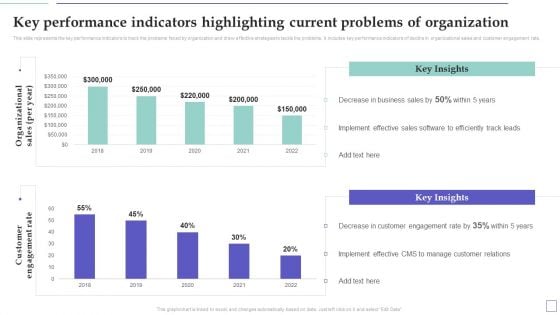
System Deployment Project Key Performance Indicators Highlighting Current Problems Information PDF
This slide represents the key performance indicators to track the problems faced by organization and draw effective strategies to tackle the problems. It includes key performance indicators of decline in organizational sales and customer engagement rate. Coming up with a presentation necessitates that the majority of the effort goes into the content and the message you intend to convey. The visuals of a PowerPoint presentation can only be effective if it supplements and supports the story that is being told. Keeping this in mind our experts created System Deployment Project Key Performance Indicators Highlighting Current Problems Information PDF to reduce the time that goes into designing the presentation. This way, you can concentrate on the message while our designers take care of providing you with the right template for the situation.
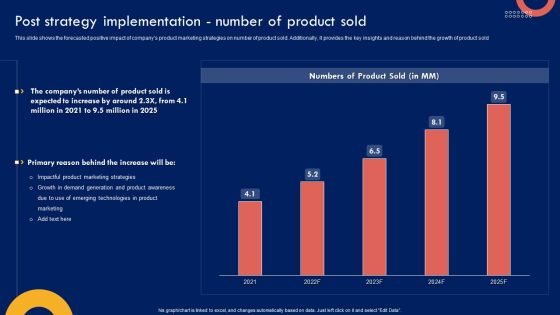
Product Marketing Leadership Post Strategy Implementation Number Of Product Sold Download PDF
This slide shows the forecasted positive impact of companys product marketing strategies on number of product sold. Additionally, it provides the key insights and reason behind the growth of product sold. Formulating a presentation can take up a lot of effort and time, so the content and message should always be the primary focus. The visuals of the PowerPoint can enhance the presenters message, so our Product Marketing Leadership Post Strategy Implementation Number Of Product Sold Download PDF was created to help save time. Instead of worrying about the design, the presenter can concentrate on the message while our designers work on creating the ideal templates for whatever situation is needed. Slidegeeks has experts for everything from amazing designs to valuable content, we have put everything into Product Marketing Leadership Post Strategy Implementation Number Of Product Sold Download PDF
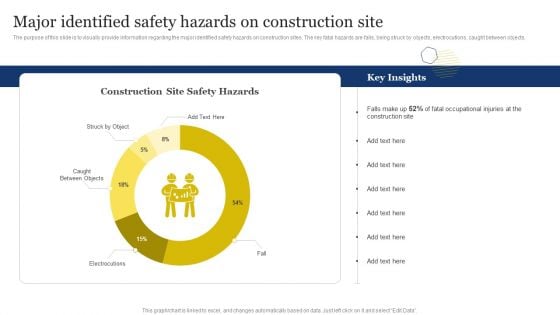
Improvement Of Safety Performance At Construction Site Major Identified Safety Hazards Topics PDF
The purpose of this slide is to visually provide information regarding the major identified safety hazards on construction sites. The key fatal hazards are falls, being struck by objects, electrocutions, caught between objects. Formulating a presentation can take up a lot of effort and time, so the content and message should always be the primary focus. The visuals of the PowerPoint can enhance the presenters message, so our Improvement Of Safety Performance At Construction Site Major Identified Safety Hazards Topics PDF was created to help save time. Instead of worrying about the design, the presenter can concentrate on the message while our designers work on creating the ideal templates for whatever situation is needed. Slidegeeks has experts for everything from amazing designs to valuable content, we have put everything into Improvement Of Safety Performance At Construction Site Major Identified Safety Hazards Topics PDF
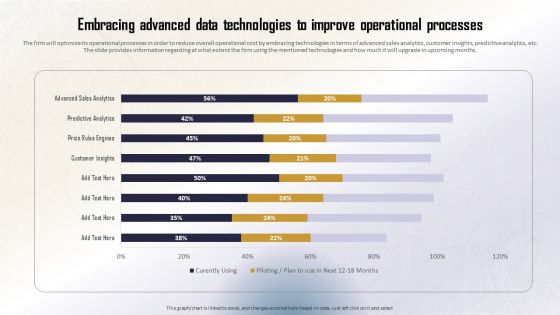
Identifying Direct And Indirect Embracing Advanced Data Technologies To Improve Guidelines PDF
The firm will optimize its operational processes in order to reduce overall operational cost by embracing technologies in terms of advanced sales analytics, customer insights, predictive analytics, etc. The slide provides information regarding at what extent the firm using the mentioned technologies and how much it will upgrade in upcoming months. Formulating a presentation can take up a lot of effort and time, so the content and message should always be the primary focus. The visuals of the PowerPoint can enhance the presenters message, so our Identifying Direct And Indirect Embracing Advanced Data Technologies To Improve Guidelines PDF was created to help save time. Instead of worrying about the design, the presenter can concentrate on the message while our designers work on creating the ideal templates for whatever situation is needed. Slidegeeks has experts for everything from amazing designs to valuable content, we have put everything into Identifying Direct And Indirect Embracing Advanced Data Technologies To Improve Guidelines PDF
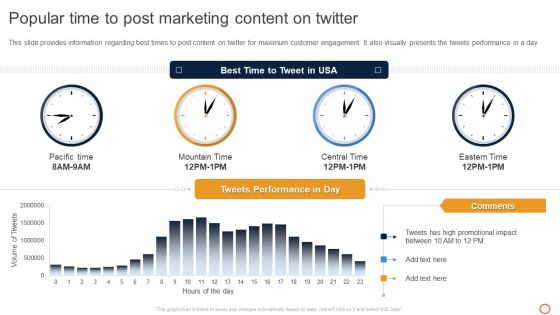
Leveraging Twitter For Social Popular Time To Post Marketing Content On Twitter Pictures PDF
This slide provides information regarding best times to post content on twitter for maximum customer engagement. It also visually presents the tweets performance in a day. Formulating a presentation can take up a lot of effort and time, so the content and message should always be the primary focus. The visuals of the PowerPoint can enhance the presenters message, so our Leveraging Twitter For Social Popular Time To Post Marketing Content On Twitter Pictures PDF was created to help save time. Instead of worrying about the design, the presenter can concentrate on the message while our designers work on creating the ideal templates for whatever situation is needed. Slidegeeks has experts for everything from amazing designs to valuable content, we have put everything into Leveraging Twitter For Social Popular Time To Post Marketing Content On Twitter Pictures PDF
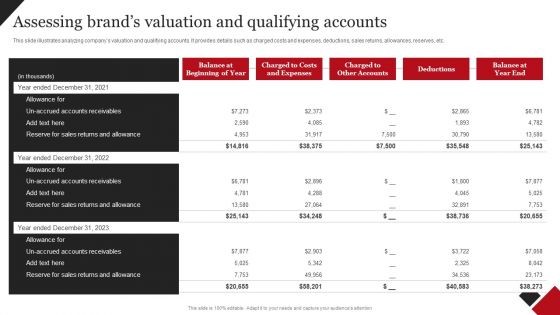
Coca Cola Emotional Marketing Strategy Assessing Brands Valuation And Qualifying Mockup PDF
The following slide includes statistics illustrating revenue highlights of brand by product line and geographies. It provides information about North America, Asia Pacific and Latin America ALPA, Greater China, EMEA Europe, Middle East and Africa, footwear, apparel, etc. Want to ace your presentation in front of a live audience Our Coca Cola Emotional Marketing Strategy Assessing Brands Valuation And Qualifying Mockup PDF can help you do that by engaging all the users towards you. Slidegeeks experts have put their efforts and expertise into creating these impeccable powerpoint presentations so that you can communicate your ideas clearly. Moreover, all the templates are customizable, and easy-to-edit and downloadable. Use these for both personal and commercial use.
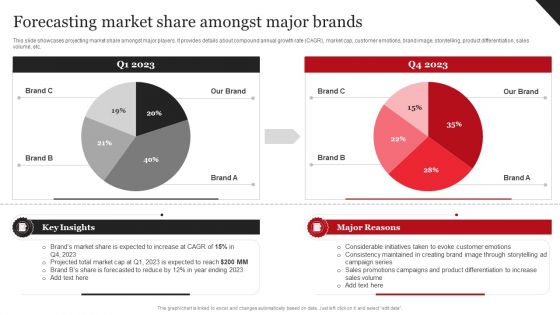
Coca Cola Emotional Marketing Strategy Forecasting Market Share Amongst Major Brands Pictures PDF
This slide showcases projecting market share amongst major players. It provides details about compound annual growth rate CAGR, market cap, customer emotions, brand image, storytelling, product differentiation, sales volume, etc. Coming up with a presentation necessitates that the majority of the effort goes into the content and the message you intend to convey. The visuals of a PowerPoint presentation can only be effective if it supplements and supports the story that is being told. Keeping this in mind our experts created Coca Cola Emotional Marketing Strategy Forecasting Market Share Amongst Major Brands Pictures PDF to reduce the time that goes into designing the presentation. This way, you can concentrate on the message while our designers take care of providing you with the right template for the situation.
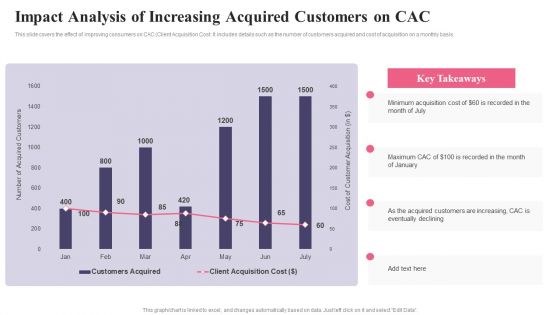
Comprehensive Guide To Acquire Customers Impact Analysis Of Increasing Acquired Designs PDF
This slide covers the effect of improving consumers on CAC Client Acquisition Cost. It includes details such as the number of customers acquired and cost of acquisition on a monthly basis.Formulating a presentation can take up a lot of effort and time, so the content and message should always be the primary focus. The visuals of the PowerPoint can enhance the presenters message, so our Comprehensive Guide To Acquire Customers Impact Analysis Of Increasing Acquired Designs PDF was created to help save time. Instead of worrying about the design, the presenter can concentrate on the message while our designers work on creating the ideal templates for whatever situation is needed. Slidegeeks has experts for everything from amazing designs to valuable content, we have put everything into Comprehensive Guide To Acquire Customers Impact Analysis Of Increasing Acquired Designs PDF
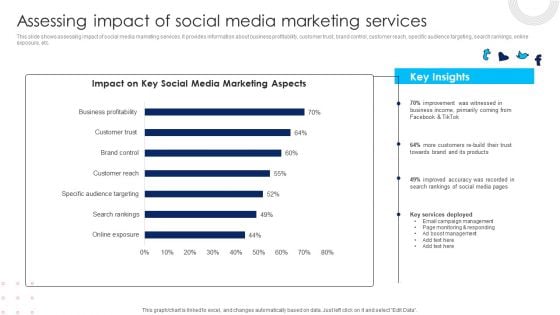
Using Social Media Platforms To Enhance Assessing Impact Of Social Media Marketing Services Portrait PDF
This slide shows assessing impact of social media marketing services. It provides information about business profitability, customer trust, brand control, customer reach, specific audience targeting, search rankings, online exposure, etc. Do you have to make sure that everyone on your team knows about any specific topic I yes, then you should give Using Social Media Platforms To Enhance Assessing Impact Of Social Media Marketing Services Portrait PDF a try. Our experts have put a lot of knowledge and effort into creating this impeccable Using Social Media Platforms To Enhance Assessing Impact Of Social Media Marketing Services Portrait PDF. You can use this template for your upcoming presentations, as the slides are perfect to represent even the tiniest detail. You can download these templates from the Slidegeeks website and these are easy to edit. So grab these today.
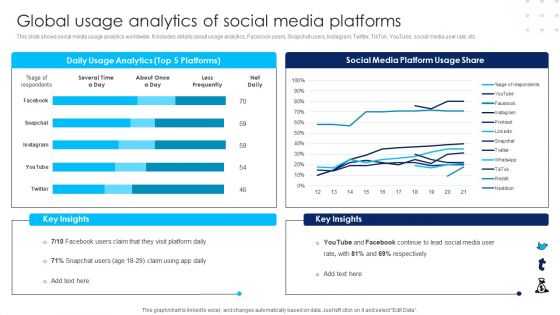
Using Social Media Platforms To Enhance Global Usage Analytics Of Social Media Platforms Rules PDF
This slide shows social media usage analytics worldwide. It includes details about usage analytics, Facebook users, Snapchat users, Instagram, Twitter, TikTok, YouTube, social media user rate, etc. Formulating a presentation can take up a lot of effort and time, so the content and message should always be the primary focus. The visuals of the PowerPoint can enhance the presenters message, so our Using Social Media Platforms To Enhance Global Usage Analytics Of Social Media Platforms Rules PDF was created to help save time. Instead of worrying about the design, the presenter can concentrate on the message while our designers work on creating the ideal templates for whatever situation is needed. Slidegeeks has experts for everything from amazing designs to valuable content, we have put everything into Using Social Media Platforms To Enhance Global Usage Analytics Of Social Media Platforms Rules PDF.
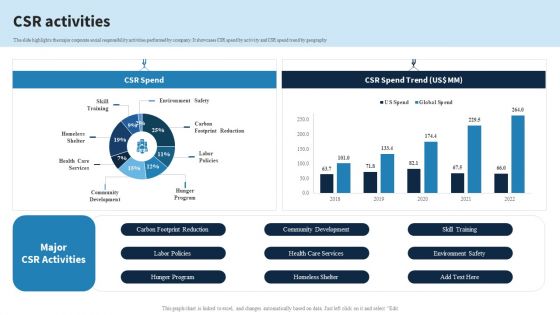
Engineering Services Company Report Csr Activities Ppt PowerPoint Presentation File Information PDF
The slide highlights the major corporate social responsibility activities performed by company. It showcases CSR spend by activity and CSR spend trend by geography. Do you have to make sure that everyone on your team knows about any specific topic I yes, then you should give Engineering Services Company Report Csr Activities Ppt PowerPoint Presentation File Information PDF a try. Our experts have put a lot of knowledge and effort into creating this impeccable Engineering Services Company Report Csr Activities Ppt PowerPoint Presentation File Information PDF. You can use this template for your upcoming presentations, as the slides are perfect to represent even the tiniest detail. You can download these templates from the Slidegeeks website and these are easy to edit. So grab these today
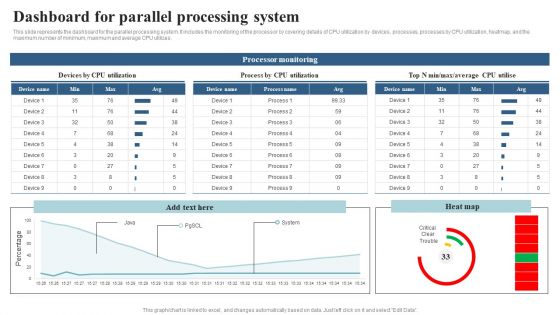
Integrating Parallel Processor System Dashboard For Parallel Processing System Brochure PDF
This slide represents the dashboard for the parallel processing system. It includes the monitoring of the processor by covering details of CPU utilization by devices, processes, processes by CPU utilization, heatmap, and the maximum number of minimum, maximum and average CPU utilizes. Want to ace your presentation in front of a live audience Our Integrating Parallel Processor System Dashboard For Parallel Processing System Brochure PDF can help you do that by engaging all the users towards you.. Slidegeeks experts have put their efforts and expertise into creating these impeccable powerpoint presentations so that you can communicate your ideas clearly. Moreover, all the templates are customizable, and easy-to-edit and downloadable. Use these for both personal and commercial use.
CRM Software Deployment Journey CRM Dashboard For Tracking Sales Pipeline Demonstration PDF
This slide covers the CRM KPI dashboard for monitoring lead status in the sales funnel. It includes metrics such as open pipeline value, open pipeline by product package, pipeline value forecast, etc. Do you have to make sure that everyone on your team knows about any specific topic I yes, then you should give CRM Software Deployment Journey CRM Dashboard For Tracking Sales Pipeline Demonstration PDF a try. Our experts have put a lot of knowledge and effort into creating this impeccable CRM Software Deployment Journey CRM Dashboard For Tracking Sales Pipeline Demonstration PDF. You can use this template for your upcoming presentations, as the slides are perfect to represent even the tiniest detail. You can download these templates from the Slidegeeks website and these are easy to edit. So grab these today.
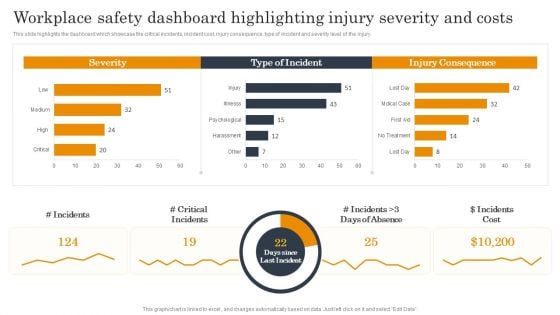
Employee Health And Safety Workplace Safety Dashboard Highlighting Injury Severity And Costs Sample PDF
This slide highlights the dashboard which showcase the critical incidents, incident cost, injury consequence, type of incident and severity level of the injury. Formulating a presentation can take up a lot of effort and time, so the content and message should always be the primary focus. The visuals of the PowerPoint can enhance the presenters message, so our Employee Health And Safety Workplace Safety Dashboard Highlighting Injury Severity And Costs Sample PDF was created to help save time. Instead of worrying about the design, the presenter can concentrate on the message while our designers work on creating the ideal templates for whatever situation is needed. Slidegeeks has experts for everything from amazing designs to valuable content, we have put everything into Employee Health And Safety Workplace Safety Dashboard Highlighting Injury Severity And Costs Sample PDF.

Estimating Business Overall Kpi Metrics Dashboard Highlighting Organization Revenue Clipart PDF
The following slide outlines key performance indicator KPI dashboard showcasing various financial metrics of the organization. The key metrics are gross revenue, product revenue, service revenue, gross profit, net profit etc. Formulating a presentation can take up a lot of effort and time, so the content and message should always be the primary focus. The visuals of the PowerPoint can enhance the presenters message, so our Estimating Business Overall Kpi Metrics Dashboard Highlighting Organization Revenue Clipart PDF was created to help save time. Instead of worrying about the design, the presenter can concentrate on the message while our designers work on creating the ideal templates for whatever situation is needed. Slidegeeks has experts for everything from amazing designs to valuable content, we have put everything into Estimating Business Overall Kpi Metrics Dashboard Highlighting Organization Revenue Clipart PDF.

 Home
Home