Supervisor Icon
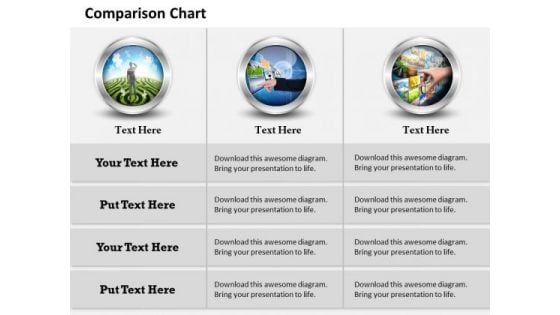
Strategic Management Comparison Chart Of Business Information Mba Models And Frameworks
Our Strategic Management Comparison Chart Of Business Information MBA Models And Frameworks Powerpoint Templates Abhor Doodling. They Never Let The Interest Flag.
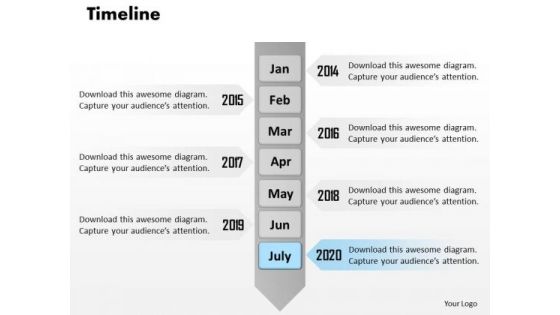
Business Framework Model Growth Chart With Timeline And Roadmap Strategic Management
Dominate Proceedings With Your Ideas. Our Business Framework Model Growth Chart With Timeline And Roadmap Strategic Management Power point Templates Will Empower Your Thoughts.
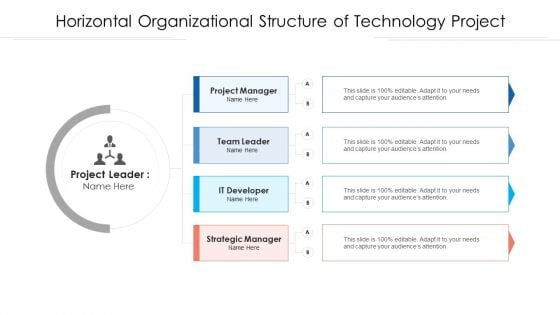
Horizontal Organizational Structure Of Technology Project Ppt PowerPoint Presentation File Ideas PDF
Persuade your audience using this horizontal organizational structure of technology project ppt powerpoint presentation file ideas pdf. This PPT design covers two stages, thus making it a great tool to use. It also caters to a variety of topics including team leader, project manager, strategic manager. Download this PPT design now to present a convincing pitch that not only emphasizes the topic but also showcases your presentation skills.
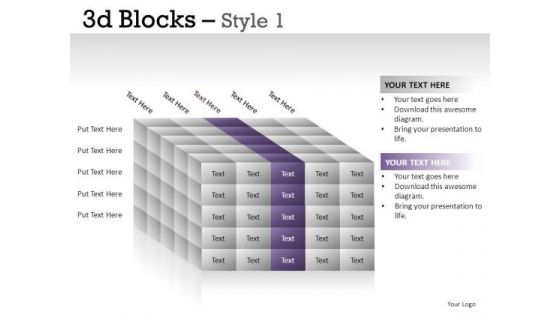
Shadow 3d Blocks 1 PowerPoint Slides And Ppt Diagram Templates
Shadow 3D Blocks 1 PowerPoint Slides And PPT Diagram Templates-These high quality powerpoint pre-designed slides and powerpoint templates have been carefully created by our professional team to help you impress your audience. All slides have been created and are 100% editable in powerpoint. Each and every property of any graphic - color, size, orientation, shading, outline etc. can be modified to help you build an effective powerpoint presentation. Any text can be entered at any point in the powerpoint template or slide. Simply DOWNLOAD, TYPE and PRESENT! Recruit leaders with our Shadow 3d Blocks 1 PowerPoint Slides And Ppt Diagram Templates. Download without worries with our money back guaranteee.
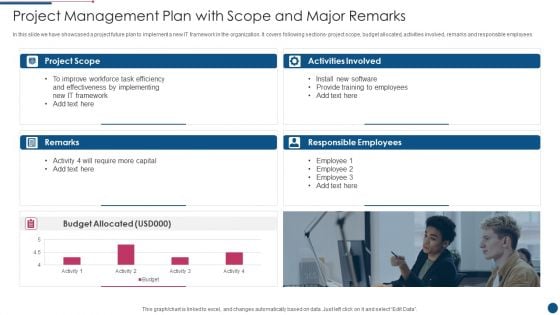
Project Management Plan With Scope And Major Remarks Mockup PDF
In this slide we have showcased a project future plan to implement a new IT framework in the organization. It covers following sections project scope, budget allocated, activities involved, remarks and responsible employees. Showcasing this set of slides titled Project Management Plan With Scope And Major Remarks Mockup PDF. The topics addressed in these templates are Require, Capital, Implementing. All the content presented in this PPT design is completely editable. Download it and make adjustments in color, background, font etc. as per your unique business setting.
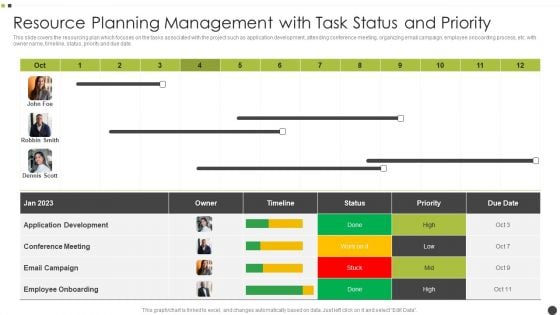
Resource Planning Management With Task Status And Priority Elements PDF
This slide covers the resourcing plan which focuses on the tasks associated with the project such as application development, attending conference meeting, organizing email campaign, employee onboarding process, etc. with owner name, timeline, status, priority and due date. Pitch your topic with ease and precision using this Resource Planning Management With Task Status And Priority Elements PDF. This layout presents information on Application Development, Email Campaign, Employee Onboarding. It is also available for immediate download and adjustment. So, changes can be made in the color, design, graphics or any other component to create a unique layout.
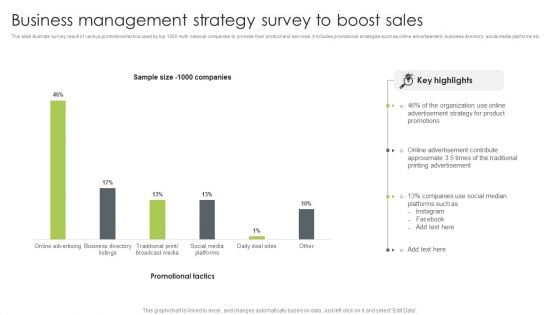
Business Management Strategy Survey To Boost Sales Summary PDF
This slide illustrate survey result of various promotional tactics used by top 1000 multi national companies to promote their product and services. it includes promotional strategies such as online advertisement, business directory, social media platforms etc. Pitch your topic with ease and precision using this Business Management Strategy Survey To Boost Sales Summary PDF. This layout presents information on Advertisement Strategy, Organization, Social Median. It is also available for immediate download and adjustment. So, changes can be made in the color, design, graphics or any other component to create a unique layout.
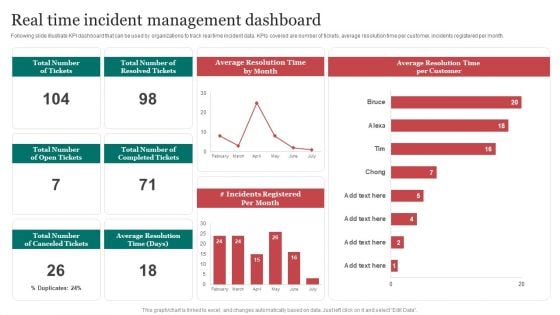
Real Time Incident Management Improving Cybersecurity With Incident Professional PDF
Following slide illustrate KPI dashboard that can be used by organizations to track real time incident data. KPIs covered are number of tickets, average resolution time per customer, incidents registered per month. The Real Time Incident Management Improving Cybersecurity With Incident Professional PDF is a compilation of the most recent design trends as a series of slides. It is suitable for any subject or industry presentation, containing attractive visuals and photo spots for businesses to clearly express their messages. This template contains a variety of slides for the user to input data, such as structures to contrast two elements, bullet points, and slides for written information. Slidegeeks is prepared to create an impression.
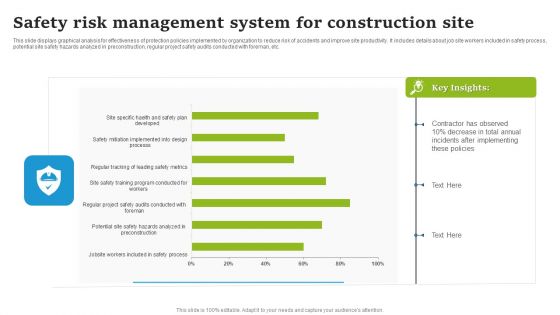
Safety Risk Management System For Construction Site Elements PDF
This slide displays graphical analysis for effectiveness of protection policies implemented by organization to reduce risk of accidents and improve site productivity. It includes details about job site workers included in safety process, potential site safety hazards analyzed in preconstruction, regular project safety audits conducted with foreman, etc. Showcasing this set of slides titled Safety Risk Management System For Construction Site Elements PDF. The topics addressed in these templates are Contractor Has Observed, Total Annual, Incidents After Implementing. All the content presented in this PPT design is completely editable. Download it and make adjustments in color, background, font etc. as per your unique business setting.

Stakeholders Management Strategy With Engagement Dashboard Infographics PDF
The following slide displays key parameters to map involvement of stakeholders in the business by analyzing them on the basis of influence, interest and impact to monitor and improve overall communication strategies of organization. Pitch your topic with ease and precision using this Stakeholders Management Strategy With Engagement Dashboard Infographics PDF. This layout presents information on Influence, Interest, Impact. It is also available for immediate download and adjustment. So, changes can be made in the color, design, graphics or any other component to create a unique layout.
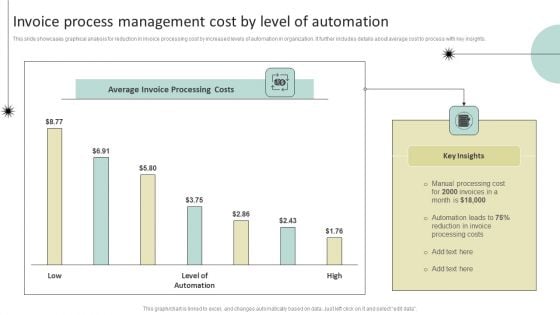
Invoice Process Management Cost By Level Of Automation Demonstration PDF
This slide showcases graphical analysis for reduction in invoice processing cost by increased levels of automation in organization. It further includes details about average cost to process with key insights. Pitch your topic with ease and precision using this Invoice Process Management Cost By Level Of Automation Demonstration PDF. This layout presents information on Average Invoice Processing Costs, Key Insights, Manual Processing Cost. It is also available for immediate download and adjustment. So, changes can be made in the color, design, graphics or any other component to create a unique layout.
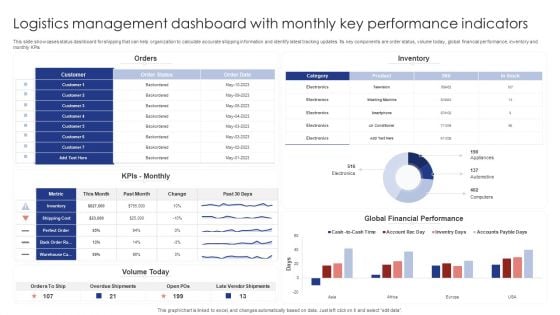
Logistics Management Dashboard With Monthly Key Performance Indicators Rules PDF
This slide showcases status dashboard for shipping that can help organization to calculate accurate shipping information and identify latest tracking updates. Its key components are order status, volume today, global financial performance, inventory and monthly KPIs. Pitch your topic with ease and precision using this Logistics Management Dashboard With Monthly Key Performance Indicators Rules PDF. This layout presents information on Orders, Inventory, Kpis Monthly. It is also available for immediate download and adjustment. So, changes can be made in the color, design, graphics or any other component to create a unique layout.
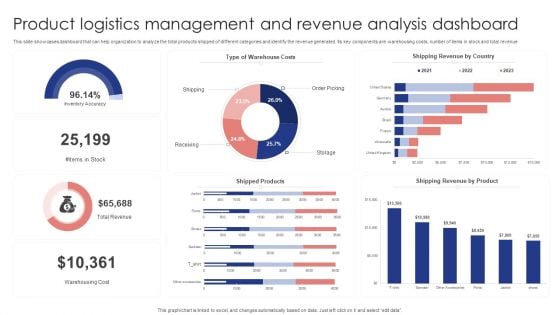
Product Logistics Management And Revenue Analysis Dashboard Demonstration PDF
This slide showcases dashboard that can help organization to analyze the total products shipped of different categories and identify the revenue generated. Its key components are warehousing costs, number of items in stock and total revenue. Pitch your topic with ease and precision using this Product Logistics Management And Revenue Analysis Dashboard Demonstration PDF. This layout presents information on Warehouse Costs, Shipping Revenue Country, Shipped Products . It is also available for immediate download and adjustment. So, changes can be made in the color, design, graphics or any other component to create a unique layout.

Virtual Performance Management And Monitoring Dashboard Pictures PDF
Following slide illustrates remote performance dashboard utilized by organizations to monitor active issues and stay ahead of problems. This slide provides data regarding issues, problematic servers, unmonitored devices, server status, reboot time, etc. Pitch your topic with ease and precision using this Virtual Performance Management And Monitoring Dashboard Pictures PDF. This layout presents information on Total Devices, Devices With Problem, Regular Safety Check Problems. It is also available for immediate download and adjustment. So, changes can be made in the color, design, graphics or any other component to create a unique layout.
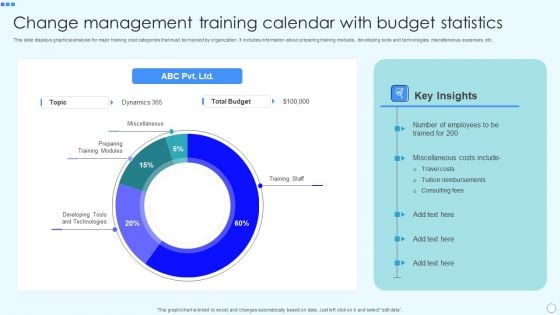
Change Management Training Calendar With Budget Statistics Template PDF
This slide displays graphical analysis for major training cost categories that must be tracked by organization. It includes information about preparing training modules, developing tools and technologies, miscellaneous expenses, etc. Showcasing this set of slides titled Change Management Training Calendar With Budget Statistics Template PDF. The topics addressed in these templates are Miscellaneous, Preparing Training Modules, Developing Tools And Technologies, Training Staff. All the content presented in this PPT design is completely editable. Download it and make adjustments in color, background, font etc. as per your unique business setting.
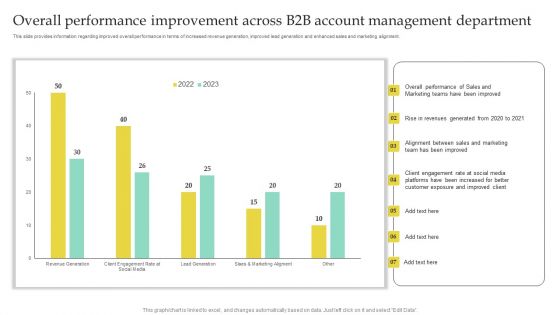
Overall Performance Improvement Across B2B Account Management Department Guidelines PDF
This slide provides information regarding improved overall performance in terms of increased revenue generation, improved lead generation and enhanced sales and marketing alignment. This Overall Performance Improvement Across B2B Account Management Department Guidelines PDF is perfect for any presentation, be it in front of clients or colleagues. It is a versatile and stylish solution for organizing your meetings. The product features a modern design for your presentation meetings. The adjustable and customizable slides provide unlimited possibilities for acing up your presentation. Slidegeeks has done all the homework before launching the product for you. So, do not wait, grab the presentation templates today
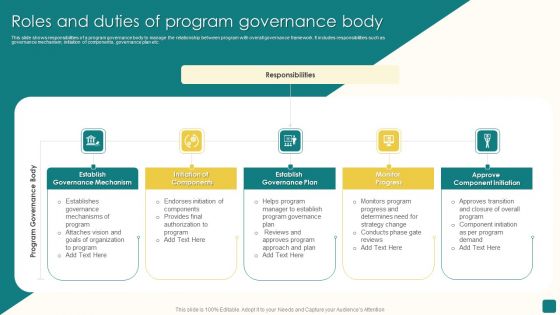
Roles And Duties Of Program Governance Body Structure PDF
This slide shows responsibilities of a program governance body to manage the relationship between program with overall governance framework. It includes responsibilities such as governance mechanism, initiation of components, governance plan etc. Presenting Roles And Duties Of Program Governance Body Structure PDF to dispense important information. This template comprises five stages. It also presents valuable insights into the topics including Establish Governance Mechanism, Initiation Of Components, Establish Governance Plan. This is a completely customizable PowerPoint theme that can be put to use immediately. So, download it and address the topic impactfully.
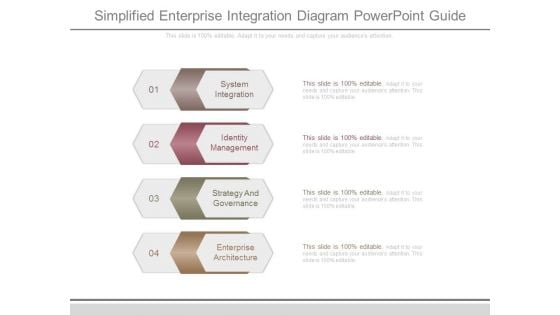
Simplified Enterprise Integration Diagram Powerpoint Guide
This is a simplified enterprise integration diagram powerpoint guide. This is a four stage process. The stages in this process are system integration, identity management, strategy and governance, enterprise architecture.
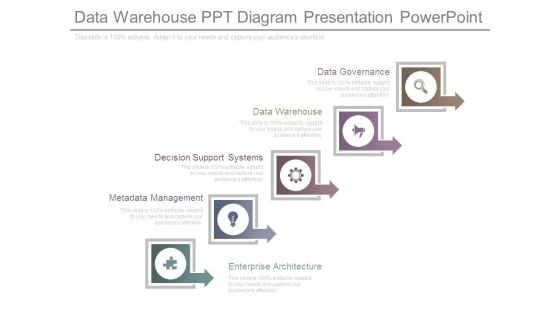
Data Warehouse Ppt Diagram Presentation Powerpoint
This is a data warehouse ppt diagram presentation powerpoint. This is a five stage process. The stages in this process are enterprise architecture, metadata management, decision support systems, data warehouse, data governance.
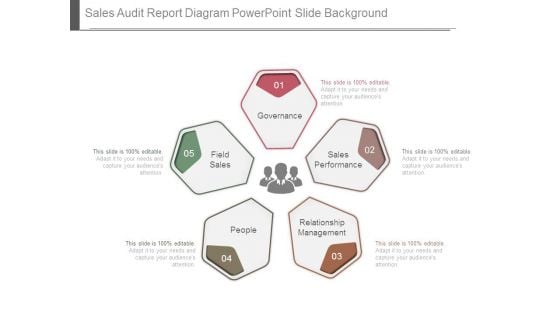
Sales Audit Report Diagram Powerpoint Slide Background
This is a sales audit report diagram powerpoint slide background. This is a five stage process. The stages in this process are field sales, people, relationship management, sales performance, governance.
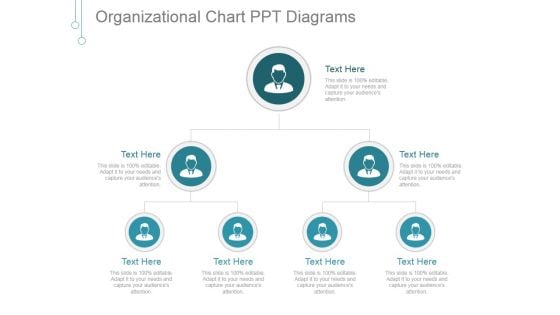
Organizational Chart Ppt PowerPoint Presentation Pictures
This is a organizational chart ppt powerpoint presentation pictures. This is a three stage process. The stages in this process are management, marketing, business, chart, organizational chart.
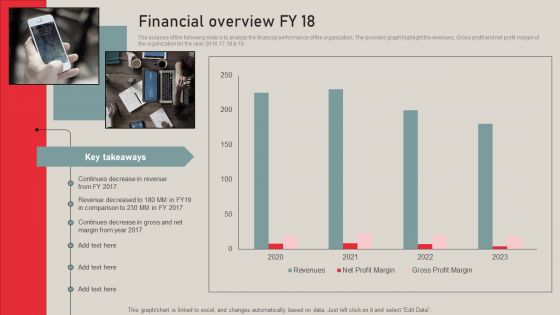
Individualized Pricing Approach For Managed Services Financial Overview FY 18 Structure PDF
The purpose of the following slide is to analyze the financial performance of the organization. The provided graph highlight the revenues, Gross profit and net profit margin of the organization for the year 2016,17,18 and 19. Create an editable Individualized Pricing Approach For Managed Services Financial Overview FY 18 Structure PDF that communicates your idea and engages your audience. Whether you are presenting a business or an educational presentation, pre designed presentation templates help save time. Individualized Pricing Approach For Managed Services Financial Overview FY 18 Structure PDF is highly customizable and very easy to edit, covering many different styles from creative to business presentations. Slidegeeks has creative team members who have crafted amazing templates. So, go and get them without any delay.
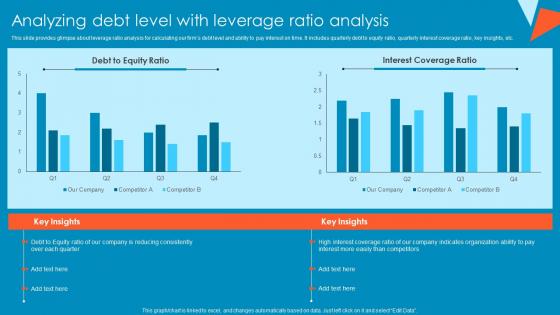
Analyzing Debt Level With Leverage Ratio Analysis Tactical Financial Governance Slides Pdf
This slide provides glimpse about leverage ratio analysis for calculating our firms debt level and ability to pay interest on time. It includes quarterly debt to equity ratio, quarterly interest coverage ratio, key insights, etc.Find highly impressive Analyzing Debt Level With Leverage Ratio Analysis Tactical Financial Governance Slides Pdf on Slidegeeks to deliver a meaningful presentation. You can save an ample amount of time using these presentation templates. No need to worry to prepare everything from scratch because Slidegeeks experts have already done a huge research and work for you. You need to download Analyzing Debt Level With Leverage Ratio Analysis Tactical Financial Governance Slides Pdf for your upcoming presentation. All the presentation templates are 100Precent editable and you can change the color and personalize the content accordingly. Download now. This slide provides glimpse about leverage ratio analysis for calculating our firms debt level and ability to pay interest on time. It includes quarterly debt to equity ratio, quarterly interest coverage ratio, key insights, etc.
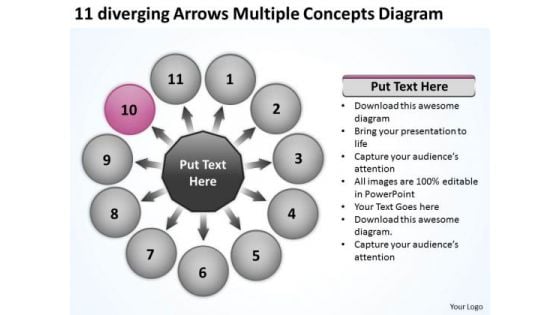
Diverging Arrows Multilple Concepts Diagram Ppt Circular Flow Chart PowerPoint Templates
We present our diverging arrows multilple concepts diagram ppt Circular Flow Chart PowerPoint templates.Present our Circle charts PowerPoint Templates because they are the tools that helped most of us evolve. Present our Arrows PowerPoint Templates because you can Transmit this concern to your staff using our helpful slides. Download and present our Flow charts PowerPoint Templates because the foundation stones of many a life. Download our Business PowerPoint Templates because you have churned your mind and come upwith solutions. Present our Spheres PowerPoint Templates because readymade PowerPoint templates can prove best of your knowledge for your slides to show.Use these PowerPoint slides for presentations relating to circle, commute, commuting, converge, diverge, fast, illustration infinity, iron, isolated, journey, locomotive, move, passage, passenger, path, rail railroad, railway, ring, road, route, speed, splint, station, steel, streak, strip, track, traintraintrack, tram, transit, transport, transportation, travel, travelling, turn, vacation vintage, voyage. The prominent colors used in the PowerPoint template are Purple, Gray, White. You can be sure our diverging arrows multilple concepts diagram ppt Circular Flow Chart PowerPoint templates are Cheerful. You can be sure our fast PowerPoint templates and PPT Slides are Tranquil. People tell us our diverging arrows multilple concepts diagram ppt Circular Flow Chart PowerPoint templates are Ultra. We assure you our fast PowerPoint templates and PPT Slides are specially created by a professional team with vast experience. They diligently strive to come up with the right vehicle for your brilliant Ideas. The feedback we get is that our diverging arrows multilple concepts diagram ppt Circular Flow Chart PowerPoint templates are incredible easy to use. We assure you our iron PowerPoint templates and PPT Slides are Wistful. Beat the budget with our Diverging Arrows Multilple Concepts Diagram Ppt Circular Flow Chart PowerPoint Templates. Have enough to spare in the end.
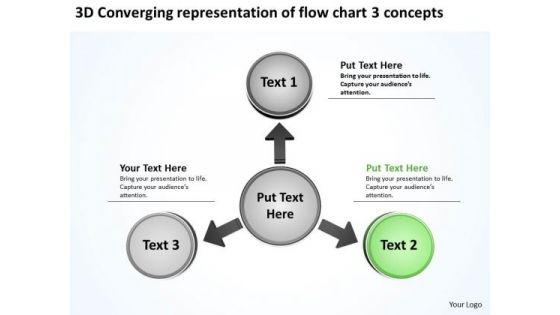
Of Flow Chart 3 Concepts Ppt Relative Circular Arrow Diagram PowerPoint Slides
We present our of flow chart 3 concepts ppt Relative Circular Arrow Diagram PowerPoint Slides.Use our Ring Charts PowerPoint Templates because our PowerPoint templates give this step by step process to acheive the aim. Download and present our Circle charts PowerPoint Templates because you can take it along a sure fire road to good profit. Download and present our Arrows PowerPoint Templates because this layout helps you to see satisfaction spread across the room as they unravel your gifted views. Download our Process and Flows PowerPoint Templates because readymade PowerPoint templates can prove best of your knowledge for your slides to show. Download and present our Success PowerPoint Templates because your quest has taken you well onto the path of success.Use these PowerPoint slides for presentations relating to Arrow, card, choice, concept,creative, design, direction, flow, four,illustration, infographic, instruction, label,layout, manual, marketing, modern, next,number, offer, options, order, page,paper, pointer, process, product,promotion, sequence, simple, special,step, symbol. The prominent colors used in the PowerPoint template are Green lime , White, Gray. People tell us our of flow chart 3 concepts ppt Relative Circular Arrow Diagram PowerPoint Slides look good visually. Customers tell us our design PowerPoint templates and PPT Slides provide great value for your money. Be assured of finding the best projection to highlight your words. Professionals tell us our of flow chart 3 concepts ppt Relative Circular Arrow Diagram PowerPoint Slides are Energetic. Presenters tell us our concept PowerPoint templates and PPT Slides will save the presenter time. Use our of flow chart 3 concepts ppt Relative Circular Arrow Diagram PowerPoint Slides are designed by professionals Presenters tell us our creative PowerPoint templates and PPT Slides will make you look like a winner. Distill your thoughts with our Of Flow Chart 3 Concepts Ppt Relative Circular Arrow Diagram PowerPoint Slides. They will draw outthe essence of it all.
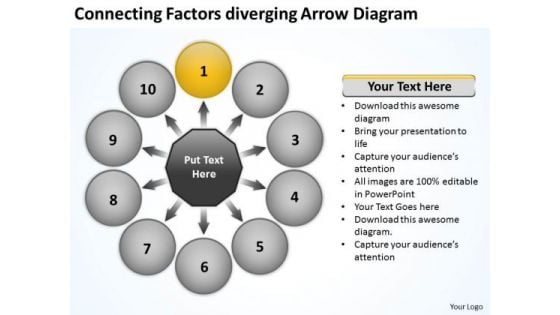
Connecting Factors Diverging Arrow Diagram Cycle Circular Flow Chart PowerPoint Slides
We present our connecting factors diverging arrow diagram cycle Circular Flow Chart PowerPoint Slides.Present our Circle Charts PowerPoint Templates because getting it done in time is the key to success. Present our Flow Charts PowerPoint Templates because they pinpoint the core values of your organisation. Download and present our Business PowerPoint Templates because it will demonstrate the strength of character under severe stress. Shine the torch ahead and bring the light to shine on all. Use our Shapes PowerPoint Templates because you can put down your ideas and present them using our innovative templates. Present our Success PowerPoint Templates because the choices you make today will determine the future growth of your enterprise.Use these PowerPoint slides for presentations relating to Access, Arrow, Business, Concept, Conceptual, Connection, Corporate, Creative, Cycle, Design, Different, Empty, Graphic, Idea, Illustration, Process, Shape, Solution, Strategy, Symbol, Template. The prominent colors used in the PowerPoint template are Gray, Black, Yellow. People tell us our connecting factors diverging arrow diagram cycle Circular Flow Chart PowerPoint Slides are Radiant. Use our Business PowerPoint templates and PPT Slides are Fancy. Professionals tell us our connecting factors diverging arrow diagram cycle Circular Flow Chart PowerPoint Slides are Magnificent. Presenters tell us our Concept PowerPoint templates and PPT Slides are specially created by a professional team with vast experience. They diligently strive to come up with the right vehicle for your brilliant Ideas. Professionals tell us our connecting factors diverging arrow diagram cycle Circular Flow Chart PowerPoint Slides look good visually. PowerPoint presentation experts tell us our Corporate PowerPoint templates and PPT Slides are Detailed. Arrive at base camp with our Connecting Factors Diverging Arrow Diagram Cycle Circular Flow Chart PowerPoint Slides. Your thoughts will then begin the ascent.
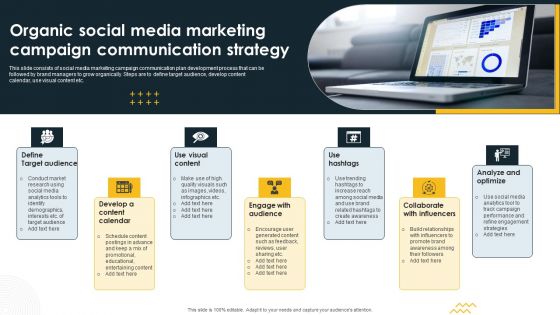
Organic Social Media Marketing Campaign Communication Strategy Diagrams PDF
This slide consists of social media marketing campaign communication plan development process that can be followed by brand managers to grow organically. Steps are to define target audience, develop content calendar, use visual content etc. Persuade your audience using this Organic Social Media Marketing Campaign Communication Strategy Diagrams PDF. This PPT design covers seven stages, thus making it a great tool to use. It also caters to a variety of topics including Define Target Audience, Use Visual Content, Use Hashtags. Download this PPT design now to present a convincing pitch that not only emphasizes the topic but also showcases your presentation skills.
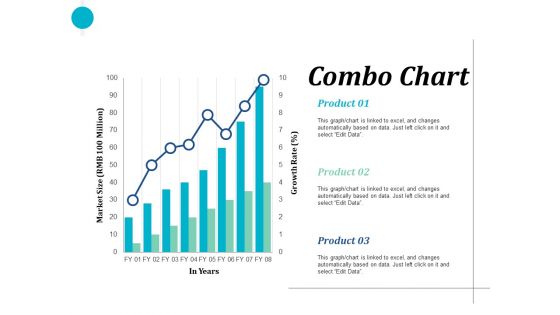
Combo Chart Finance Ppt PowerPoint Presentation Clipart
This is a combo chart finance ppt powerpoint presentation pictures show. This is a two stage process. The stages in this process are finance, marketing, management, investment, analysis.
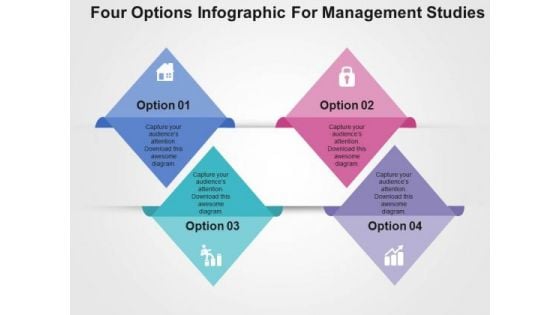
Four Options Infographic For Management Studies PowerPoint Templates
This business slide has been designed with four options infographic. You may download this diagram to display concept of management studies. Chart the course you intend to take with this slide
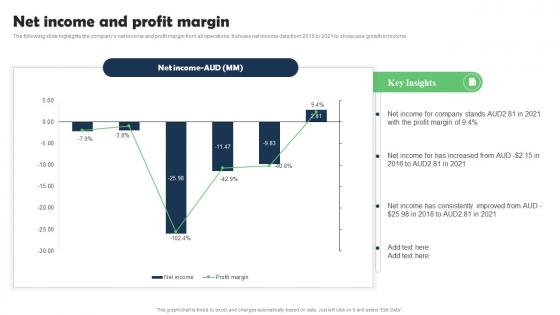
Net Income And Profit Marketing Research Services Management Business Information Pdf
The following slide highlights the companys net income and profit margin from all operations. It shows net income data from 2016 to 2021 to showcase growth in income. Explore a selection of the finest Net Income And Profit Marketing Research Services Management Business Information Pdf here. With a plethora of professionally designed and pre-made slide templates, you can quickly and easily find the right one for your upcoming presentation. You can use our Net Income And Profit Marketing Research Services Management Business Information Pdf to effectively convey your message to a wider audience. Slidegeeks has done a lot of research before preparing these presentation templates. The content can be personalized and the slides are highly editable. Grab templates today from Slidegeeks. The following slide highlights the companys net income and profit margin from all operations. It shows net income data from 2016 to 2021 to showcase growth in income.
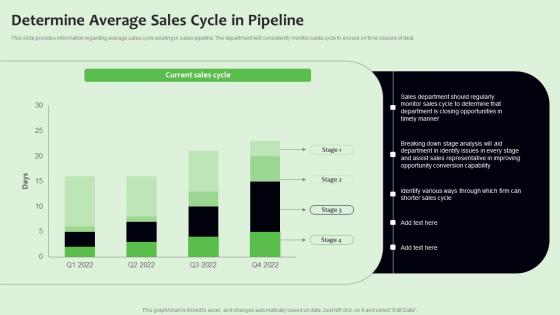
Determine Average Sales Cycle In Pipeline Strategies To Manage Sales Funnel Background Pdf
This slide provides information regarding average sales cycle existing in sales pipeline. The department will consistently monitor sales cycle to ensure on time closure of deal.Find highly impressive Determine Average Sales Cycle In Pipeline Strategies To Manage Sales Funnel Background Pdf on Slidegeeks to deliver a meaningful presentation. You can save an ample amount of time using these presentation templates. No need to worry to prepare everything from scratch because Slidegeeks experts have already done a huge research and work for you. You need to download Determine Average Sales Cycle In Pipeline Strategies To Manage Sales Funnel Background Pdf for your upcoming presentation. All the presentation templates are 100Precent editable and you can change the color and personalize the content accordingly. Download now. This slide provides information regarding average sales cycle existing in sales pipeline. The department will consistently monitor sales cycle to ensure on time closure of deal.
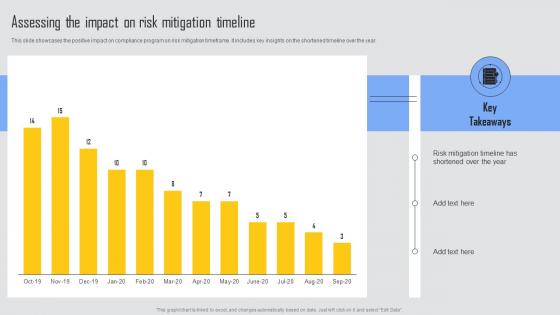
Assessing The Impact Risk Managing Risks And Establishing Trust Through Efficient Professional Pdf
This slide showcases the positive impact on compliance program on risk mitigation timeframe. It includes key insights on the shortened timeline over the year. Crafting an eye catching presentation has never been more straightforward. Let your presentation shine with this tasteful yet straightforward Assessing The Impact Risk Managing Risks And Establishing Trust Through Efficient Professional Pdf template. It offers a minimalistic and classy look that is great for making a statement. The colors have been employed intelligently to add a bit of playfulness while still remaining professional. Construct the ideal Assessing The Impact Risk Managing Risks And Establishing Trust Through Efficient Professional Pdf that effortlessly grabs the attention of your audience Begin now and be certain to wow your customers This slide showcases the positive impact on compliance program on risk mitigation timeframe. It includes key insights on the shortened timeline over the year.
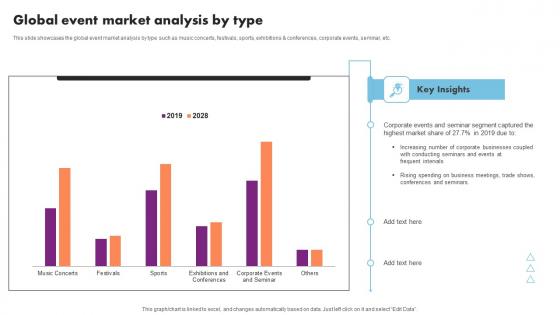
Event Management Business Plan Go To Market Strategy Global Event Market Analysis Type Ideas Pdf
This slide showcases the global event market analysis by type such as music concerts, festivals, sports, exhibitions and conferences, corporate events, seminar, etc. Do you have an important presentation coming up Are you looking for something that will make your presentation stand out from the rest Look no further than Event Management Business Plan Go To Market Strategy Global Event Market Analysis Type Ideas Pdf. With our professional designs, you can trust that your presentation will pop and make delivering it a smooth process. And with Slidegeeks, you can trust that your presentation will be unique and memorable. So why wait Grab Event Management Business Plan Go To Market Strategy Global Event Market Analysis Type Ideas Pdf today and make your presentation stand out from the rest This slide showcases the global event market analysis by type such as music concerts, festivals, sports, exhibitions and conferences, corporate events, seminar, etc.
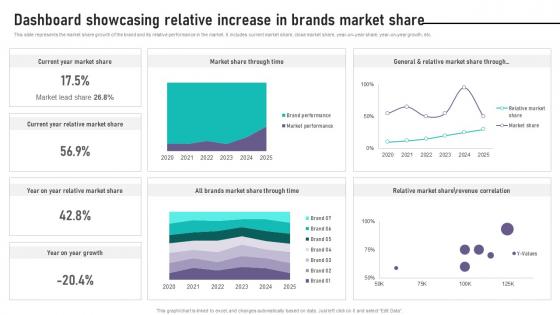
Brand Equity Management To Raise Dashboard Showcasing Relative Increase In Brands
This slide represents the market share growth of the brand and its relative performance in the market. It includes current market share, close market share, year-on-year share, year-on-year growth, etc. Crafting an eye-catching presentation has never been more straightforward. Let your presentation shine with this tasteful yet straightforward Brand Equity Management To Raise Dashboard Showcasing Relative Increase In Brands template. It offers a minimalistic and classy look that is great for making a statement. The colors have been employed intelligently to add a bit of playfulness while still remaining professional. Construct the ideal Brand Equity Management To Raise Dashboard Showcasing Relative Increase In Brands that effortlessly grabs the attention of your audience Begin now and be certain to wow your customers This slide represents the market share growth of the brand and its relative performance in the market. It includes current market share, close market share, year-on-year share, year-on-year growth, etc.
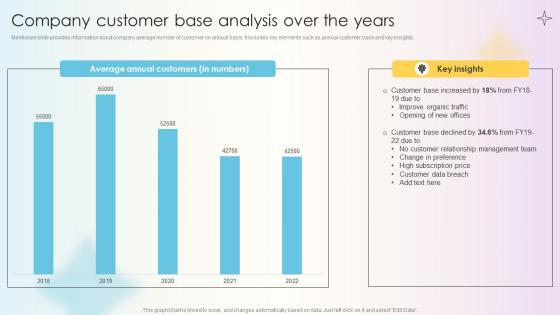
Managing Technical And Non Company Customer Base Analysis Over The Years
Mentioned slide provides information about company average number of customer on annual basis. It includes key elements such as annual customer base and key insights. Find highly impressive Managing Technical And Non Company Customer Base Analysis Over The Years on Slidegeeks to deliver a meaningful presentation. You can save an ample amount of time using these presentation templates. No need to worry to prepare everything from scratch because Slidegeeks experts have already done a huge research and work for you. You need to download Managing Technical And Non Company Customer Base Analysis Over The Years for your upcoming presentation. All the presentation templates are 100 percent editable and you can change the color and personalize the content accordingly. Download now Mentioned slide provides information about company average number of customer on annual basis. It includes key elements such as annual customer base and key insights.
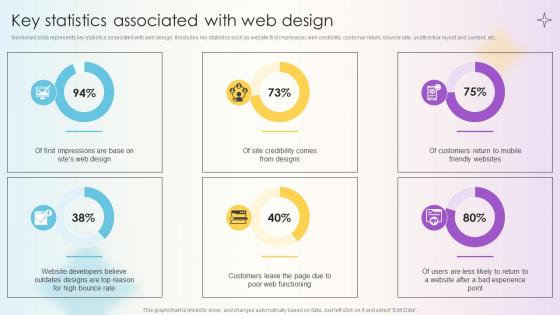
Managing Technical And Non Technical Key Statistics Associated With Web Design
Mentioned slide represents key statistics associated with web design. It includes key statistics such as website first impression, web credibility, customer return, bounce rate, unattractive layout and content, etc. Find highly impressive Managing Technical And Non Technical Key Statistics Associated With Web Design on Slidegeeks to deliver a meaningful presentation. You can save an ample amount of time using these presentation templates. No need to worry to prepare everything from scratch because Slidegeeks experts have already done a huge research and work for you. You need to download Managing Technical And Non Technical Key Statistics Associated With Web Design for your upcoming presentation. All the presentation templates are 100 percent editable and you can change the color and personalize the content accordingly. Download now Mentioned slide represents key statistics associated with web design. It includes key statistics such as website first impression, web credibility, customer return, bounce rate, unattractive layout and content, etc.
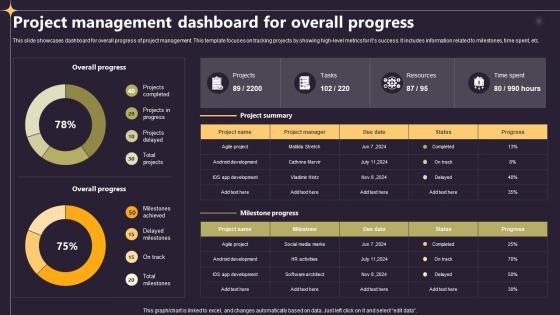
Closing A Project By Fulfilling Project Management Dashboard For Overall Progress PM SS V
This slide showcases dashboard for overall progress of project management. This template focuses on tracking projects by showing high-level metrics for its success. It includes information related to milestones, time spent, etc. This modern and well-arranged Closing A Project By Fulfilling Overview Of Planning Project In An Organisation PM SS V provides lots of creative possibilities. It is very simple to customize and edit with the Powerpoint Software. Just drag and drop your pictures into the shapes. All facets of this template can be edited with Powerpoint, no extra software is necessary. Add your own material, put your images in the places assigned for them, adjust the colors, and then you can show your slides to the world, with an animated slide included. This slide showcases dashboard for overall progress of project management. This template focuses on tracking projects by showing high-level metrics for its success. It includes information related to milestones, time spent, etc.
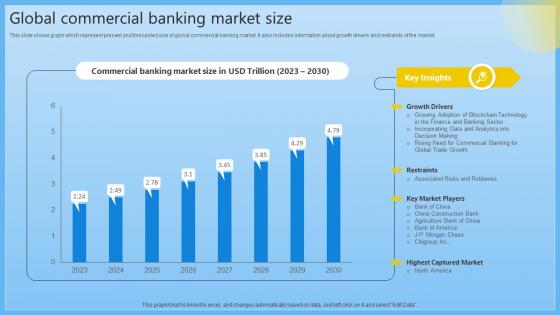
Global Commercial Banking Market Size Complete Guide On Managing Banking Fin SS V
This slide shows graph which represent present and forecasted size of global commercial banking market. It also includes information about growth drivers and restraints of the market. Explore a selection of the finest Global Commercial Banking Market Size Complete Guide On Managing Banking Fin SS V here. With a plethora of professionally designed and pre-made slide templates, you can quickly and easily find the right one for your upcoming presentation. You can use our Global Commercial Banking Market Size Complete Guide On Managing Banking Fin SS V to effectively convey your message to a wider audience. Slidegeeks has done a lot of research before preparing these presentation templates. The content can be personalized and the slides are highly editable. Grab templates today from Slidegeeks. This slide shows graph which represent present and forecasted size of global commercial banking market. It also includes information about growth drivers and restraints of the market.
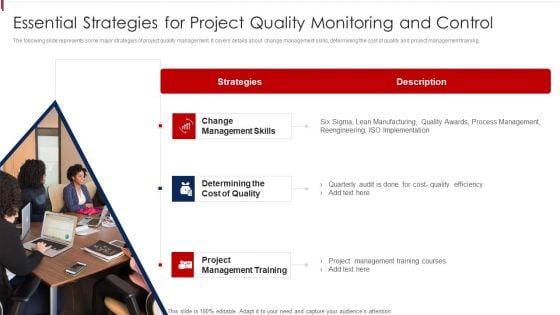
Essential Strategies For Project Quality Monitoring And Control Ideas PDF
The following slide represents some major strategies of project quality management. It covers details about change management skills, determining the cost of quality and project management training. Presenting Essential Strategies For Project Quality Monitoring And Control Ideas PDF to dispense important information. This template comprises three stages. It also presents valuable insights into the topics including Change Management Skills, Determining Cost Quality, Project Management Training. This is a completely customizable PowerPoint theme that can be put to use immediately. So, download it and address the topic impactfully.
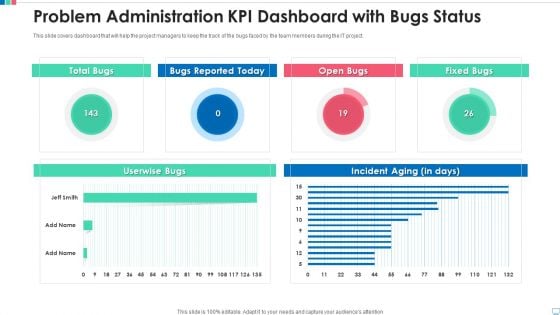
Problem Administration Kpi Dashboard With Bugs Status Ideas PDF
This slide covers dashboard that will help the project managers to keep the track of the bugs faced by the team members during the IT project. Pitch your topic with ease and precision using this problem administration kpi dashboard with bugs status ideas pdf. This layout presents information on problem administration kpi dashboard with bugs status. It is also available for immediate download and adjustment. So, changes can be made in the color, design, graphics or any other component to create a unique layout.
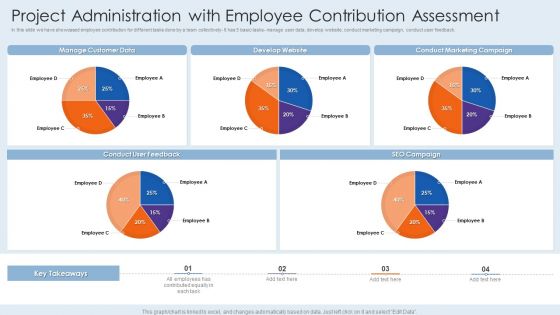
Project Administration With Employee Contribution Assessment Demonstration PDF
In this slide we have showcased employee contribution for different tasks done by a team collectively- It has 5 basic tasks- manage user data, develop website, conduct marketing campaign, conduct user feedback. Showcasing this set of slides titled project administration with employee contribution assessment demonstration pdf. The topics addressed in these templates are project administration with employee contribution assessment. All the content presented in this PPT design is completely editable. Download it and make adjustments in color, background, font etc. as per your unique business setting.
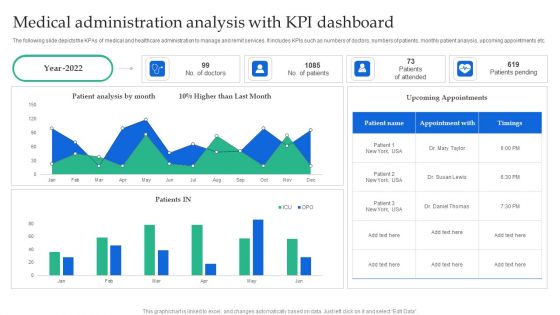
Medical Administration Analysis With KPI Dashboard Clipart PDF
The following slide depicts the KPAs of medical and healthcare administration to manage and remit services. It includes KPIs such as numbers of doctors, numbers of patients, monthly patient analysis, upcoming appointments etc. Showcasing this set of slides titled Medical Administration Analysis With KPI Dashboard Clipart PDF. The topics addressed in these templates are Patient Analysis, Higher Than, Upcoming Appointments. All the content presented in this PPT design is completely editable. Download it and make adjustments in color, background, font etc. as per your unique business setting.
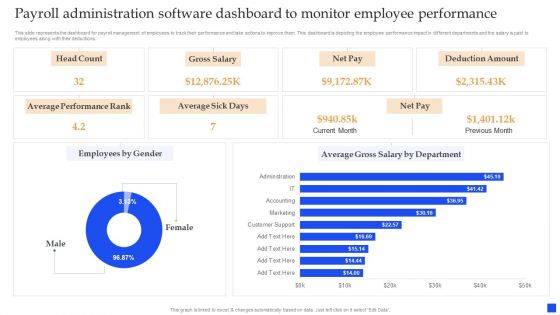
Payroll Administration Software Dashboard To Monitor Employee Performance Summary PDF
This slide represents the dashboard for payroll management of employees to track their performance and take actions to improve them. This dashboard is depicting the employee performance impact in different departments and the salary is paid to employees along with their deductions. Showcasing this set of slides titled Payroll Administration Software Dashboard To Monitor Employee Performance Summary PDF. The topics addressed in these templates are Payroll Administration Software Dashboard, Monitor Employee Performance. All the content presented in this PPT design is completely editable. Download it and make adjustments in color, background, font etc. as per your unique business setting.
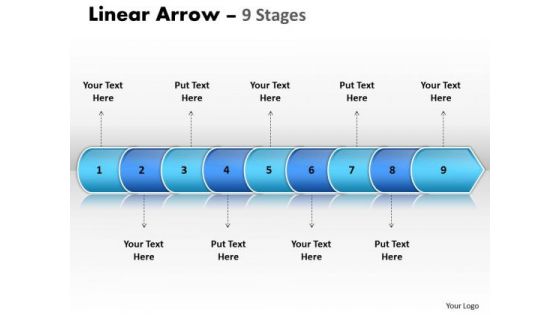
Strategy PowerPoint Template Linear Arrow 9 Stages Time Management Design
We present our strategy PowerPoint template linear arrow 9 stages time management design. Use our Arrows PowerPoint Templates because, our presentation designs are for those on the go. Use our Business PowerPoint Templates because, Marketing Strategy Business Template:- Maximizing sales of your product is the intended destination. Use our Marketing PowerPoint Templates because; enlighten them with your brilliant understanding of mental health. Use our Technology PowerPoint Templates because, organize your thoughts andilluminate your ideas accordingly. Use our Process and flows PowerPoint Templates because, Grab the attention of your team with this eye catching template signifying .Use these PowerPoint slides for presentations relating to Algorithm, arrow, arrow chart, business, chart, color, connection, development, diagram, direction, flow chart, flow diagram, flowchart, kind of diagram, linear, linear diagram, management, motion, organization, plan, process, process arrows, process chart, process diagram, process flow, program, sign, solution, strategy, symbol, technology. The prominent colors used in the PowerPoint template are Blue, Gray, and Black Enter the professional club with our Strategy PowerPoint Template Linear Arrow 9 Stages Time Management Design. You will come out on top.
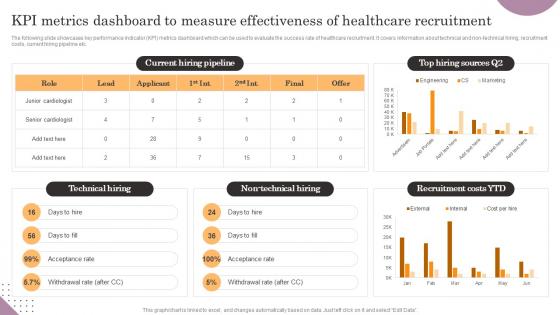
KPI Metrics Dashboard To Measure Effectiveness Of General Management Information Pdf
The following slide showcases key performance indicator KPI metrics dashboard which can be used to evaluate the success rate of healthcare recruitment. It covers information about technical and non-technical hiring, recruitment costs, current hiring pipeline etc. Presenting this PowerPoint presentation, titled KPI Metrics Dashboard To Measure Effectiveness Of General Management Information Pdf, with topics curated by our researchers after extensive research. This editable presentation is available for immediate download and provides attractive features when used. Download now and captivate your audience. Presenting this KPI Metrics Dashboard To Measure Effectiveness Of General Management Information Pdf. Our researchers have carefully researched and created these slides with all aspects taken into consideration. This is a completely customizable KPI Metrics Dashboard To Measure Effectiveness Of General Management Information Pdf that is available for immediate downloading. Download now and make an impact on your audience. Highlight the attractive features available with our PPTs. The following slide showcases key performance indicator KPI metrics dashboard which can be used to evaluate the success rate of healthcare recruitment. It covers information about technical and non-technical hiring, recruitment costs, current hiring pipeline etc.
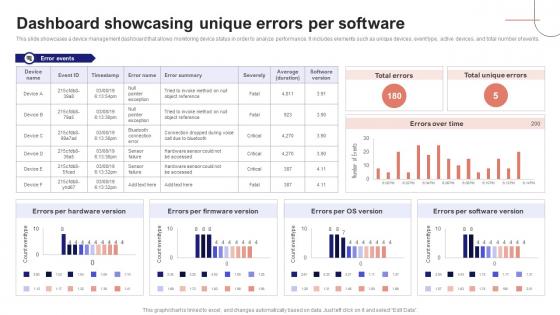
IoT Device Management Fundamentals Dashboard Showcasing Unique Errors Per Software IoT Ss V
This slide showcases a device management dashboard that allows monitoring device status in order to analyze performance. It includes elements such as unique devices, event type, active devices, and total number of events. Are you in need of a template that can accommodate all of your creative concepts This one is crafted professionally and can be altered to fit any style. Use it with Google Slides or PowerPoint. Include striking photographs, symbols, depictions, and other visuals. Fill, move around, or remove text boxes as desired. Test out color palettes and font mixtures. Edit and save your work, or work with colleagues. Download IoT Device Management Fundamentals Dashboard Showcasing Unique Errors Per Software IoT SS V and observe how to make your presentation outstanding. Give an impeccable presentation to your group and make your presentation unforgettable. This slide showcases a device management dashboard that allows monitoring device status in order to analyze performance. It includes elements such as unique devices, event type, active devices, and total number of events.
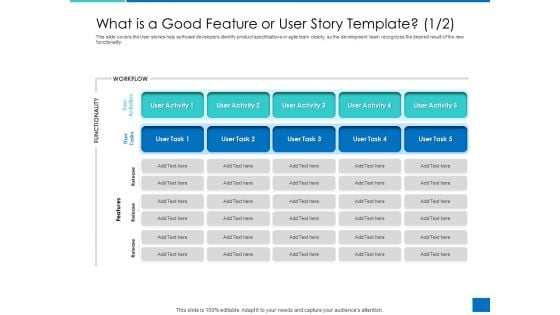
Analyzing Requirement Management Process What Is A Good Feature Or User Story Template Activities Diagrams PDF
This slide covers the User stories help software developers identify product specifications or agile team clearly, so the development team recognizes the desired result of the new functionality. Deliver and pitch your topic in the best possible manner with this analyzing requirement management process what is a good feature or user story template activities diagrams pdf. Use them to share invaluable insights on what is a good feature or user story template and impress your audience. This template can be altered and modified as per your expectations. So, grab it now.
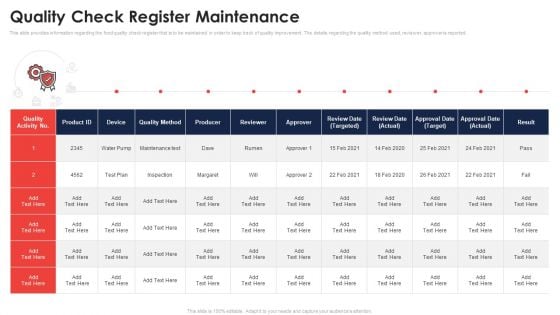
Quality Check Register Maintenance Application Of Quality Management For Food Processing Companies Diagrams PDF
This slide provides information regarding the food quality check register that is to be maintained in order to keep track of quality improvement. The details regarding the quality method used, reviewer, approver is reported. Deliver an awe inspiring pitch with this creative quality check register maintenance application of quality management for food processing companies diagrams pdf bundle. Topics like quality check register maintenance can be discussed with this completely editable template. It is available for immediate download depending on the needs and requirements of the user.
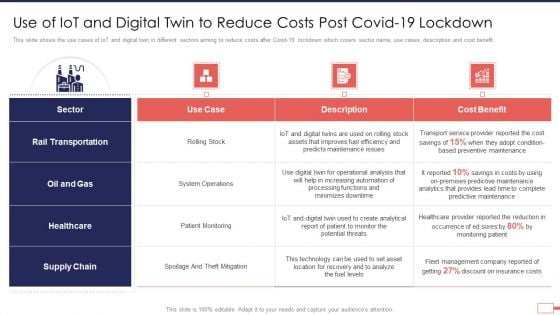
Iot Digital Twin Technology Post Covid Expenditure Management Use Of Iot Digital Twin Diagrams PDF
This slide shows the use cases of IoT and digital twin in different sectors aiming to reduce costs after Covid 19 lockdown which covers sector name, use cases, description and cost benefit. Deliver an awe inspiring pitch with this creative iot digital twin technology post covid expenditure management use of iot digital twin diagrams pdf bundle. Topics like system operations, processing, predictive, maintenance, potential can be discussed with this completely editable template. It is available for immediate download depending on the needs and requirements of the user.
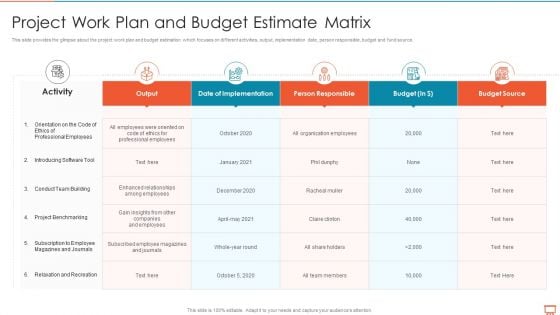
Project Management Experts Required Reports Project Work Plan And Budget Estimate Matrix Diagrams PDF
This slide provides the glimpse about the project work plan and budget estimation which focuses on different activities, output, implementation date, person responsible, budget and fund source. Deliver and pitch your topic in the best possible manner with this project management experts required reports project work plan and budget estimate matrix diagrams pdf. Use them to share invaluable insights on date of implementation, person responsible, budget, budget source and impress your audience. This template can be altered and modified as per your expectations. So, grab it now.
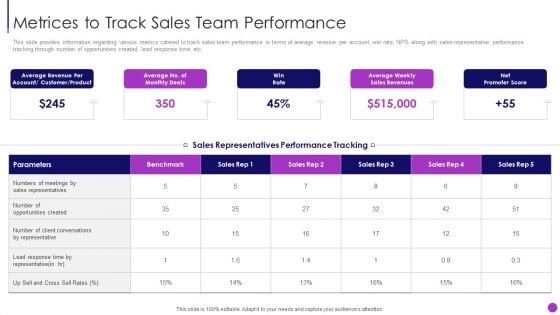
Business To Business Sales Management Playbook Metrices To Track Sales Team Performance Diagrams PDF
This slide provides information regarding various metrics catered to track sales team performance in terms of average revenue per account, win rate, NPS, along with sales representative performance tracking through number of opportunities created, lead response time, etc.Deliver an awe inspiring pitch with this creative Business To Business Sales Management Playbook Metrices To Track Sales Team Performance Diagrams PDF bundle. Topics like Sales Representatives, Client Conversations, Lead Response can be discussed with this completely editable template. It is available for immediate download depending on the needs and requirements of the user.
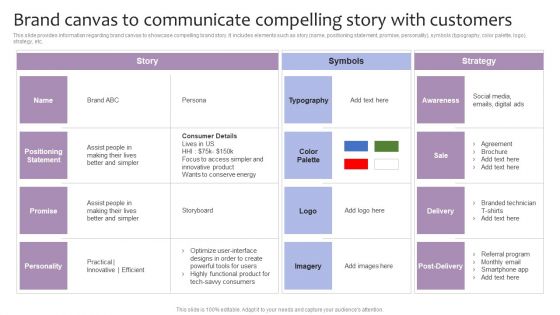
Strategic Brand Management Brand Canvas To Communicate Compelling Story With Customers Diagrams PDF
This slide provides information regarding brand canvas to showcase compelling brand story. It includes elements such as story name, positioning statement, promise, personality, symbols typography, color palette, logo, strategy, etc. Deliver and pitch your topic in the best possible manner with this Strategic Brand Management Brand Canvas To Communicate Compelling Story With Customers Diagrams PDF. Use them to share invaluable insights on Positioning Statement, Promise, Personality and impress your audience. This template can be altered and modified as per your expectations. So, grab it now.
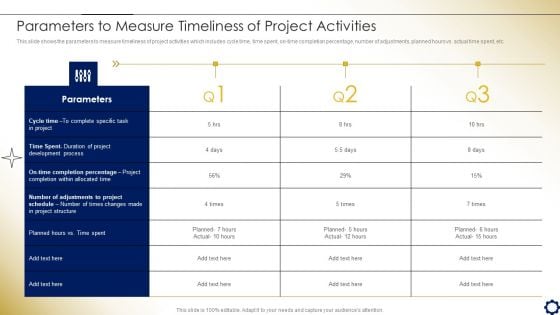
Project Time Management To Enhance Productivity Parameters To Measure Timeliness Of Project Activities Diagrams PDF
This slide shows the parameters to measure timeliness of project activities which includes cycle time, time spent, on-time completion percentage, number of adjustments, planned hours vs. actual time spent, etc.Deliver an awe inspiring pitch with this creative Project Time Management To Enhance Productivity Parameters To Measure Timeliness Of Project Activities Diagrams PDF bundle. Topics like Development Process, Completion Percentage, Completion Allocated can be discussed with this completely editable template. It is available for immediate download depending on the needs and requirements of the user.

Supply Chain Management Timeline Deploying Iot Into Logistics Department Diagrams PDF
This slide depicts logistics internet of things IoT deployment timeline. It includes details such as technologies, devices, prototypes, gateways, operating system, network connections, data encryption, pallets, fleet, training, user acceptance testing, etc. Deliver and pitch your topic in the best possible manner with this Supply Chain Management Timeline Deploying Iot Into Logistics Department Diagrams PDF. Use them to share invaluable insights on Planning And Research, Evaluating Current Technologies, Choosing Operating System and impress your audience. This template can be altered and modified as per your expectations. So, grab it now.
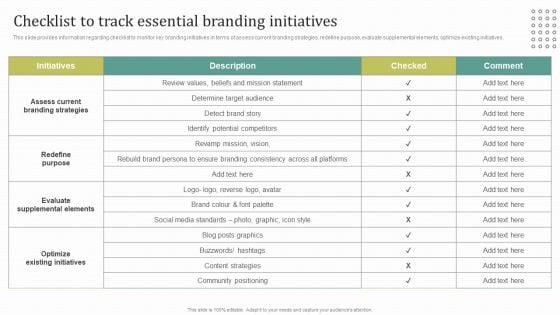
Instructions For Brand Performance Management Team Checklist To Track Essential Branding Initiatives Diagrams PDF
This slide provides information regarding checklist to monitor key branding initiatives in terms of assess current branding strategies, redefine purpose, evaluate supplemental elements, optimize existing initiatives. From laying roadmaps to briefing everything in detail, our templates are perfect for you. You can set the stage with your presentation slides. All you have to do is download these easy to edit and customizable templates. Instructions For Brand Performance Management Team Checklist To Track Essential Branding Initiatives Diagrams PDF will help you deliver an outstanding performance that everyone would remember and praise you for. Do download this presentation today.
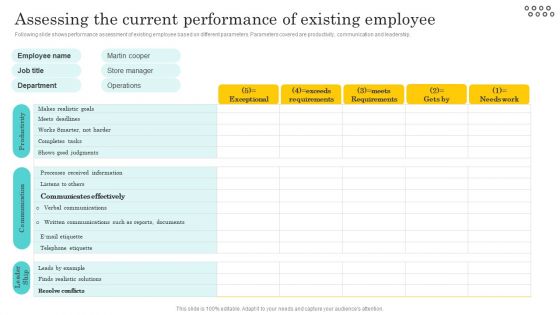
Optimizing And Managing Retail Assessing The Current Performance Of Existing Diagrams PDF
Following slide shows performance assessment of existing employee based on different parameters. Parameters covered are productivity, communication and leadership. Want to ace your presentation in front of a live audience Our Optimizing And Managing Retail Assessing The Current Performance Of Existing Diagrams PDF can help you do that by engaging all the users towards you.. Slidegeeks experts have put their efforts and expertise into creating these impeccable powerpoint presentations so that you can communicate your ideas clearly. Moreover, all the templates are customizable, and easy-to-edit and downloadable. Use these for both personal and commercial use.
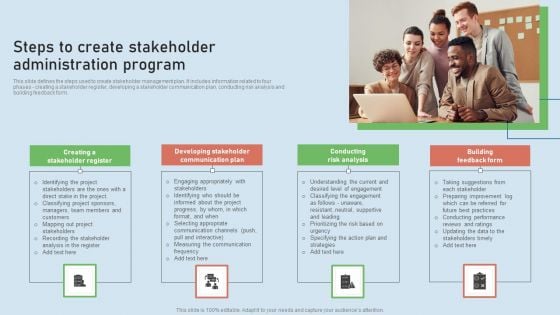
Steps To Create Stakeholder Administration Program Ppt Infographics Display PDF
This slide defines the steps used to create stakeholder management plan. It includes information related to four phases - creating a stakeholder register, developing a stakeholder communication plan, conducting risk analysis and building feedback form. Presenting Steps To Create Stakeholder Administration Program Ppt Infographics Display PDF to dispense important information. This template comprises four stages. It also presents valuable insights into the topics including Creating Stakeholder Register, Developing Stakeholder, Communication Plan. This is a completely customizable PowerPoint theme that can be put to use immediately. So, download it and address the topic impactfully.

Nestle Performance Management Report Assessing Market Segmentation Of Nestle Diagrams PDF
This slide provides glimpse about market segmentation of Nestle SA to divide the market into smaller groups of consumers with similar characteristics. It includes segmentation types such as geographic, demographic, behavioural, psychographic, etc. Want to ace your presentation in front of a live audience Our Nestle Performance Management Report Assessing Market Segmentation Of Nestle Diagrams PDF can help you do that by engaging all the users towards you. Slidegeeks experts have put their efforts and expertise into creating these impeccable powerpoint presentations so that you can communicate your ideas clearly. Moreover, all the templates are customizable, and easy-to-edit and downloadable. Use these for both personal and commercial use.
Individualized Pricing Approach For Managed Services Best Mrr And Churn Tracking Tools Diagrams PDF
Slidegeeks has constructed Individualized Pricing Approach For Managed Services Best Mrr And Churn Tracking Tools Diagrams PDF after conducting extensive research and examination. These presentation templates are constantly being generated and modified based on user preferences and critiques from editors. Here, you will find the most attractive templates for a range of purposes while taking into account ratings and remarks from users regarding the content. This is an excellent jumping off point to explore our content and will give new users an insight into our top notch PowerPoint Templates.
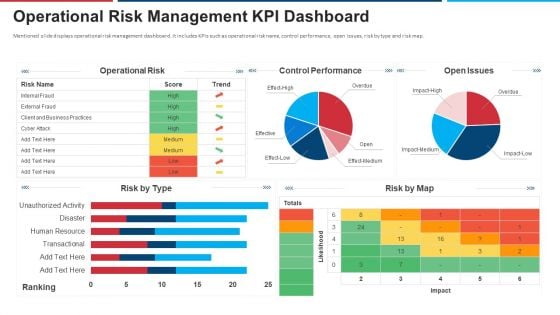
Mitigation Strategies For Operational Threat Operational Risk Management KPI Dashboard Ppt Slides Guide PDF
Mentioned slide displays operational risk management dashboard. It includes KPIs such as operational risk name, control performance, open issues, risk by type and risk map. Deliver an awe inspiring pitch with this creative mitigation strategies for operational threat operational risk management kpi dashboard ppt slides guide pdf bundle. Topics like operational risk, control performance, open issues, risk by map risk by type can be discussed with this completely editable template. It is available for immediate download depending on the needs and requirements of the user.


 Continue with Email

 Home
Home


