Supply Chain Kpi
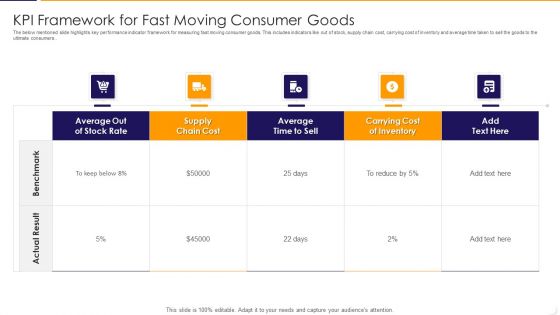
KPI Framework For Fast Moving Consumer Goods Ppt PowerPoint Presentation File Show PDF
The below mentioned slide highlights key performance indicator framework for measuring fast moving consumer goods. This includes indicators like out of stock, supply chain cost, carrying cost of inventory and average time taken to sell the goods to the ultimate consumers. Pitch your topic with ease and precision using this kpi framework for fast moving consumer goods ppt powerpoint presentation file show pdf This layout presents information on average, stock rate, cost It is also available for immediate download and adjustment. So, changes can be made in the color, design, graphics or any other component to create a unique layout.
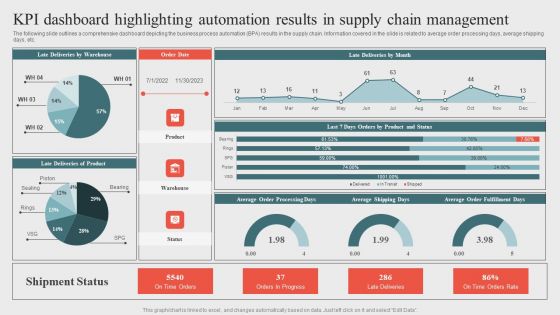
Kpi Dashboard Highlighting Automation Results In Supplyoptimizing Business Processes Through Automation Download PDF
The following slide outlines a comprehensive dashboard depicting the business process automation BPA results in the supply chain. Information covered in the slide is related to average order processing days, average shipping days, etc. There are so many reasons you need a Kpi Dashboard Highlighting Automation Results In Supplyoptimizing Business Processes Through Automation Download PDF. The first reason is you cannot spend time making everything from scratch, Thus, Slidegeeks has made presentation templates for you too. You can easily download these templates from our website easily.
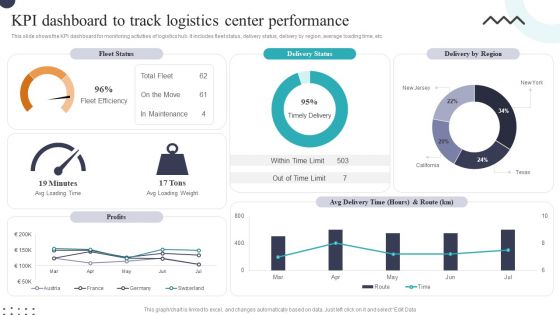
KPI Dashboard To Track Logistics Center Performance Ppt Styles Graphic Images PDF
This slide shows the KPI dashboard for monitoring activities of logistics hub. It includes fleet status, delivery status, delivery by region, average loading time, etc. Showcasing this set of slides titled KPI Dashboard To Track Logistics Center Performance Ppt Styles Graphic Images PDF. The topics addressed in these templates are Fleet Status, Delivery Status, Delivery By Region. All the content presented in this PPT design is completely editable. Download it and make adjustments in color, background, font etc. as per your unique business setting.
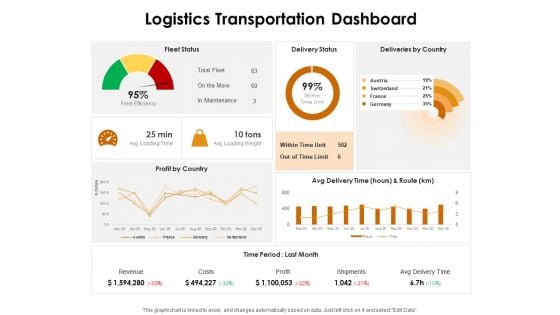
KPI Dashboards Per Industry Logistics Transportation Dashboard Ppt PowerPoint Presentation Portfolio Show PDF
Deliver an awe-inspiring pitch with this creative kpi dashboards per industry logistics transportation dashboard ppt powerpoint presentation portfolio show pdf bundle. Topics like fleet status, delivery status, delivery country, profit country, avg delivery time hours and route can be discussed with this completely editable template. It is available for immediate download depending on the needs and requirements of the user.
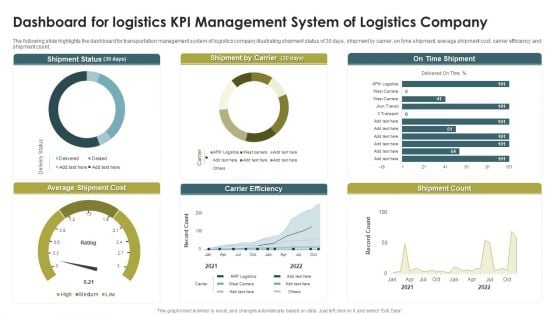
Dashboard For Logistics KPI Management System Of Logistics Company Infographics PDF
The following slide highlights the dashboard for transportation management system of logistics company illustrating shipment status of 30 days, shipment by carrier, on time shipment, average shipment cost, carrier efficiency and shipment count. Pitch your topic with ease and precision using this Dashboard For Logistics KPI Management System Of Logistics Company Infographics PDF. This layout presents information on Shipment Status, Shipment By Carrier, On Time Shipment. It is also available for immediate download and adjustment. So, changes can be made in the color, design, graphics or any other component to create a unique layout.
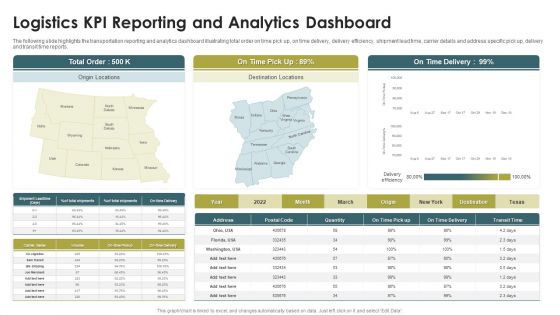
Logistics KPI Reporting And Analytics Dashboard Ppt Infographic Template Background PDF
The following slide highlights the transportation reporting and analytics dashboard illustrating total order on time pick up, on time delivery, delivery efficiency, shipment lead time, carrier details and address specific pick up, delivery and transit time reports. Presenting Logistics KPI Reporting And Analytics Dashboard Ppt Infographic Template Background PDF to dispense important information. This template comprises one stages. It also presents valuable insights into the topics including On Time Delivery, Total Order, Origin Locations. This is a completely customizable PowerPoint theme that can be put to use immediately. So, download it and address the topic impactfully.
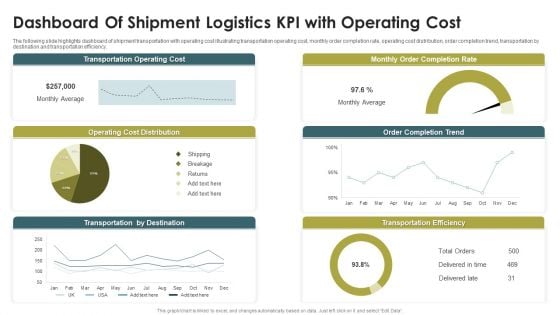
Dashboard Of Shipment Logistics KPI With Operating Cost Ppt Styles Example Topics PDF
The following slide highlights dashboard of shipment transportation with operating cost illustrating transportation operating cost, monthly order completion rate, operating cost distribution, order completion trend, transportation by destination and transportation efficiency. Showcasing this set of slides titled Dashboard Of Shipment Logistics KPI With Operating Cost Ppt Styles Example Topics PDF. The topics addressed in these templates are Transportation Operating Cost, Monthly Order, Completion Rate, Operating Cost Distribution. All the content presented in this PPT design is completely editable. Download it and make adjustments in color, background, font etc. as per your unique business setting.
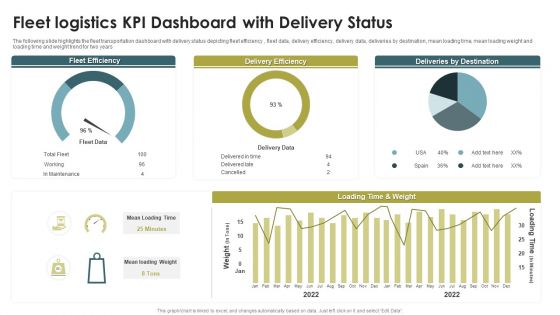
Fleet Logistics KPI Dashboard With Delivery Status Ppt Model Guide PDF
The following slide highlights the fleet transportation dashboard with delivery status depicting fleet efficiency , fleet data, delivery efficiency, delivery data, deliveries by destination, mean loading time, mean loading weight and loading time and weight trend for two years. Pitch your topic with ease and precision using this Fleet Logistics KPI Dashboard With Delivery Status Ppt Model Guide PDF. This layout presents information on Fleet Efficiency, Delivery Efficiency, Deliveries By Destination. It is also available for immediate download and adjustment. So, changes can be made in the color, design, graphics or any other component to create a unique layout.
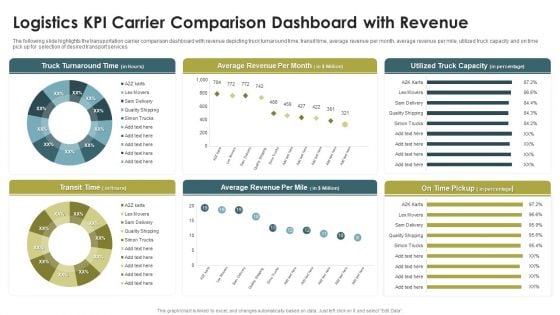
Logistics KPI Carrier Comparison Dashboard With Revenue Ppt Infographics Portfolio PDF
The following slide highlights the transportation carrier comparison dashboard with revenue depicting truck turnaround time, transit time, average revenue per month, average revenue per mile, utilized truck capacity and on time pick up for selection of desired transport services. Pitch your topic with ease and precision using this Logistics KPI Carrier Comparison Dashboard With Revenue Ppt Infographics Portfolio PDF. This layout presents information on Truck Turnaround Time, Average Revenue, Per Month, Transit Time. It is also available for immediate download and adjustment. So, changes can be made in the color, design, graphics or any other component to create a unique layout.
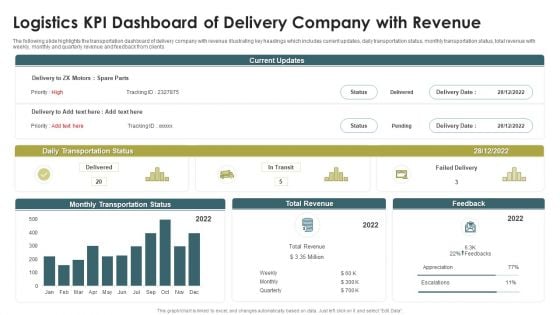
Logistics KPI Dashboard Of Delivery Company With Revenue Ppt Show PDF
The following slide highlights the transportation dashboard of delivery company with revenue illustrating key headings which includes current updates, daily transportation status, monthly transportation status, total revenue with weekly, monthly and quarterly revenue and feedback from clients. Showcasing this set of slides titled Logistics KPI Dashboard Of Delivery Company With Revenue Ppt Show PDF. The topics addressed in these templates are Daily Transportation Status, Monthly Transportation Status, Total Revenue. All the content presented in this PPT design is completely editable. Download it and make adjustments in color, background, font etc. as per your unique business setting.
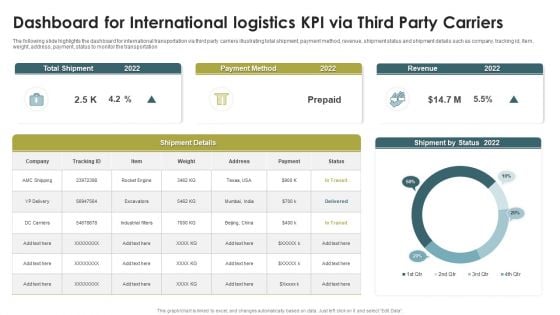
Dashboard For International Logistics KPI Via Third Party Carriers Rules PDF
The following slide highlights the dashboard for international transportation via third party carriers illustrating total shipment, payment method, revenue, shipment status and shipment details such as company, tracking id, Item, weight, address, payment, status to monitor the transportation. Showcasing this set of slides titled Dashboard For International Logistics KPI Via Third Party Carriers Rules PDF. The topics addressed in these templates are Total Shipment, Payment Method, Revenue, 20. All the content presented in this PPT design is completely editable. Download it and make adjustments in color, background, font etc. as per your unique business setting.
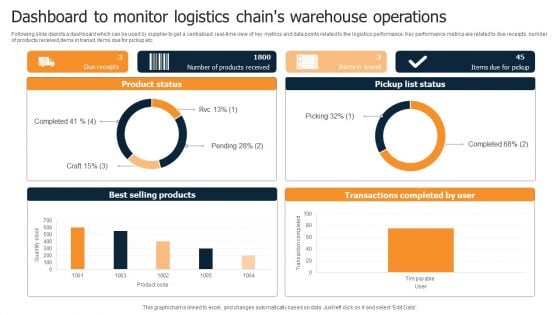
Dashboard To Monitor Logistics Chains Warehouse Operations Diagrams PDF
Following slide depicts a dashboard which can be used by supplier to get a centralized, real-time view of key metrics and data points related to the logistics performance. Key performance metrics are related to due receipts, number of products received,items in transit, items due for pickup etc. Pitch your topic with ease and precision using this Dashboard To Monitor Logistics Chains Warehouse Operations Diagrams PDF. This layout presents information on Product Status, Pickup List Status, Best Selling Products. It is also available for immediate download and adjustment. So, changes can be made in the color, design, graphics or any other component to create a unique layout.
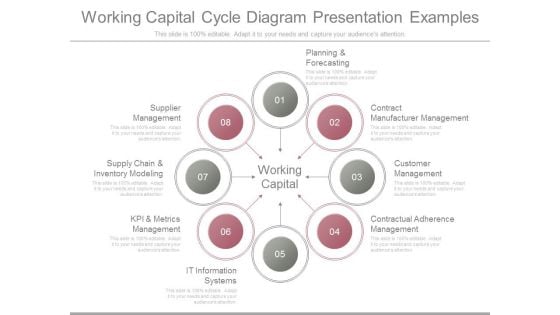
Working Capital Cycle Diagram Presentation Examples
This is a working capital cycle diagram presentation examples. This is a eight stage process. The stages in this process are planning and forecasting, contract manufacturer management, customer management, contractual adherence management, it information systems, kpi and metrics management, supply chain and inventory modeling, supplier management.
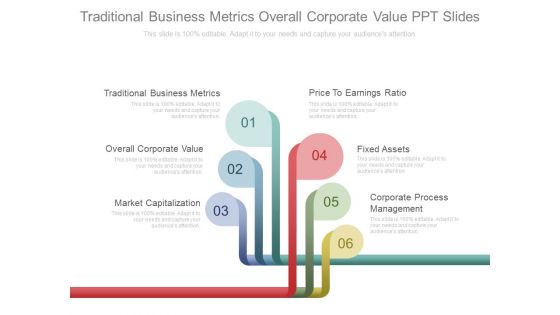
Traditional Business Metrics Overall Corporate Value Ppt Slides
This is a traditional business metrics overall corporate value ppt slides. This is a six stage process. The stages in this process are success, business, marketing.

Consumption Metrics Sharing Metrics Ppt Example
This is a consumption metrics sharing metrics ppt example. This is a four stage process. The stages in this process are circle charts, business, marketing.

Key Evaluation Metrics Ppt Slides
This is a key evaluation metrics ppt slides. This is a five stage process. The stages in this process are business, finance, marketing, symbol.
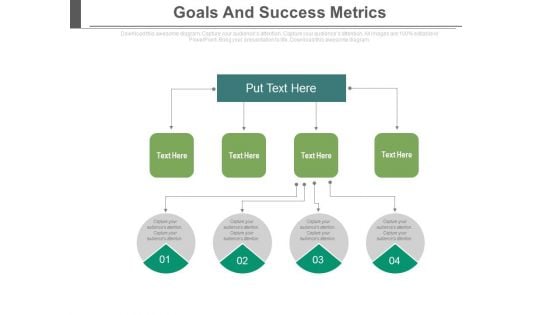
Goals And Success Metrics Ppt Slides
This is a goals and success metrics ppt slides. This is a four stage process. The stages in this process are process and flows, success, business.
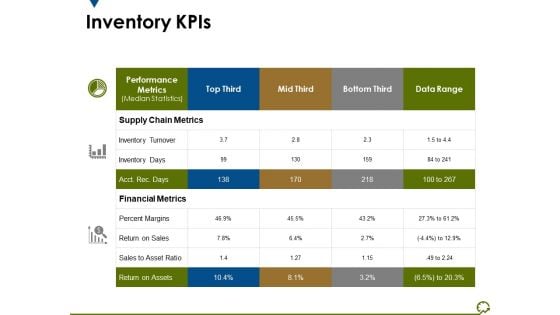
Inventory Kpis Ppt PowerPoint Presentation Infographic Template Display
This is a inventory kpis ppt powerpoint presentation infographic template display. This is a three stage process. The stages in this process are supply chain metrics, financial metrics, percent margins, return on assets, inventory turnover.
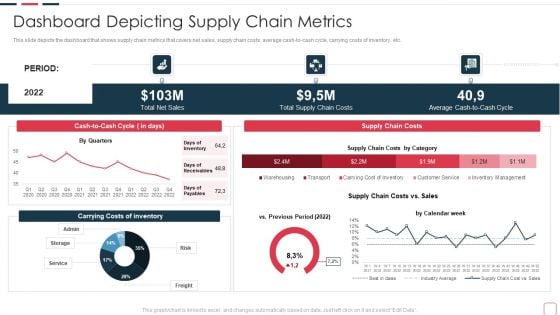
Price Benefit Internet Things Digital Twins Execution After Covid Dashboard Depicting Designs PDF
This slide depicts the dashboard that shows supply chain metrics that covers net sales, supply chain costs, average cash to cash cycle, carrying costs of inventory, etc. Deliver an awe inspiring pitch with this creative price benefit internet things digital twins execution after covid dashboard depicting designs pdf bundle. Topics like barriers for investing in iot technology can be discussed with this completely editable template. It is available for immediate download depending on the needs and requirements of the user.
Performance Indicators For Strategic Resource Evaluation Icons PDF
This slide provides an overview of the various sourcing performance metrics used to analyze and measure the status. Major KPIs covered are purchase order cycle time, inventory turnover, total supply chain cost, number of suppliers and supplier lead time. Showcasing this set of slides titled Performance Indicators For Strategic Resource Evaluation Icons PDF. The topics addressed in these templates are Purchasing, Supply Chain Management, Vendor Management. All the content presented in this PPT design is completely editable. Download it and make adjustments in color, background, font etc. as per your unique business setting.
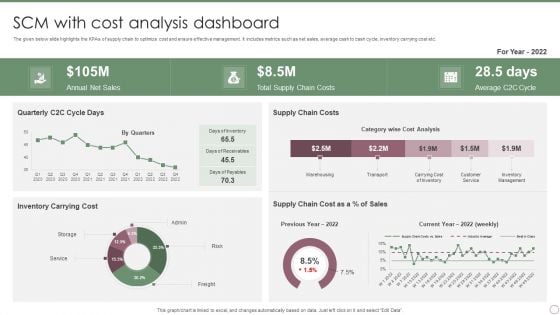
SCM With Cost Analysis Dashboard Ppt PowerPoint Presentation File Slides PDF
The given below slide highlights the KPAs of supply chain to optimize cost and ensure effective management. It includes metrics such as net sales, average cash to cash cycle, inventory carrying cost etc. Showcasing this set of slides titled SCM With Cost Analysis Dashboard Ppt PowerPoint Presentation File Slides PDF. The topics addressed in these templates are Annual Net Sales, Total Supply Chain, Costs, Average C2C Cycle. All the content presented in this PPT design is completely editable. Download it and make adjustments in color, background, font etc. as per your unique business setting.
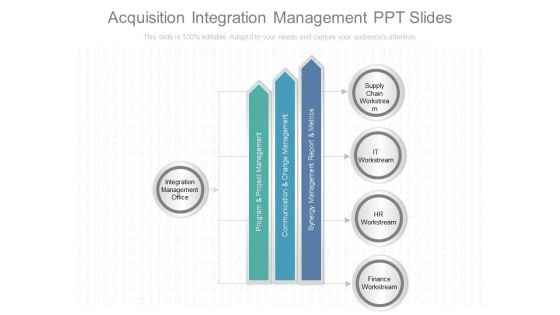
Acquisition Integration Management Ppt Slides
This is a acquisition integration management ppt slides. This is a eight stage process. The stages in this process are integration management office, program and project management, communication and change management, synergy management report and metrics, supply chain workstream, it workstream, hr workstream, finance workstream.
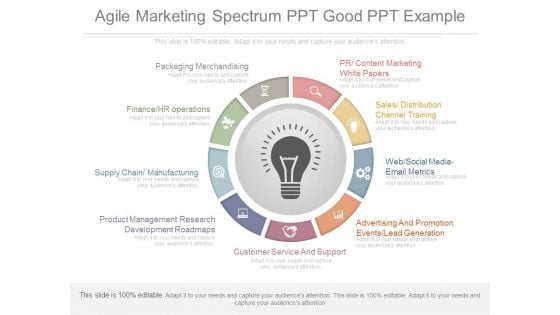
Agile Marketing Spectrum Ppt Good Ppt Example
This is a agile marketing spectrum ppt good ppt example. This is a nine stage process. The stages in this process are pr content marketing white papers, sales distribution channel training, web social media email metrics, advertising and promotion events lead generation, customer service and support, product management research development roadmaps, supply chain manufacturing, finance hr operations, packaging merchandising.
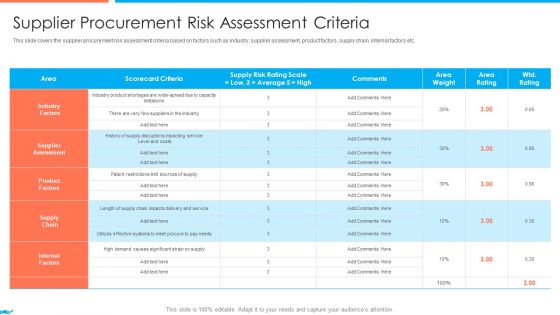
Supplier Association Management Techniques Supplier Procurement Risk Assessment Criteria Professional PDF
This slide covers the supplier procurement risk assessment criteria based on factors such as industry, supplier assessment, product factors, supply chain, internal factors etc. Deliver and pitch your topic in the best possible manner with this supplier association management techniques supplier performance management kpi dashboard guidelines pdf. Use them to share invaluable insights on reduction in costs increased efficiency, increase in profitability and impress your audience. This template can be altered and modified as per your expectation. So, grab it now.
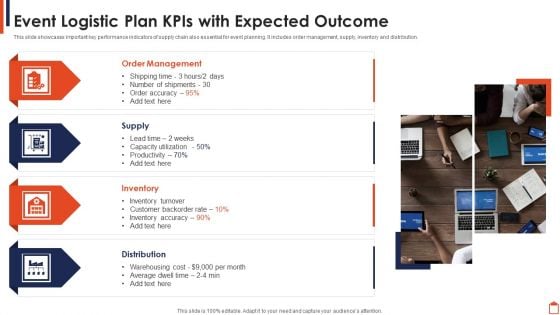
Event Logistic Plan Kpis With Expected Outcome Infographics PDF
This slide showcases important key performance indicators of supply chain also essential for event planning. It includes order management, supply, inventory and distribution.Persuade your audience using this Event Logistic Plan Kpis With Expected Outcome Infographics PDF This PPT design covers four stages, thus making it a great tool to use. It also caters to a variety of topics including Order Management, Inventory Turnover, Distribution Download this PPT design now to present a convincing pitch that not only emphasizes the topic but also showcases your presentation skills.
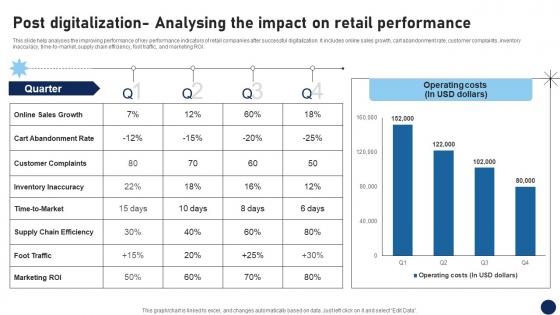
Post Digitalization Analysing The Impact On Retail Performance DT SS V
This slide help analyses the improving performance of key performance indicators of retail companies after successful digitalization. It includes online sales growth, cart abandonment rate, customer complaints, inventory inaccuracy, time-to-market, supply chain efficiency, foot traffic, and marketing ROI. This modern and well-arranged Post Digitalization Analysing The Impact On Retail Performance DT SS V provides lots of creative possibilities. It is very simple to customize and edit with the Powerpoint Software. Just drag and drop your pictures into the shapes. All facets of this template can be edited with Powerpoint, no extra software is necessary. Add your own material, put your images in the places assigned for them, adjust the colors, and then you can show your slides to the world, with an animated slide included. This slide help analyses the improving performance of key performance indicators of retail companies after successful digitalization. It includes online sales growth, cart abandonment rate, customer complaints, inventory inaccuracy, time-to-market, supply chain efficiency, foot traffic, and marketing ROI.
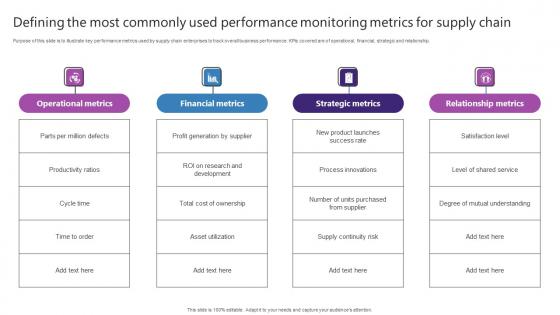
Defining The Most Commonly Used Performance Strategic Plan For Enhancing Elements Pdf
Purpose of this slide is to illustrate key performance metrics used by supply chain enterprises to track overall business performance. KPIs covered are of operational, financial, strategic and relationship. If your project calls for a presentation, then Slidegeeks is your go-to partner because we have professionally designed, easy-to-edit templates that are perfect for any presentation. After downloading, you can easily edit Defining The Most Commonly Used Performance Strategic Plan For Enhancing Elements Pdf and make the changes accordingly. You can rearrange slides or fill them with different images. Check out all the handy templates Purpose of this slide is to illustrate key performance metrics used by supply chain enterprises to track overall business performance. KPIs covered are of operational, financial, strategic and relationship.
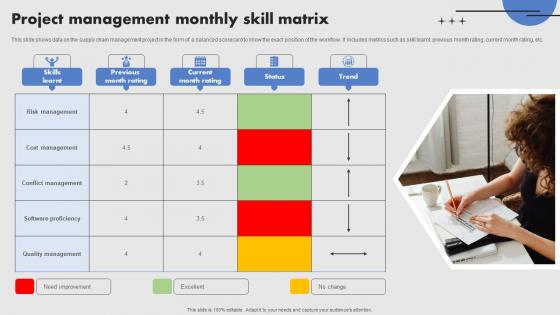
Project Management Monthly Skill Matrix Structure Pdf
This slide shows data on the supply chain management project in the form of a balanced scorecard to know the exact position of the workflow. It includes metrics such as skill learnt, previous month rating, current month rating, etc. Showcasing this set of slides titled Project Management Monthly Skill Matrix Structure Pdf. The topics addressed in these templates are Skills Learnt, Previous Month Rating, Currentmonth Rating. All the content presented in this PPT design is completely editable. Download it and make adjustments in color, background, font etc. as per your unique business setting. This slide shows data on the supply chain management project in the form of a balanced scorecard to know the exact position of the workflow. It includes metrics such as skill learnt, previous month rating, current month rating, etc.
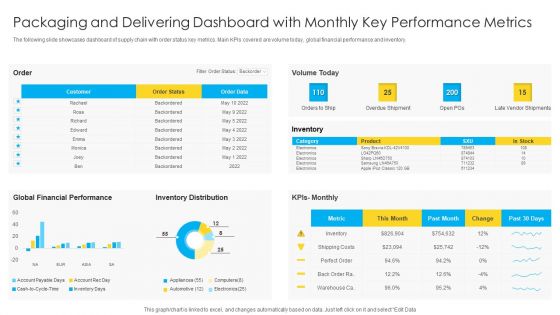
Packaging And Delivering Dashboard With Monthly Key Performance Metrics Microsoft PDF
The following slide showcases dashboard of supply chain with order status key metrics. Main KPIs covered are volume today, global financial performance and inventory. Pitch your topic with ease and precision using this Packaging And Delivering Dashboard With Monthly Key Performance Metrics Microsoft PDF. This layout presents information on Customer, Global Financial Performance, Inventory Distribution. It is also available for immediate download and adjustment. So, changes can be made in the color, design, graphics or any other component to create a unique layout.
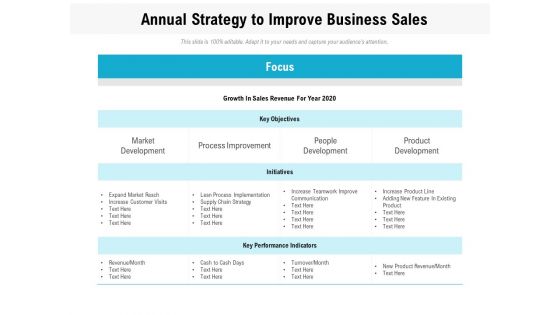
Annual Strategy To Improve Business Sales Ppt Powerpoint Presentation File Design Ideas Pdf
Showcasing this set of slides titled annual strategy to improve business sales ppt powerpoint presentation file design ideas pdf. The topics addressed in these templates are process improvement, product, development, market, development, expand market reach, supply chain strategy, key performance indicators. All the content presented in this PPT design is completely editable. Download it and make adjustments in color, background, font etc. as per your unique business setting.
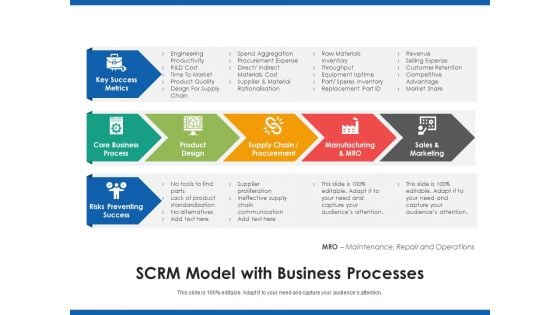
Scrm Model With Business Processes Ppt PowerPoint Presentation File Slide Portrait PDF
Persuade your audience using this scrm model with business processes ppt powerpoint presentation file slide portrait pdf. This PPT design covers three stages, thus making it a great tool to use. It also caters to a variety of topics including key success metrics, core business process, risks preventing success, product design, supply chain or procurement. Download this PPT design now to present a convincing pitch that not only emphasizes the topic but also showcases your presentation skills.
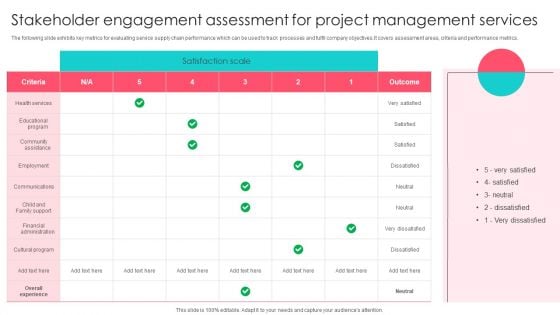
Stakeholder Engagement Assessment For Project Management Services Graphics PDF
The following slide exhibits key metrics for evaluating service supply chain performance which can be used to track processes and fulfil company objectives.It covers assessment areas, criteria and performance metrics. Showcasing this set of slides titled Stakeholder Engagement Assessment For Project Management Services Graphics PDF. The topics addressed in these templates are Communications, Financial Administration, Employment. All the content presented in this PPT design is completely editable. Download it and make adjustments in color, background, font etc. as per your unique business setting.
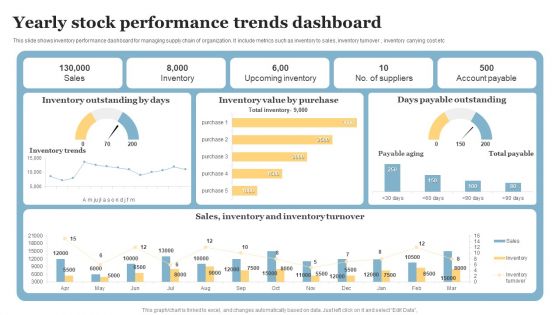
Yearly Stock Performance Trends Dashboard Designs PDF
This slide shows inventory performance dashboard for managing supply chain of organization. It include metrics such as inventory to sales, inventory turnover , inventory carrying cost etc. Showcasing this set of slides titled Yearly Stock Performance Trends Dashboard Designs PDF. The topics addressed in these templates are Inventory Outstanding Days, Days Payable Outstanding, Inventory Value Purchase. All the content presented in this PPT design is completely editable. Download it and make adjustments in color, background, font etc. as per your unique business setting.
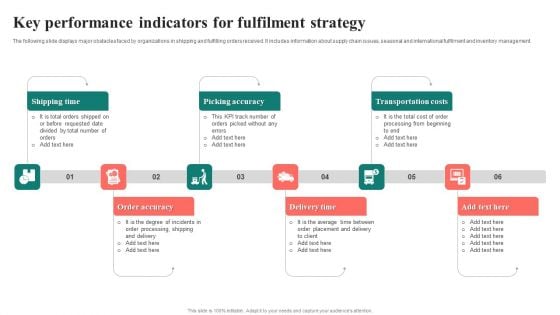
Key Performance Indicators For Fulfilment Strategy Slides PDF
The following slide displays major obstacles faced by organizations in shipping and fulfilling orders received. It includes information about supply chain issues, seasonal and international fulfilment and inventory management. Persuade your audience using this Key Performance Indicators For Fulfilment Strategy Slides PDF. This PPT design covers six stages, thus making it a great tool to use. It also caters to a variety of topics including Transportation Costs, Picking Accuracy, Order Accuracy. Download this PPT design now to present a convincing pitch that not only emphasizes the topic but also showcases your presentation skills.
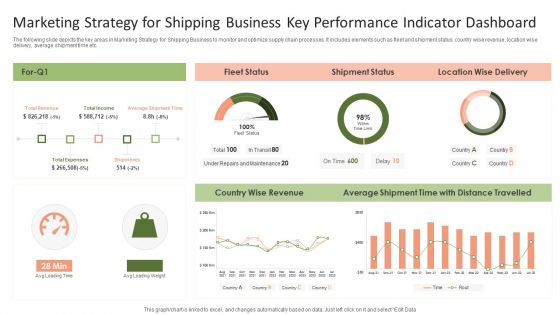
Marketing Strategy For Shipping Business Key Performance Indicator Dashboard Graphics PDF
The following slide depicts the key areas in Marketing Strategy for Shipping Business to monitor and optimize supply chain processes. It includes elements such as fleet and shipment status, country wise revenue, location wise delivery, average shipment time etc.Pitch your topic with ease and precision using this Marketing Strategy For Shipping Business Key Performance Indicator Dashboard Graphics PDF. This layout presents information on Shipment Status, Average Shipment, Wise Revenue. It is also available for immediate download and adjustment. So, changes can be made in the color, design, graphics or any other component to create a unique layout.
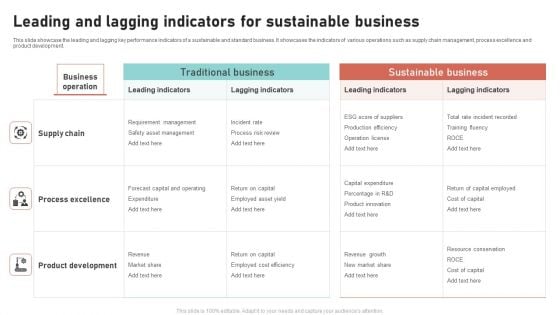
Leading And Lagging Indicators For Sustainable Business Rules PDF
This slide showcase the leading and lagging key performance indicators of a sustainable and standard business. It showcases the indicators of various operations such as supply chain management, process excellence and product development. Showcasing this set of slides titled Leading And Lagging Indicators For Sustainable Business Rules PDF. The topics addressed in these templates are Leading Indicators, Lagging Indicators, Automobile Industries. All the content presented in this PPT design is completely editable. Download it and make adjustments in color, background, font etc. as per your unique business setting.
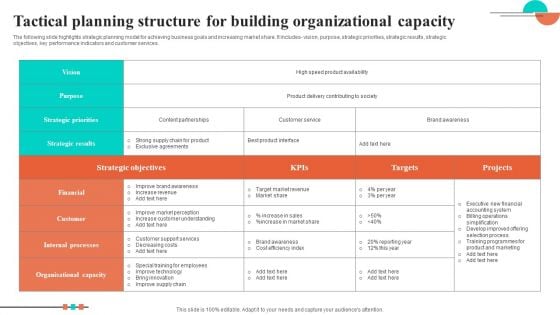
Tactical Planning Structure For Building Organizational Capacity Download PDF
The following slide highlights strategic planning model for achieving business goals and increasing market share. It includes- vision, purpose, strategic priorities, strategic results, strategic objectives, key performance indicators and customer services. Showcasing this set of slides titled Tactical Planning Structure For Building Organizational Capacity Download PDF. The topics addressed in these templates are Strong Supply Chain Product, Exclusive Agreements, Improve Brand Awareness, Increase Revenue. All the content presented in this PPT design is completely editable. Download it and make adjustments in color, background, font etc. as per your unique business setting.
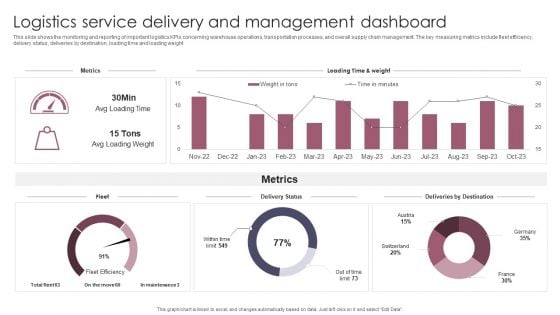
Logistics Service Delivery And Management Dashboard Introduction PDF
This slide shows the monitoring and reporting of important logistics KPIs concerning warehouse operations, transportation processes, and overall supply chain management. The key measuring metrics include fleet efficiency, delivery status, deliveries by destination, loading time and loading weight. Showcasing this set of slides titled Logistics Service Delivery And Management Dashboard Introduction PDF. The topics addressed in these templates are Logistics Service Delivery, Management Dashboard. All the content presented in this PPT design is completely editable. Download it and make adjustments in color, background, font etc. as per your unique business setting.
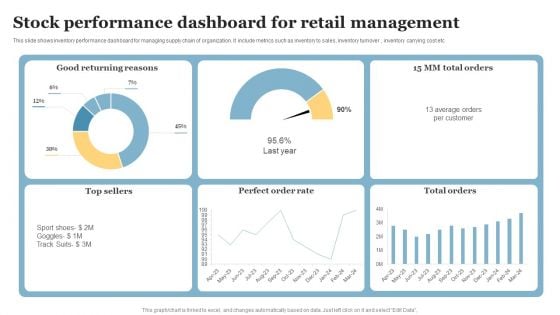
Stock Performance Dashboard For Retail Management Pictures PDF
This slide shows inventory performance dashboard for managing supply chain of organization. It include metrics such as inventory to sales, inventory turnover , inventory carrying cost etc. Pitch your topic with ease and precision using this Stock Performance Dashboard For Retail Management Pictures PDF. This layout presents information on Good Returning Reasons, Perfect Order Rate, Top Sellers. It is also available for immediate download and adjustment. So, changes can be made in the color, design, graphics or any other component to create a unique layout.

Post Digitalization Analysing The Impact On Retail Optimizing Retail Operations With Digital DT SS V
This slide help analyses the improving performance of key performance indicators of retail companies after successful digitalization. It includes online sales growth, cart abandonment rate, customer complaints, inventory inaccuracy, time-to-market, supply chain efficiency, foot traffic, and marketing ROI.This Post Digitalization Analysing The Impact On Retail Optimizing Retail Operations With Digital DT SS V is perfect for any presentation, be it in front of clients or colleagues. It is a versatile and stylish solution for organizing your meetings. The Post Digitalization Analysing The Impact On Retail Optimizing Retail Operations With Digital DT SS V features a modern design for your presentation meetings. The adjustable and customizable slides provide unlimited possibilities for acing up your presentation. Slidegeeks has done all the homework before launching the product for you. So, do not wait, grab the presentation templates today This slide help analyses the improving performance of key performance indicators of retail companies after successful digitalization. It includes online sales growth, cart abandonment rate, customer complaints, inventory inaccuracy, time-to-market, supply chain efficiency, foot traffic, and marketing ROI.
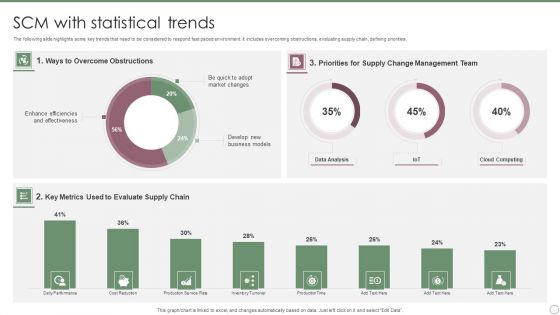
SCM With Statistical Trends Ppt PowerPoint Presentation Gallery Examples PDF
The following slide highlights some key trends that need to be considered to respond fast paced environment. It includes overcoming obstructions, evaluating supply chain, defining priorities. Pitch your topic with ease and precision using this SCM With Statistical Trends Ppt PowerPoint Presentation Gallery Examples PDF. This layout presents information on Ways To Overcome, Obstructions, Key Metrics, Evaluate Supply Chain. It is also available for immediate download and adjustment. So, changes can be made in the color, design, graphics or any other component to create a unique layout.
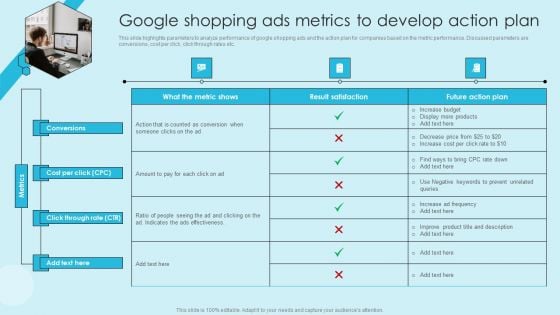
Online Marketing Techniques For Acquiring Clients Google Shopping Ads Metrics Brochure PDF
This slide provides the benefit of using e commerce as an online marketing strategy to increase company sales. It also includes service benefits that a retailer gets for choosing this strategy which can be supply chain management, marketing, data analysis etc. Formulating a presentation can take up a lot of effort and time, so the content and message should always be the primary focus. The visuals of the PowerPoint can enhance the presenters message, so our Online Marketing Techniques For Acquiring Clients Google Shopping Ads Metrics Brochure PDF was created to help save time. Instead of worrying about the design, the presenter can concentrate on the message while our designers work on creating the ideal templates for whatever situation is needed. Slidegeeks has experts for everything from amazing designs to valuable content, we have put everything into Online Marketing Techniques For Acquiring Clients Google Shopping Ads Metrics Brochure PDF
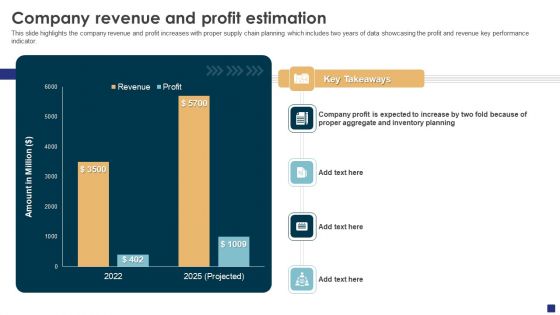
Comprehensive Guide To Ecommerce Company Revenue And Profit Estimation Topics PDF
This slide highlights the company revenue and profit increases with proper supply chain planning which includes two years of data showcasing the profit and revenue key performance indicator. Get a simple yet stunning designed Comprehensive Guide To Ecommerce Company Revenue And Profit Estimation Topics PDF. It is the best one to establish the tone in your meetings. It is an excellent way to make your presentations highly effective. So, download this PPT today from Slidegeeks and see the positive impacts. Our easy-to-edit Comprehensive Guide To Ecommerce Company Revenue And Profit Estimation Topics PDF can be your go-to option for all upcoming conferences and meetings. So, what are you waiting for Grab this template today.
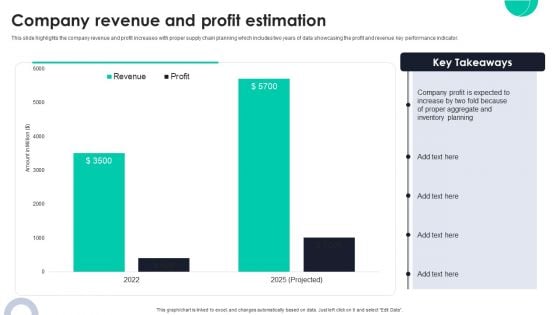
Company Revenue And Profit Estimation Ppt PowerPoint Presentation File Ideas PDF
This slide highlights the company revenue and profit increases with proper supply chain planning which includes two years of data showcasing the profit and revenue key performance indicator. Do you have to make sure that everyone on your team knows about any specific topic I yes, then you should give Company Revenue And Profit Estimation Ppt PowerPoint Presentation File Ideas PDF a try. Our experts have put a lot of knowledge and effort into creating this impeccable Company Revenue And Profit Estimation Ppt PowerPoint Presentation File Ideas PDF. You can use this template for your upcoming presentations, as the slides are perfect to represent even the tiniest detail. You can download these templates from the Slidegeeks website and these are easy to edit. So grab these today.
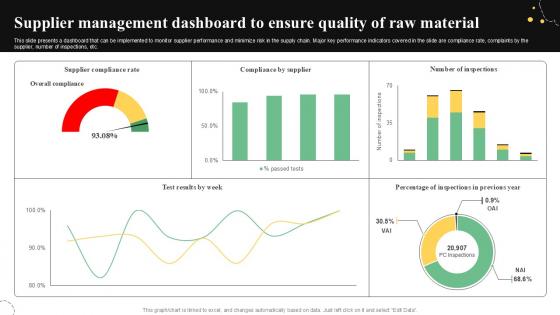
Supplier Management Dashboard Quality Control Guide For Food PPT Sample
This slide presents a dashboard that can be implemented to monitor supplier performance and minimize risk in the supply chain. Major key performance indicators covered in the slide are compliance rate, complaints by the supplier, number of inspections, etc. Present like a pro with Supplier Management Dashboard Quality Control Guide For Food PPT Sample. Create beautiful presentations together with your team, using our easy-to-use presentation slides. Share your ideas in real-time and make changes on the fly by downloading our templates. So whether you are in the office, on the go, or in a remote location, you can stay in sync with your team and present your ideas with confidence. With Slidegeeks presentation got a whole lot easier. Grab these presentations today. This slide presents a dashboard that can be implemented to monitor supplier performance and minimize risk in the supply chain. Major key performance indicators covered in the slide are compliance rate, complaints by the supplier, number of inspections, etc.
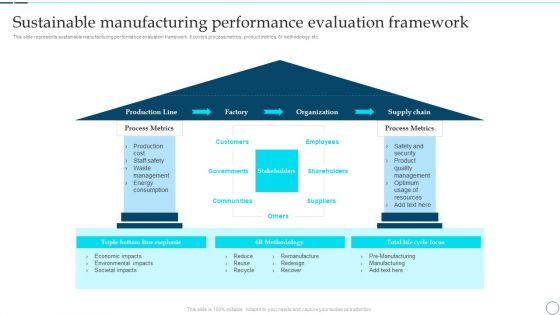
Deployment Of Smart Factory Solutions Sustainable Manufacturing Performance Evaluation Framework Professional PDF
This slide represents sustainable manufacturing performance evaluation framework. It covers process metrics, product metrics, 6r methodology etc. Deliver and pitch your topic in the best possible manner with this Deployment Of Smart Factory Solutions Sustainable Manufacturing Performance Evaluation Framework Professional PDF. Use them to share invaluable insights on Organization, Supply Chain, Process Metrics and impress your audience. This template can be altered and modified as per your expectations. So, grab it now.
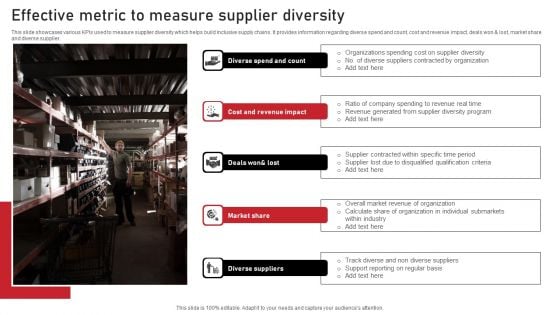
Effective Metric To Measure Supplier Diversity Themes PDF
This slide showcases various KPIs used to measure supplier diversity which helps build inclusive supply chains. It provides information regarding diverse spend and count, cost and revenue impact, deals won and lost, market share and diverse supplier. Persuade your audience using this Effective Metric To Measure Supplier Diversity Themes PDF. This PPT design covers five stages, thus making it a great tool to use. It also caters to a variety of topics including Market Share, Diverse Suppliers, Impact. Download this PPT design now to present a convincing pitch that not only emphasizes the topic but also showcases your presentation skills.
Logistics Management Strategy Effectiveness Tracker Professional PDF
This slide covers the key performance indicator for tracking the success of a new logistics management strategy. It includes metrics such as shipping time, order accuracy, lead time, capacity utilization, customer backorder rate, inventory turnover, etc. Showcasing this set of slides titled logistics management strategy effectiveness tracker professional pdf. The topics addressed in these templates are supply management, order management, inventory management. All the content presented in this PPT design is completely editable. Download it and make adjustments in color, background, font etc. as per your unique business setting.
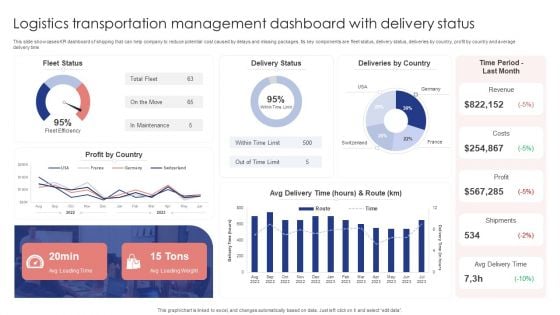
Logistics Transportation Management Dashboard With Delivery Status Portrait PDF
This slide showcases KPI dashboard of shipping that can help company to reduce potential cost caused by delays and missing packages. Its key components are fleet status, delivery status, deliveries by country, profit by country and average delivery time. Showcasing this set of slides titled Logistics Transportation Management Dashboard With Delivery Status Portrait PDF. The topics addressed in these templates are Fleet Status, Delivery Status, Deliveries By Country. All the content presented in this PPT design is completely editable. Download it and make adjustments in color, background, font etc. as per your unique business setting.
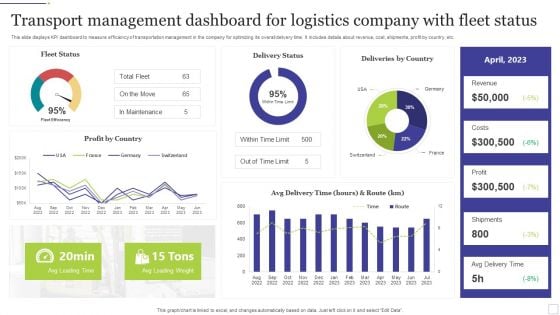
Transport Management Dashboard For Logistics Company With Fleet Status Ideas PDF
This slide displays KPI dashboard to measure efficiency of transportation management in the company for optimizing its overall delivery time. It includes details about revenue, cost, shipments, profit by country, etc. Showcasing this set of slides titled Transport Management Dashboard For Logistics Company With Fleet Status Ideas PDF. The topics addressed in these templates are Logistics Company, Fleet Status. All the content presented in this PPT design is completely editable. Download it and make adjustments in color, background, font etc. as per your unique business setting.
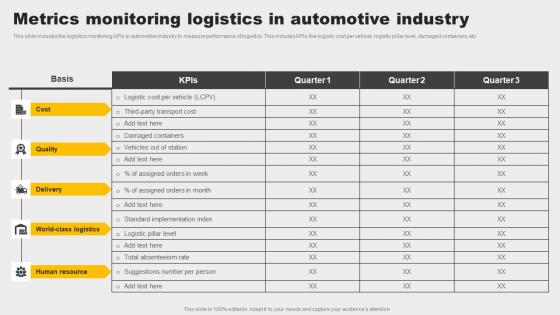
Metrics Monitoring Logistics In Automotive Industry Designs Pdf
This slide includes the logistics monitoring KPIs in automotive industry to measure performance of logistics. This includes KPIs like logistic cost per vehicle, logistic pillar level, damaged containers, etc. Showcasing this set of slides titled Metrics Monitoring Logistics In Automotive Industry Designs Pdf. The topics addressed in these templates are Quality, Cost, Human Resource. All the content presented in this PPT design is completely editable. Download it and make adjustments in color, background, font etc. as per your unique business setting. This slide includes the logistics monitoring KPIs in automotive industry to measure performance of logistics. This includes KPIs like logistic cost per vehicle, logistic pillar level, damaged containers, etc.
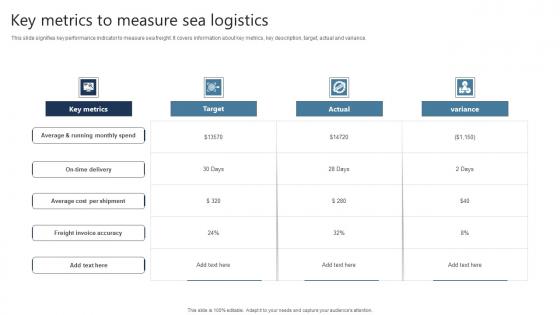
Key Metrics To Measure Sea Logistics Graphics Pdf
This slide signifies key performance indicator to measure sea freight. It covers information about key metrics, key description, target, actual and variance. Pitch your topic with ease and precision using this Key Metrics To Measure Sea Logistics Graphics Pdf This layout presents information on Freight Invoice Accuracy, Key Metrics, Target It is also available for immediate download and adjustment. So, changes can be made in the color, design, graphics or any other component to create a unique layout. This slide signifies key performance indicator to measure sea freight. It covers information about key metrics, key description, target, actual and variance.
Availability Key Performance Indicator Inventory Turnover Ratio Ppt PowerPoint Presentation Icon Themes
Presenting this set of slides with name availability key performance indicator inventory turnover ratio ppt powerpoint presentation icon themes. The topics discussed in these slides are availability kpi, availability dashboard, availability metrics. This is a completely editable PowerPoint presentation and is available for immediate download. Download now and impress your audience.
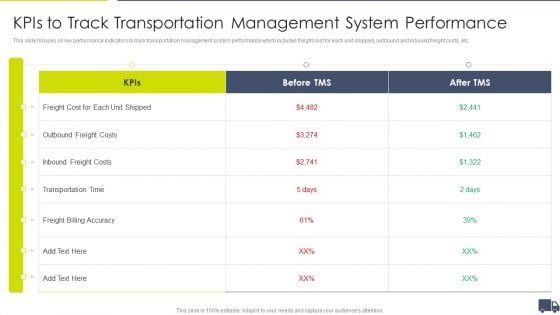
Enhancing Logistics Customer Service Kpis To Track Transportation Management Information PDF
This slide focuses on key performance indicators to track transportation management system performance which includes freight cost for each unit shipped, outbound and inbound freight costs, etc. Deliver and pitch your topic in the best possible manner with this Enhancing Logistics Customer Service Kpis To Track Transportation Management Information PDF. Use them to share invaluable insights on Freight Cost Each, Unit Shipped KPI, Outbound Freight Costs, Freight Billing Accuracy and impress your audience. This template can be altered and modified as per your expectations. So, grab it now.
Key Attributes Of Fixed Price Model Ppt PowerPoint Presentation Icon
This is a key attributes of fixed price model ppt powerpoint presentation icon. This is a six stage process. The stages in this process are fixed price model.
Key Financial Ratios Template 2 Ppt PowerPoint Presentation Icon Slide Download
This is a key financial ratios template 2 ppt powerpoint presentation icon slide download. This is a six stage process. The stages in this process are price to earnings, debt to equity ratio, current ratio, return on, equity, return on , assets, return on investment.
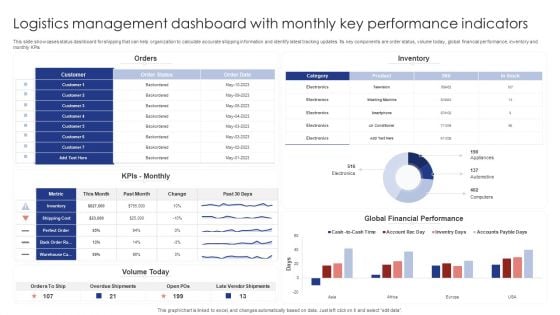
Logistics Management Dashboard With Monthly Key Performance Indicators Rules PDF
This slide showcases status dashboard for shipping that can help organization to calculate accurate shipping information and identify latest tracking updates. Its key components are order status, volume today, global financial performance, inventory and monthly KPIs. Pitch your topic with ease and precision using this Logistics Management Dashboard With Monthly Key Performance Indicators Rules PDF. This layout presents information on Orders, Inventory, Kpis Monthly. It is also available for immediate download and adjustment. So, changes can be made in the color, design, graphics or any other component to create a unique layout.
Administering Logistics Activities In SCM Kpis To Track Transportation Management System Performance Icons PDF
This slide focuses on key performance indicators to track transportation management system performance which includes freight cost for each unit shipped, outbound and inbound freight costs, etc. Deliver and pitch your topic in the best possible manner with this Administering Logistics Activities In SCM Kpis To Track Transportation Management System Performance Icons PDF. Use them to share invaluable insights on Transportation, Management, System Performance and impress your audience. This template can be altered and modified as per your expectations. So, grab it now.
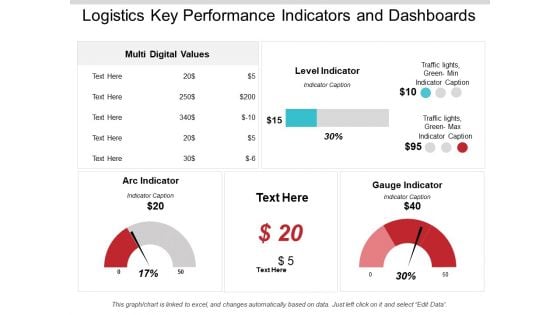
Logistics Key Performance Indicators And Dashboards Ppt PowerPoint Presentation Infographics Background Image
This is a logistics key performance indicators and dashboards ppt powerpoint presentation infographics background image. This is a three stage process. The stages in this process are logistics performance, logistics dashboard, logistics kpis.

Key Performance Indicators Of Hcl Plus Logistics Company With Future Targets Rules PDF
The slide shows the key Performance Indicator KPIs which will help the company to track the success rate of implemented strategies. Some of the KPIs are On Time Shipping, Average Carrier Waiting Time, Cash to Cash Cycle Time, Fright Payment Accuracy, Inventory Turnover, On Time Delivery etc. Deliver an awe inspiring pitch with this creative key performance indicators of hcl plus logistics company with future targets rules pdf bundle. Topics like key performance indicators of hcl plus logistics company with future targets can be discussed with this completely editable template. It is available for immediate download depending on the needs and requirements of the user.


 Continue with Email

 Home
Home


