Support Metrics
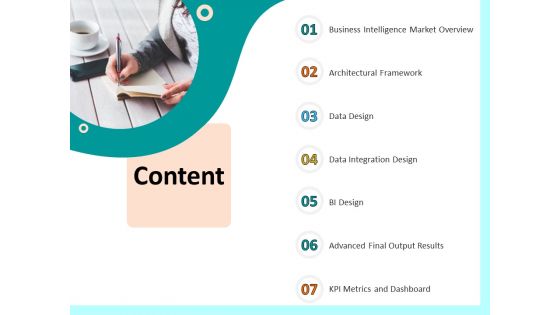
Firm Productivity Administration Content Ppt PowerPoint Presentation Visual Aids Summary PDF
Presenting this set of slides with name firm productivity administration content ppt powerpoint presentation visual aids summary pdf. This is a seven stage process. The stages in this process are business intelligence market overview, architectural framework, data design, data integration design, bi design, advanced final output results, kpi metrics and dashboard. This is a completely editable PowerPoint presentation and is available for immediate download. Download now and impress your audience.
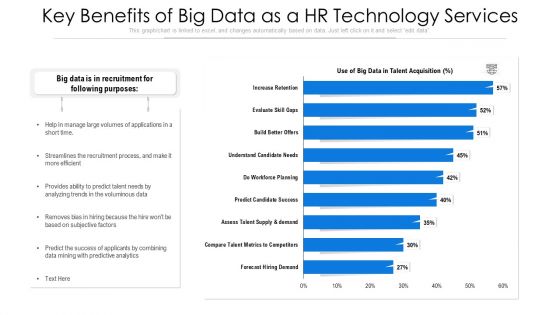
Key Benefits Of Big Data As A HR Technology Services Ppt PowerPoint Presentation Ideas Show PDF
Pitch your topic with ease and precision using this key benefits of big data as a hr technology services ppt powerpoint presentation ideas show pdf. This layout presents information on forecast hiring demand, compare talent metrics to competitors, assess talent supply and demand. It is also available for immediate download and adjustment. So, changes can be made in the color, design, graphics or any other component to create a unique layout.
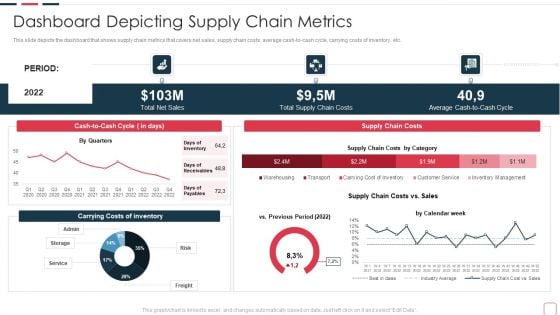
Price Benefit Internet Things Digital Twins Execution After Covid Dashboard Depicting Designs PDF
This slide depicts the dashboard that shows supply chain metrics that covers net sales, supply chain costs, average cash to cash cycle, carrying costs of inventory, etc. Deliver an awe inspiring pitch with this creative price benefit internet things digital twins execution after covid dashboard depicting designs pdf bundle. Topics like barriers for investing in iot technology can be discussed with this completely editable template. It is available for immediate download depending on the needs and requirements of the user.
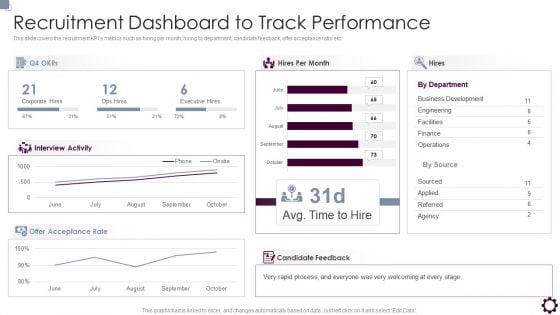
Employee Value Proposition Recruitment Dashboard To Track Performance Brochure PDF
This slide covers the recruitment KPIs metrics such as hiring per month, hiring by department, candidate feedback, offer acceptance ratio etc. Deliver and pitch your topic in the best possible manner with this Employee Value Proposition Recruitment Dashboard To Track Performance Brochure PDF. Use them to share invaluable insights on Business Development, Engineering, Facilities and impress your audience. This template can be altered and modified as per your expectations. So, grab it now.

How To Administer Accounts To Increase Sales Revenue Handling Ongoing Communication Collaboration Template PDF
This slide provides information about how sales and marketing teams will handle the ongoing communication by collaborating together and reviewing work performance on weekly quarterly and monthly basis. Deliver an awe inspiring pitch with this creative how to administer accounts to increase sales revenue handling ongoing communication collaboration template pdf bundle. Topics like evaluation, target, account strategy, business metrics can be discussed with this completely editable template. It is available for immediate download depending on the needs and requirements of the user.
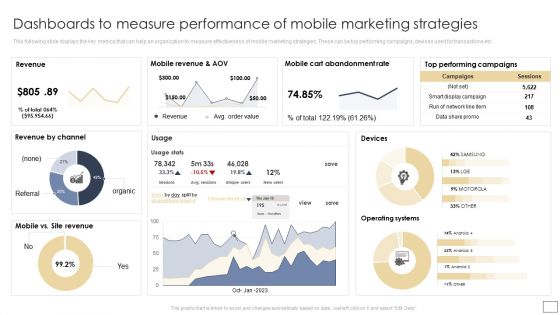
Dashboards To Measure Performance Of Mobile Marketing Strategies Graphics PDF
This following slide displays the key metrics that can help an organization to measure effectiveness of mobile marketing strategies. These can be top performing campaigns, devises used for transactions etc. There are so many reasons you need a Dashboards To Measure Performance Of Mobile Marketing Strategies Graphics PDF. The first reason is you can not spend time making everything from scratch, Thus, Slidegeeks has made presentation templates for you too. You can easily download these templates from our website easily.
What Are Your Digital Marketing Capabilities Ppt PowerPoint Presentation Icon Slideshow PDF
This is a what are your digital marketing capabilities ppt powerpoint presentation icon slideshow pdf template with various stages. Focus and dispense information on three stages using this creative set, that comes with editable features. It contains large content boxes to add your information on topics like organizational enablers, metrics and measurement, marketing analytics. You can also showcase facts, figures, and other relevant content using this PPT layout. Grab it now.
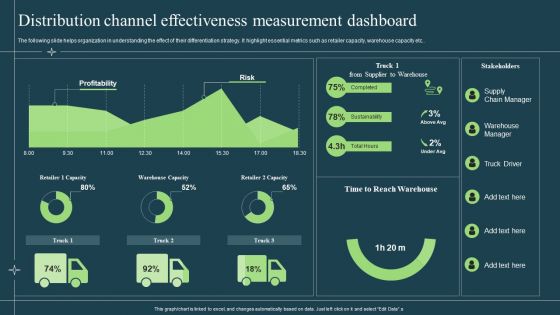
Differentiation Techniques Ways To Surpass Competitors Distribution Channel Effectiveness Measurement Dashboard Ideas PDF
The following slide helps organization in understanding the effect of their differentiation strategy. It highlight essential metrics such as retailer capacity, warehouse capacity etc. Deliver an awe inspiring pitch with this creative Differentiation Techniques Ways To Surpass Competitors Distribution Channel Effectiveness Measurement Dashboard Ideas PDF bundle. Topics like Profitability, Risk, Retailer can be discussed with this completely editable template. It is available for immediate download depending on the needs and requirements of the user.
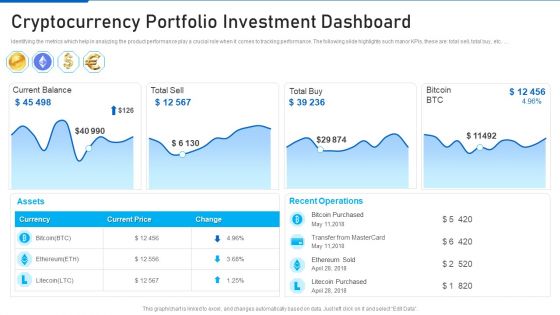
Cryptocurrency Investment Playbook Cryptocurrency Portfolio Designs PDF
Identifying the metrics which help in analyzing the product performance play a crucial role when it comes to tracking performance. The following slide highlights such manor KPIs, these are total sell, total buy, etc. Deliver an awe inspiring pitch with this creative cryptocurrency investment playbook cryptocurrency portfolio designs pdf bundle. Topics like cryptocurrency portfolio investment dashboard can be discussed with this completely editable template. It is available for immediate download depending on the needs and requirements of the user.
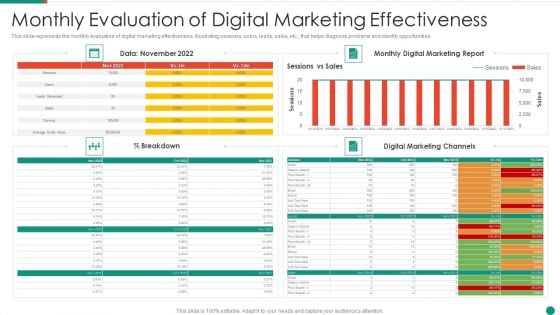
Monthly Evaluation Of Digital Marketing Effectiveness Demonstration PDF
This slide represents the monthly evaluation of digital marketing effectiveness, illustrating sessions, users, leads, sales, etc., that helps diagnose problems and identify opportunities.Pitch your topic with ease and precision using this Metrics To Measure Content Marketing Effectiveness Guidelines PDF This layout presents information on Monthly Evaluation, Digital Marketing, Effectiveness It is also available for immediate download and adjustment. So, changes can be made in the color, design, graphics or any other component to create a unique layout.
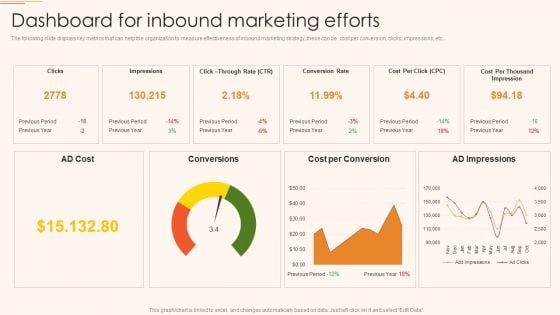
B2C And B2B Business Promotion Strategy Dashboard For Inbound Marketing Efforts Diagrams PDF
The following slide displays key metrics that can help the organization to measure effectiveness of inbound marketing strategy, these can be cost per conversion, clicks, impressions, etc. Deliver an awe inspiring pitch with this creative B2C And B2B Business Promotion Strategy Dashboard For Inbound Marketing Efforts Diagrams PDF bundle. Topics like Conversion Rate, Cost per Conversion, AD Impressions can be discussed with this completely editable template. It is available for immediate download depending on the needs and requirements of the user.
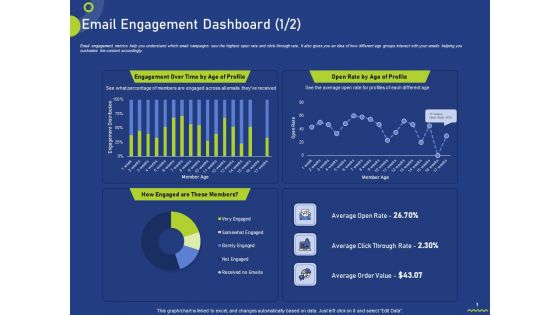
Email Engagement Dashboard Profile Ppt Infographics Images PDF
Email engagement metrics help you understand which email campaigns saw the highest open rate and click-through rate. It also gives you an idea of how different age groups interact with your emails helping you customize the content accordingly. Deliver an awe-inspiring pitch with this creative email engagement dashboard profile ppt infographics images pdf bundle. Topics like email engagement dashboard can be discussed with this completely editable template. It is available for immediate download depending on the needs and requirements of the user.
Customer Success Technology Ppt PowerPoint Presentation Icon Example Cpb
Presenting this set of slides with name customer success technology ppt powerpoint presentation icon example cpb. This is an editable Powerpoint five stages graphic that deals with topics like customer service metrics to help convey your message better graphically. This product is a premium product available for immediate download and is 100 percent editable in Powerpoint. Download this now and use it in your presentations to impress your audience.
Data Driven B2B Marketing Tactics Ppt PowerPoint Presentation Styles Background Image Cpb Pdf
Presenting this set of slides with name data driven b2b marketing tactics ppt powerpoint presentation styles background image cpb pdf. This is an editable Powerpoint three stages graphic that deals with topics like customer onboarding metrics to help convey your message better graphically. This product is a premium product available for immediate download and is 100 percent editable in Powerpoint. Download this now and use it in your presentations to impress your audience.
Data Security Financial Services Ppt PowerPoint Presentation Styles Design Templates Cpb Pdf
Presenting this set of slides with name data security financial services ppt powerpoint presentation styles design templates cpb pdf. This is an editable Powerpoint four stages graphic that deals with topics like data metrics inside application to help convey your message better graphically. This product is a premium product available for immediate download and is 100 percent editable in Powerpoint. Download this now and use it in your presentations to impress your audience.
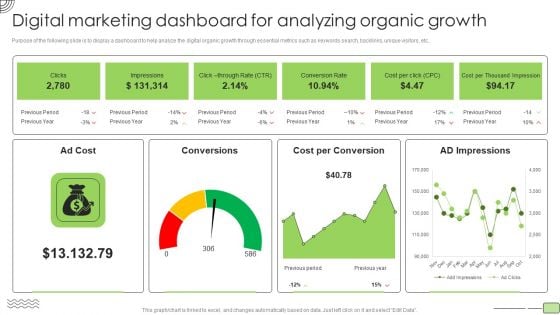
Organic Business Growth Strategies Digital Marketing Dashboard For Analyzing Organic Growth Introduction PDF
Purpose of the following slide is to display a dashboard to help analyze the digital organic growth through essential metrics such as keywords search, backlinks, unique visitors, etc. Deliver an awe inspiring pitch with this creative Organic Business Growth Strategies Digital Marketing Dashboard For Analyzing Organic Growth Introduction PDF bundle. Topics like Cost, Conversion Rate, Analyzing Organic Growth can be discussed with this completely editable template. It is available for immediate download depending on the needs and requirements of the user.
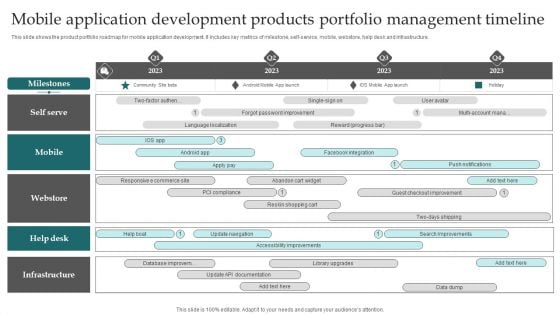
Mobile Application Development Products Portfolio Management Timeline Sample PDF
This slide shows the product portfolio roadmap for mobile application development. It includes key metrics of milestone, self service, mobile, webstore, help desk and infrastructure. Showcasing this set of slides titled Mobile Application Development Products Portfolio Management Timeline Sample PDF. The topics addressed in these templates are Mobile Application Development, Products Portfolio Management Timeline. All the content presented in this PPT design is completely editable. Download it and make adjustments in color, background, font etc. as per your unique business setting.
Approaches For Tracking Weekly Sales Performance Report Brochure PDF
The following slide exhibits approaches which helps in tracking data and metrics in sales report. It presents information related to size deal, conversion rate, etc. Presenting Approaches For Tracking Weekly Sales Performance Report Brochure PDF to dispense important information. This template comprises five stages. It also presents valuable insights into the topics including Conversion Rate, Average Size Deal, Sales Cycle Length. This is a completely customizable PowerPoint theme that can be put to use immediately. So, download it and address the topic impactfully.
E Commerce Transactions Performance Tracking Dashboard Topics PDF
This slide displays KPI dashboard to help company in tracking and monitoring total online purchases made. It includes metrics such as revenue, customers, average price, top articles sold, etc. Showcasing this set of slides titled E Commerce Transactions Performance Tracking Dashboard Topics PDF. The topics addressed in these templates are Total Customers, Division, Revenue. All the content presented in this PPT design is completely editable. Download it and make adjustments in color, background, font etc. as per your unique business setting.
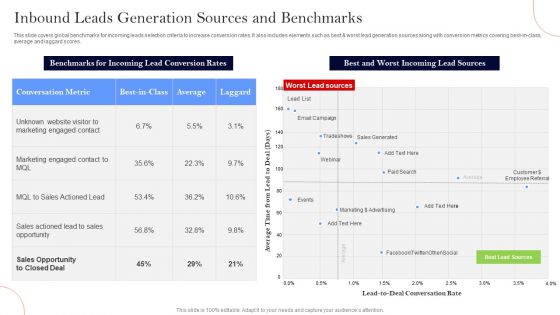
Inbound Leads Generation Sources And Benchmarks Ppt Visual Aids Model PDF
This slide covers global benchmarks for incoming leads selection criteria to increase conversion rates. It also includes elements such as best AND worst lead generation sources along with conversion metrics covering best-in-class, average and laggard scores. Showcasing this set of slides titled Inbound Leads Generation Sources And Benchmarks Ppt Visual Aids Model PDF. The topics addressed in these templates are Conversation Metric, Worst Lead Sources, Marketing Engaged. All the content presented in this PPT design is completely editable. Download it and make adjustments in color, background, font etc. as per your unique business setting.
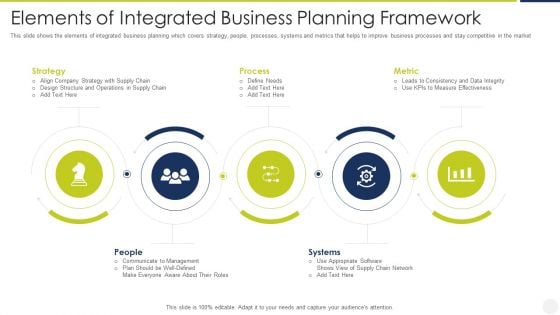
Elements Of Integrated Business Planning Framework Diagrams PDF
This slide shows the elements of integrated business planning which covers strategy, people, processes, systems and metrics that helps to improve business processes and stay competitive in the market Persuade your audience using this elements of integrated business planning framework diagrams pdf. This PPT design covers five stages, thus making it a great tool to use. It also caters to a variety of topics including strategy, process, metric, people, systems. Download this PPT design now to present a convincing pitch that not only emphasizes the topic but also showcases your presentation skills.
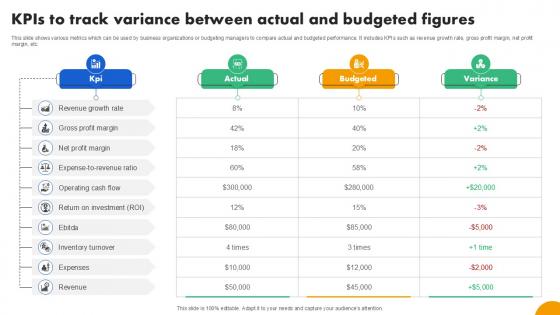
KPIs To Track Variance Between Strategies To Develop Effective Ppt PowerPoint Fin SS V
This slide shows various metrics which can be used by business organizations or budgeting managers to compare actual and budgeted performance. It includes KPIs such as revenue growth rate, gross profit margin, net profit margin, etc. Coming up with a presentation necessitates that the majority of the effort goes into the content and the message you intend to convey. The visuals of a PowerPoint presentation can only be effective if it supplements and supports the story that is being told. Keeping this in mind our experts created KPIs To Track Variance Between Strategies To Develop Effective Ppt PowerPoint Fin SS V to reduce the time that goes into designing the presentation. This way, you can concentrate on the message while our designers take care of providing you with the right template for the situation. This slide shows various metrics which can be used by business organizations or budgeting managers to compare actual and budgeted performance. It includes KPIs such as revenue growth rate, gross profit margin, net profit margin, etc.
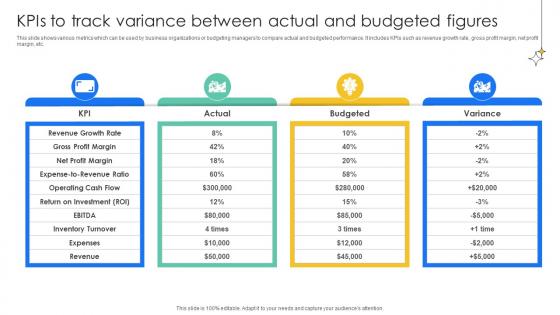
KPIs To Track Variance Between Actual Effective And Efficient Tools To Develop Fin SS V
This slide shows various metrics which can be used by business organizations or budgeting managers to compare actual and budgeted performance. It includes KPIs such as revenue growth rate, gross profit margin, net profit margin, etc. Coming up with a presentation necessitates that the majority of the effort goes into the content and the message you intend to convey. The visuals of a PowerPoint presentation can only be effective if it supplements and supports the story that is being told. Keeping this in mind our experts created KPIs To Track Variance Between Actual Effective And Efficient Tools To Develop Fin SS V to reduce the time that goes into designing the presentation. This way, you can concentrate on the message while our designers take care of providing you with the right template for the situation. This slide shows various metrics which can be used by business organizations or budgeting managers to compare actual and budgeted performance. It includes KPIs such as revenue growth rate, gross profit margin, net profit margin, etc.
Personalized Email Marketing Campaign Kpi Dashboard Guide For Data Driven Advertising Icons Pdf
This slide represents the key performance metrics to dashboard to monitor and analyze progress of personalized email marketing campaign conducted by the enterprise. It includes details related to KPIs such as wen conversions, subscribers, list growth rate etc.Coming up with a presentation necessitates that the majority of the effort goes into the content and the message you intend to convey. The visuals of a PowerPoint presentation can only be effective if it supplements and supports the story that is being told. Keeping this in mind our experts created Personalized Email Marketing Campaign Kpi Dashboard Guide For Data Driven Advertising Icons Pdf to reduce the time that goes into designing the presentation. This way, you can concentrate on the message while our designers take care of providing you with the right template for the situation. This slide represents the key performance metrics to dashboard to monitor and analyze progress of personalized email marketing campaign conducted by the enterprise. It includes details related to KPIs such as wen conversions, subscribers, list growth rate etc.
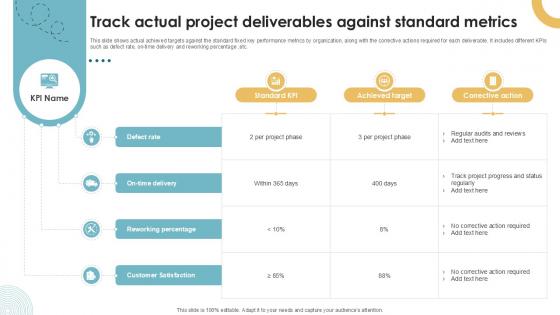
Track Actual Project Deliverables Against Standard Executing Quality Ppt Slides PM SS V
This slide shows actual achieved targets against the standard fixed key performance metrics by organization, along with the corrective actions required for each deliverable. It includes different KPIs such as defect rate, on-time delivery and reworking percentage ,etc. Coming up with a presentation necessitates that the majority of the effort goes into the content and the message you intend to convey. The visuals of a PowerPoint presentation can only be effective if it supplements and supports the story that is being told. Keeping this in mind our experts created Track Actual Project Deliverables Against Standard Executing Quality Ppt Slides PM SS V to reduce the time that goes into designing the presentation. This way, you can concentrate on the message while our designers take care of providing you with the right template for the situation. This slide shows actual achieved targets against the standard fixed key performance metrics by organization, along with the corrective actions required for each deliverable. It includes different KPIs such as defect rate, on-time delivery and reworking percentage ,etc.
Monthly Sales Performance Tracking Sales Performance Enhancement Background Pdf
This slide showcases a dashboard presenting various metrics to measure and analyze sales performance for revenue growth. It includes key components such as number of sales, revenue, profit, cost, sales revenue, sales increment, cost analysis and cross sell. Coming up with a presentation necessitates that the majority of the effort goes into the content and the message you intend to convey. The visuals of a PowerPoint presentation can only be effective if it supplements and supports the story that is being told. Keeping this in mind our experts created Monthly Sales Performance Tracking Sales Performance Enhancement Background Pdf to reduce the time that goes into designing the presentation. This way, you can concentrate on the message while our designers take care of providing you with the right template for the situation. This slide showcases a dashboard presenting various metrics to measure and analyze sales performance for revenue growth. It includes key components such as number of sales, revenue, profit, cost, sales revenue, sales increment, cost analysis and cross sell.
Performance Enhancement Plan Monthly Sales Performance Tracking And Monitoring Portrait Pdf
This slide showcases a dashboard presenting various metrics to measure and analyze sales performance for revenue growth. It includes key components such as number of sales, revenue, profit, cost, sales revenue, sales increment, cost analysis and cross sell. Coming up with a presentation necessitates that the majority of the effort goes into the content and the message you intend to convey. The visuals of a PowerPoint presentation can only be effective if it supplements and supports the story that is being told. Keeping this in mind our experts created Performance Enhancement Plan Monthly Sales Performance Tracking And Monitoring Portrait Pdf to reduce the time that goes into designing the presentation. This way, you can concentrate on the message while our designers take care of providing you with the right template for the situation. This slide showcases a dashboard presenting various metrics to measure and analyze sales performance for revenue growth. It includes key components such as number of sales, revenue, profit, cost, sales revenue, sales increment, cost analysis and cross sell.
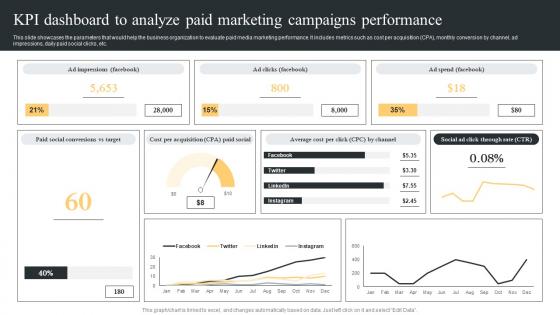
KPI Dashboard To Analyze Paid Comprehensive Guide For Paid Media Marketing Strategies Sample Pdf
This slide showcases the parameters that would help the business organization to evaluate paid media marketing performance. It includes metrics such as cost per acquisition CPA, monthly conversion by channel, ad impressions, daily paid social clicks, etc. Coming up with a presentation necessitates that the majority of the effort goes into the content and the message you intend to convey. The visuals of a PowerPoint presentation can only be effective if it supplements and supports the story that is being told. Keeping this in mind our experts created KPI Dashboard To Analyze Paid Comprehensive Guide For Paid Media Marketing Strategies Sample Pdf to reduce the time that goes into designing the presentation. This way, you can concentrate on the message while our designers take care of providing you with the right template for the situation. This slide showcases the parameters that would help the business organization to evaluate paid media marketing performance. It includes metrics such as cost per acquisition CPA, monthly conversion by channel, ad impressions, daily paid social clicks, etc.
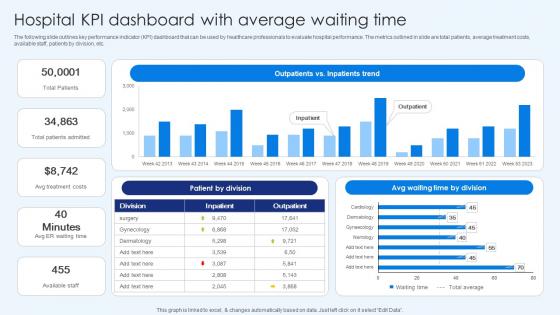
Hospital Kpi Dashboard With Average Waiting Time Healthcare Promotion Ideas Pdf
The following slide outlines key performance indicator KPI dashboard that can be used by healthcare professionals to evaluate hospital performance. The metrics outlined in slide are total patients, average treatment costs, available staff, patients by division, etc. Coming up with a presentation necessitates that the majority of the effort goes into the content and the message you intend to convey. The visuals of a PowerPoint presentation can only be effective if it supplements and supports the story that is being told. Keeping this in mind our experts created Hospital KPI Dashboard With Average Waiting Time Healthcare Promotion Ideas Pdf to reduce the time that goes into designing the presentation. This way, you can concentrate on the message while our designers take care of providing you with the right template for the situation. The following slide outlines key performance indicator KPI dashboard that can be used by healthcare professionals to evaluate hospital performance. The metrics outlined in slide are total patients, average treatment costs, available staff, patients by division, etc.
Performance Kpi Dashboard For Project Tracking And Control Pictures PDF
This slide covers project monitoring and control dashboard which can be used by PM. It provides information about metrics such as project health, actual budget, at risk project, start and finish date of the project. Showcasing this set of slides titled Performance Kpi Dashboard For Project Tracking And Control Pictures PDF. The topics addressed in these templates are Finance, Customer Support, Business Development. All the content presented in this PPT design is completely editable. Download it and make adjustments in color, background, font etc. as per your unique business setting.

Vendor Selection Prioritization Matrix And Request For Proposal Evaluation Sample PDF
This slide illustrates Response for Proposal RFP evaluation for selection of vendors. It includes metrics such as process fit, ease of use, services and support, performance etc. Showcasing this set of slides titled Vendor Selection Prioritization Matrix And Request For Proposal Evaluation Sample PDF. The topics addressed in these templates are Segments To Prioritize, Prioritization Matrix, Proposal Evaluation. All the content presented in this PPT design is completely editable. Download it and make adjustments in color, background, font etc. as per your unique business setting.
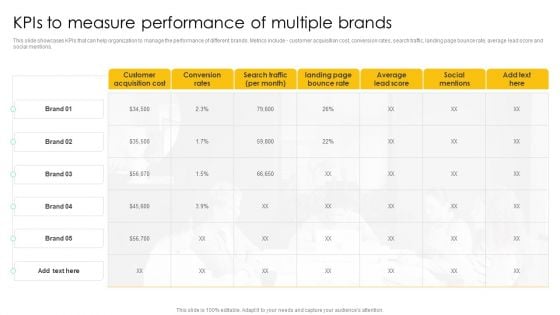
Kpis To Measure Performance Of Multiple Brands Elements PDF
This slide showcases KPIs that can help organization to manage the performance of different brands. Metrics include customer acquisition cost, conversion rates, search traffic, landing page bounce rate, average lead score and social mentions. Coming up with a presentation necessitates that the majority of the effort goes into the content and the message you intend to convey. The visuals of a PowerPoint presentation can only be effective if it supplements and supports the story that is being told. Keeping this in mind our experts created Kpis To Measure Performance Of Multiple Brands Elements PDF to reduce the time that goes into designing the presentation. This way, you can concentrate on the message while our designers take care of providing you with the right template for the situation.
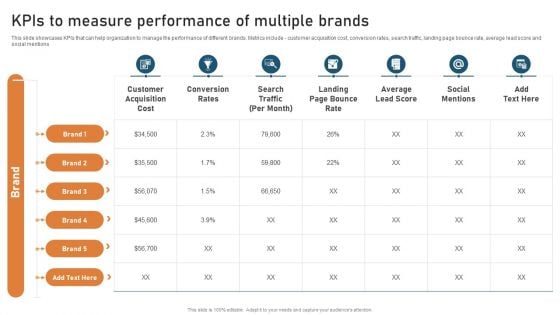
Targeted Market Entry Strategy Kpis To Measure Performance Of Multiple Brands Structure PDF
This slide showcases KPIs that can help organization to manage the performance of different brands. Metrics include - customer acquisition cost, conversion rates, search traffic, landing page bounce rate, average lead score and social mentions. Coming up with a presentation necessitates that the majority of the effort goes into the content and the message you intend to convey. The visuals of a PowerPoint presentation can only be effective if it supplements and supports the story that is being told. Keeping this in mind our experts created Targeted Market Entry Strategy Kpis To Measure Performance Of Multiple Brands Structure PDF to reduce the time that goes into designing the presentation. This way, you can concentrate on the message while our designers take care of providing you with the right template for the situation.
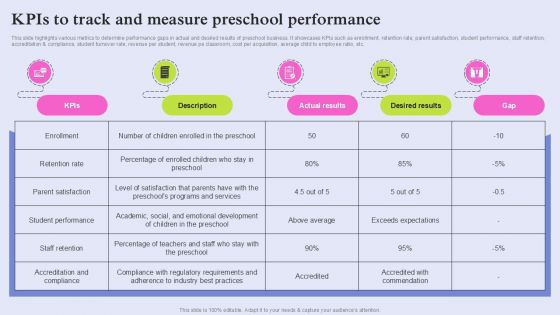
Pre School Marketing Strategy To Enhance Enrollment Rate Kpis To Track And Measure Preschool Diagrams PDF
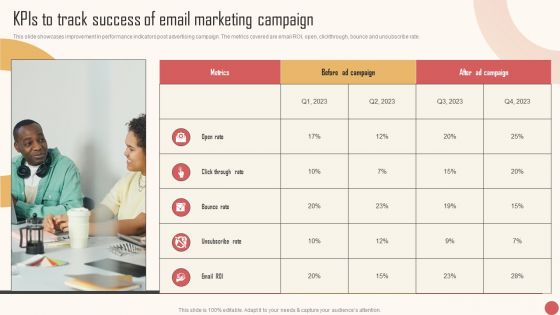
Kpis To Track Success Of Email Marketing Campaign Slides PDF
This slide showcases improvement in performance indicators post advertising campaign. The metrics covered are email ROI, open, clickthrough, bounce and unsubscribe rate. Coming up with a presentation necessitates that the majority of the effort goes into the content and the message you intend to convey. The visuals of a PowerPoint presentation can only be effective if it supplements and supports the story that is being told. Keeping this in mind our experts created Kpis To Track Success Of Email Marketing Campaign Slides PDF to reduce the time that goes into designing the presentation. This way, you can concentrate on the message while our designers take care of providing you with the right template for the situation.
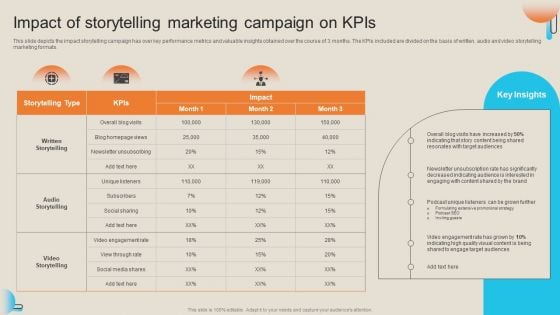
Comprehensive Guide For Storytelling Promotion Impact Of Storytelling Marketing Campaign On Kpis Introduction PDF
This slide depicts the impact storytelling campaign has over key performance metrics and valuable insights obtained over the course of 3 months. The KPIs included are divided on the basis of written, audio and video storytelling marketing formats. Coming up with a presentation necessitates that the majority of the effort goes into the content and the message you intend to convey. The visuals of a PowerPoint presentation can only be effective if it supplements and supports the story that is being told. Keeping this in mind our experts created v to reduce the time that goes into designing the presentation. This way, you can concentrate on the message while our designers take care of providing you with the right template for the situation.
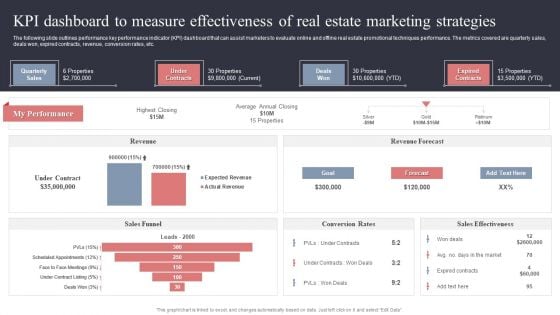
KPI Dashboard To Measure Effectiveness Of Real Estate Marketing Strategies Inspiration PDF
The following slide outlines performance key performance indicator KPI dashboard that can assist marketers to evaluate online and offline real estate promotional techniques performance. The metrics covered are quarterly sales, deals won, expired contracts, revenue, conversion rates, etc. Coming up with a presentation necessitates that the majority of the effort goes into the content and the message you intend to convey. The visuals of a PowerPoint presentation can only be effective if it supplements and supports the story that is being told. Keeping this in mind our experts created KPI Dashboard To Measure Effectiveness Of Real Estate Marketing Strategies Inspiration PDF to reduce the time that goes into designing the presentation. This way, you can concentrate on the message while our designers take care of providing you with the right template for the situation.
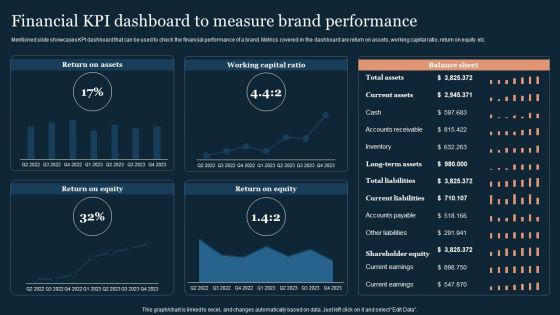
Guide To Develop And Estimate Brand Value Financial KPI Dashboard To Measure Brand Performance Formats PDF
Mentioned slide showcases KPI dashboard that can be used to check the financial performance of a brand. Metrics covered in the dashboard are return on assets, working capital ratio, return on equity etc.Coming up with a presentation necessitates that the majority of the effort goes into the content and the message you intend to convey. The visuals of a PowerPoint presentation can only be effective if it supplements and supports the story that is being told. Keeping this in mind our experts created Guide To Develop And Estimate Brand Value Financial KPI Dashboard To Measure Brand Performance Formats PDF to reduce the time that goes into designing the presentation. This way, you can concentrate on the message while our designers take care of providing you with the right template for the situation.
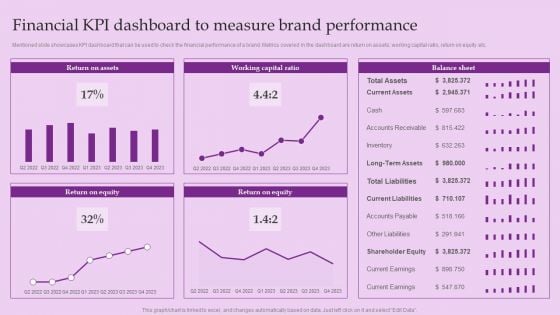
Financial KPI Dashboard To Measure Brand Performance Brand And Equity Evaluation Techniques Elements PDF
Mentioned slide showcases KPI dashboard that can be used to check the financial performance of a brand. Metrics covered in the dashboard are return on assets, working capital ratio, return on equity etc.Coming up with a presentation necessitates that the majority of the effort goes into the content and the message you intend to convey. The visuals of a PowerPoint presentation can only be effective if it supplements and supports the story that is being told. Keeping this in mind our experts created Financial KPI Dashboard To Measure Brand Performance Brand And Equity Evaluation Techniques Elements PDF to reduce the time that goes into designing the presentation. This way, you can concentrate on the message while our designers take care of providing you with the right template for the situation.
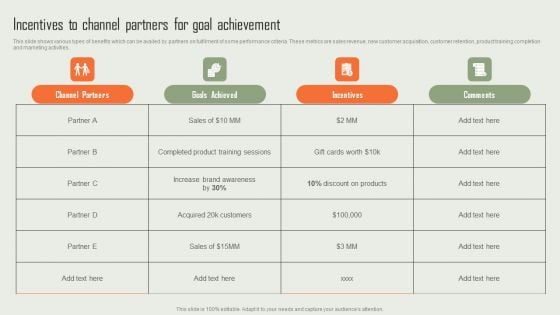
Product Marketing And Sales Expansion Through Channel Incentives To Channel Partners For Goal Achievement Infographics PDF
Social Networks Marketing To Improve Facebook Advertising Performance Tracking Icons PDF
This slide shows the dashboard to track and measure the performance of Facebook advertising campaign. It includes key metrics such as ad spend, cost per thousand, cost per click, click through rate etc. Coming up with a presentation necessitates that the majority of the effort goes into the content and the message you intend to convey. The visuals of a PowerPoint presentation can only be effective if it supplements and supports the story that is being told. Keeping this in mind our experts created Social Networks Marketing To Improve Facebook Advertising Performance Tracking Icons PDF to reduce the time that goes into designing the presentation. This way, you can concentrate on the message while our designers take care of providing you with the right template for the situation.
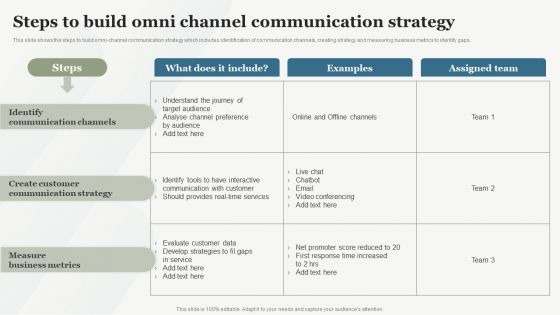
Boosting Customer Base Through Effective Steps To Build Omni Channel Communication Demonstration PDF
This slide shows the steps to build omni-channel communication strategy which includes identification of communication channels, creating strategy and measuring business metrics to identify gaps. Coming up with a presentation necessitates that the majority of the effort goes into the content and the message you intend to convey. The visuals of a PowerPoint presentation can only be effective if it supplements and supports the story that is being told. Keeping this in mind our experts created Boosting Customer Base Through Effective Steps To Build Omni Channel Communication Demonstration PDF to reduce the time that goes into designing the presentation. This way, you can concentrate on the message while our designers take care of providing you with the right template for the situation.
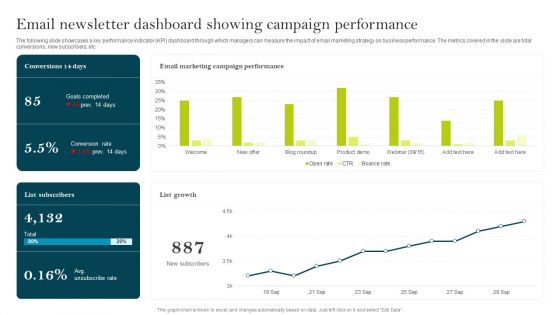
Email Newsletter Dashboard Showing Campaign Performance Ppt PowerPoint Presentation File Infographic Template PDF
The following slide showcases a key performance indicator KPI dashboard through which managers can measure the impact of email marketing strategy on business performance. The metrics covered in the slide are total conversions, new subscribers, etc. Coming up with a presentation necessitates that the majority of the effort goes into the content and the message you intend to convey. The visuals of a PowerPoint presentation can only be effective if it supplements and supports the story that is being told. Keeping this in mind our experts created Email Newsletter Dashboard Showing Campaign Performance Ppt PowerPoint Presentation File Infographic Template PDF to reduce the time that goes into designing the presentation. This way, you can concentrate on the message while our designers take care of providing you with the right template for the situation.
Monthly Sales Performance Tracking And Monitoring Dashboard Inspiration PDF
This slide showcases a dashboard presenting various metrics to measure and analyze sales performance for revenue growth. It includes key components such as number of sales, revenue, profit, cost, sales revenue, sales increment, cost analysis and cross sell. Coming up with a presentation necessitates that the majority of the effort goes into the content and the message you intend to convey. The visuals of a PowerPoint presentation can only be effective if it supplements and supports the story that is being told. Keeping this in mind our experts created Monthly Sales Performance Tracking And Monitoring Dashboard Inspiration PDF to reduce the time that goes into designing the presentation. This way, you can concentrate on the message while our designers take care of providing you with the right template for the situation.
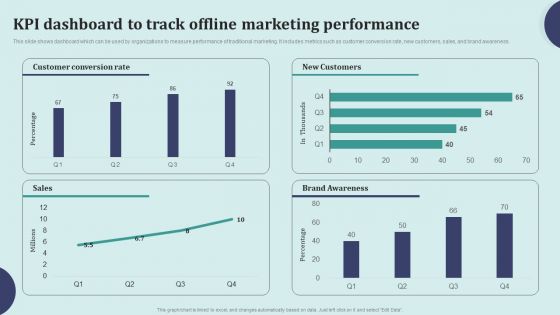
Offline Marketing Techniques To Elevate Brand Visibility KPI Dashboard To Track Offline Formats PDF
This slide shows dashboard which can be used by organizations to measure performance of traditional marketing. It includes metrics such as customer conversion rate, new customers, sales, and brand awareness. Coming up with a presentation necessitates that the majority of the effort goes into the content and the message you intend to convey. The visuals of a PowerPoint presentation can only be effective if it supplements and supports the story that is being told. Keeping this in mind our experts created Offline Marketing Techniques To Elevate Brand Visibility KPI Dashboard To Track Offline Formats PDF to reduce the time that goes into designing the presentation. This way, you can concentrate on the message while our designers take care of providing you with the right template for the situation.
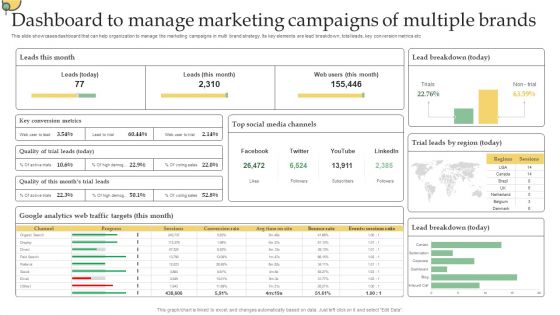
Dashboard To Manage Marketing Campaigns Of Multiple Brands Ppt PowerPoint Presentation Diagram PDF
This slide showcases dashboard that can help organization to manage the marketing campaigns in multi brand strategy. Its key elements are lead breakdown, total leads, key conversion metrics etc. Coming up with a presentation necessitates that the majority of the effort goes into the content and the message you intend to convey. The visuals of a PowerPoint presentation can only be effective if it supplements and supports the story that is being told. Keeping this in mind our experts created Dashboard To Manage Marketing Campaigns Of Multiple Brands Ppt PowerPoint Presentation Diagram PDF to reduce the time that goes into designing the presentation. This way, you can concentrate on the message while our designers take care of providing you with the right template for the situation.
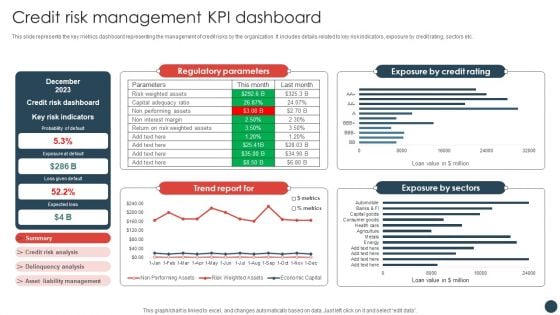
Strategic Risk Management Plan Credit Risk Management KPI Dashboard Information PDF
This slide represents the key metrics dashboard representing the management of credit risks by the organization. It includes details related to key risk indicators, exposure by credit rating, sectors etc.Coming up with a presentation necessitates that the majority of the effort goes into the content and the message you intend to convey. The visuals of a PowerPoint presentation can only be effective if it supplements and supports the story that is being told. Keeping this in mind our experts created Strategic Risk Management Plan Credit Risk Management KPI Dashboard Information PDF to reduce the time that goes into designing the presentation. This way, you can concentrate on the message while our designers take care of providing you with the right template for the situation.
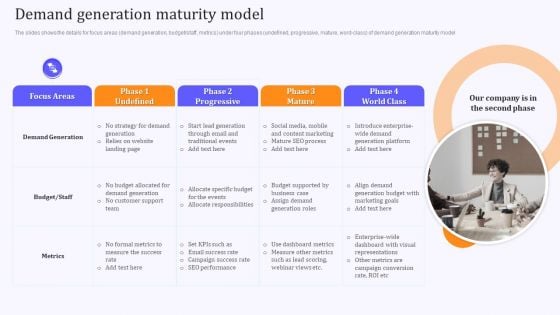
Product Marketing And Awareness Programs Demand Generation Maturity Model Rules PDF
The slides shows the details for focus areas demand generation, budget or staff, metrics under four phases undefined, progressive, mature, word-class of demand generation maturity model. Coming up with a presentation necessitates that the majority of the effort goes into the content and the message you intend to convey. The visuals of a PowerPoint presentation can only be effective if it supplements and supports the story that is being told. Keeping this in mind our experts created Product Marketing And Awareness Programs Demand Generation Maturity Model Rules PDF to reduce the time that goes into designing the presentation. This way, you can concentrate on the message while our designers take care of providing you with the right template for the situation.
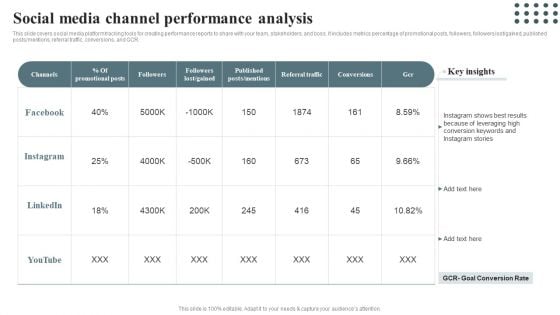
Techniques For Enhancing Buyer Acquisition Social Media Channel Performance Analysis Inspiration PDF
This slide covers social media platform tracking tools for creating performance reports to share with your team, stakeholders, and boss. It includes metrics percentage of promotional posts, followers, followers lost gained, published posts or mentions, referral traffic, conversions, and GCR. Coming up with a presentation necessitates that the majority of the effort goes into the content and the message you intend to convey. The visuals of a PowerPoint presentation can only be effective if it supplements and supports the story that is being told. Keeping this in mind our experts created Techniques For Enhancing Buyer Acquisition Social Media Channel Performance Analysis Inspiration PDF to reduce the time that goes into designing the presentation. This way, you can concentrate on the message while our designers take care of providing you with the right template for the situation.
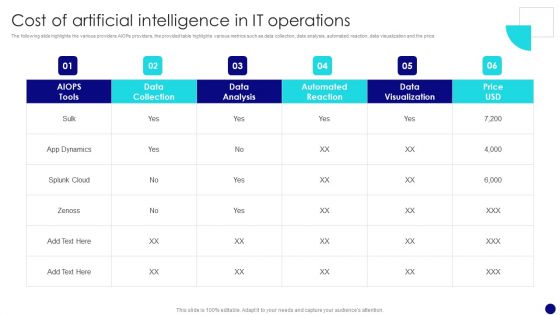
Information Technology Operations Administration With ML Cost Of Artificial Intelligence Information PDF
The following slide highlights the various providers AIOPs providers, the provided table highlights various metrics such as data collection, data analysis, automated reaction, data visualization and the price. Coming up with a presentation necessitates that the majority of the effort goes into the content and the message you intend to convey. The visuals of a PowerPoint presentation can only be effective if it supplements and supports the story that is being told. Keeping this in mind our experts created Information Technology Operations Administration With ML Cost Of Artificial Intelligence Information PDF to reduce the time that goes into designing the presentation. This way, you can concentrate on the message while our designers take care of providing you with the right template for the situation.
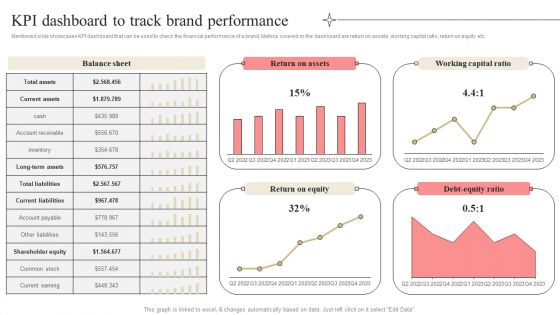
Developing Market Leading Businesses KPI Dashboard To Track Brand Performance Summary PDF
Mentioned slide showcases KPI dashboard that can be used to check the financial performance of a brand. Metrics covered in the dashboard are return on assets, working capital ratio, return on equity etc. Coming up with a presentation necessitates that the majority of the effort goes into the content and the message you intend to convey. The visuals of a PowerPoint presentation can only be effective if it supplements and supports the story that is being told. Keeping this in mind our experts created Developing Market Leading Businesses KPI Dashboard To Track Brand Performance Summary PDF to reduce the time that goes into designing the presentation. This way, you can concentrate on the message while our designers take care of providing you with the right template for the situation.
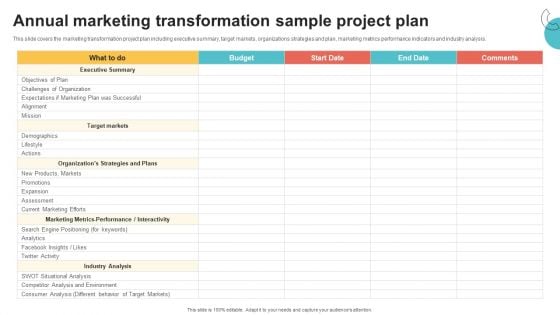
Digital Marketing Toolkit Annual Marketing Transformation Sample Project Plan Rules PDF
This slide covers the marketing transformation project plan including executive summary, target markets, organizations strategies and plan, marketing metrics performance indicators and industry analysis. Coming up with a presentation necessitates that the majority of the effort goes into the content and the message you intend to convey. The visuals of a PowerPoint presentation can only be effective if it supplements and supports the story that is being told. Keeping this in mind our experts created Digital Marketing Toolkit Annual Marketing Transformation Sample Project Plan Rules PDF to reduce the time that goes into designing the presentation. This way, you can concentrate on the message while our designers take care of providing you with the right template for the situation.
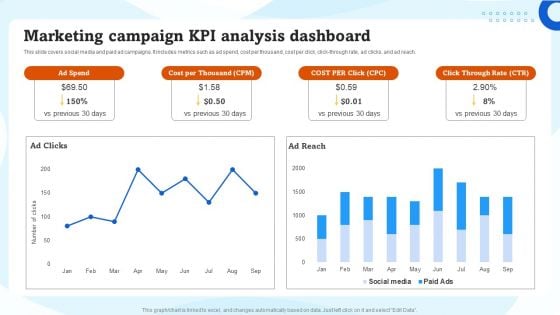
Marketing Campaign KPI Analysis Dashboard Ppt Inspiration Example File PDF
This slide covers social media and paid ad campaigns. It includes metrics such as ad spend, cost per thousand, cost per click, click-through rate, ad clicks, and ad reach. Coming up with a presentation necessitates that the majority of the effort goes into the content and the message you intend to convey. The visuals of a PowerPoint presentation can only be effective if it supplements and supports the story that is being told. Keeping this in mind our experts created Marketing Campaign KPI Analysis Dashboard Ppt Inspiration Example File PDF to reduce the time that goes into designing the presentation. This way, you can concentrate on the message while our designers take care of providing you with the right template for the situation.
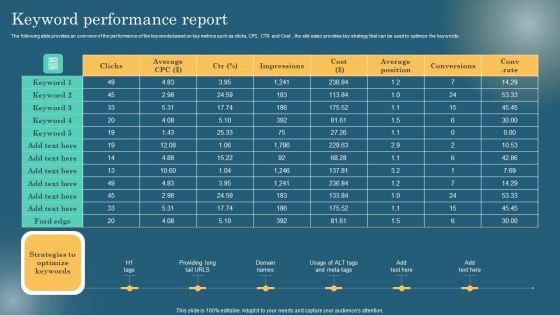
Maximizing Online Visibility Using Off Site SEO Techniques Keyword Performance Report Portrait PDF
The following slide provides an overview of the performance of the keywords based on key metrics such as clicks, CPS, CTR and Cost , the slid ealso provides key strategy that can be used to optimize the keywords. Coming up with a presentation necessitates that the majority of the effort goes into the content and the message you intend to convey. The visuals of a PowerPoint presentation can only be effective if it supplements and supports the story that is being told. Keeping this in mind our experts created Maximizing Online Visibility Using Off Site SEO Techniques Keyword Performance Report Portrait PDF to reduce the time that goes into designing the presentation. This way, you can concentrate on the message while our designers take care of providing you with the right template for the situation.
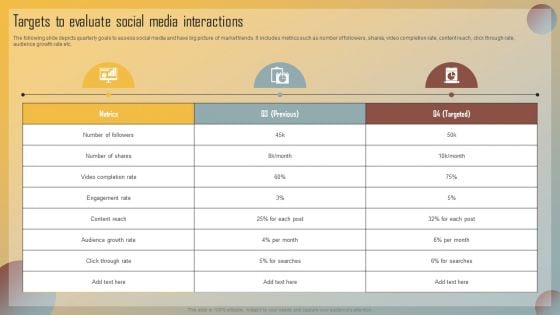
Guide For Marketing Analytics To Improve Decisions Targets To Evaluate Social Media Interactions Professional PDF
The following slide depicts quarterly goals to assess social media and have big picture of market trends. It includes metrics such as number of followers, shares, video completion rate, content reach, click through rate, audience growth rate etc. Coming up with a presentation necessitates that the majority of the effort goes into the content and the message you intend to convey. The visuals of a PowerPoint presentation can only be effective if it supplements and supports the story that is being told. Keeping this in mind our experts created Guide For Marketing Analytics To Improve Decisions Targets To Evaluate Social Media Interactions Professional PDF to reduce the time that goes into designing the presentation. This way, you can concentrate on the message while our designers take care of providing you with the right template for the situation.
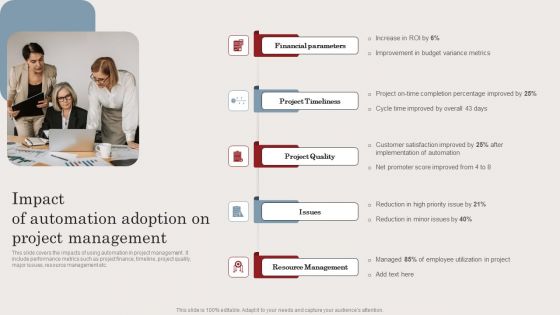
Impact Of Automation Adoption On Project Management Ppt Portfolio Templates PDF
This slide covers the impacts of using automation in project management . It include performance metrics such as project finance, timeline, project quality, major issues, resource management etc. Coming up with a presentation necessitates that the majority of the effort goes into the content and the message you intend to convey. The visuals of a PowerPoint presentation can only be effective if it supplements and supports the story that is being told. Keeping this in mind our experts created Impact Of Automation Adoption On Project Management Ppt Portfolio Templates PDF to reduce the time that goes into designing the presentation. This way, you can concentrate on the message while our designers take care of providing you with the right template for the situation.
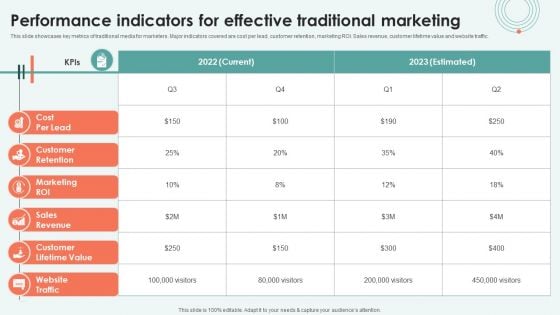
Performance Indicators For Effective Traditional Marketing Ppt Show Influencers PDF
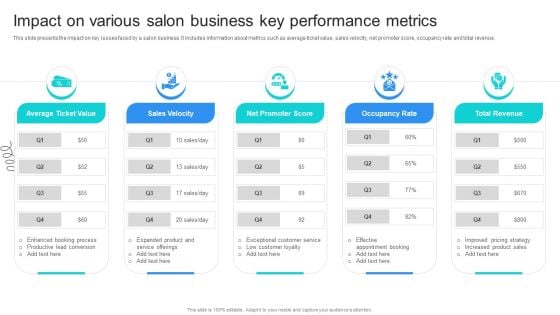
Strategic Marketing For Hair And Beauty Salon To Increase Impact On Various Salon Business Rules PDF
This slide presents the impact on key issues faced by a salon business. It includes information about metrics such as average ticket value, sales velocity, net promoter score, occupancy rate and total revenue. Coming up with a presentation necessitates that the majority of the effort goes into the content and the message you intend to convey. The visuals of a PowerPoint presentation can only be effective if it supplements and supports the story that is being told. Keeping this in mind our experts created Strategic Marketing For Hair And Beauty Salon To Increase Impact On Various Salon Business Rules PDF to reduce the time that goes into designing the presentation. This way, you can concentrate on the message while our designers take care of providing you with the right template for the situation.
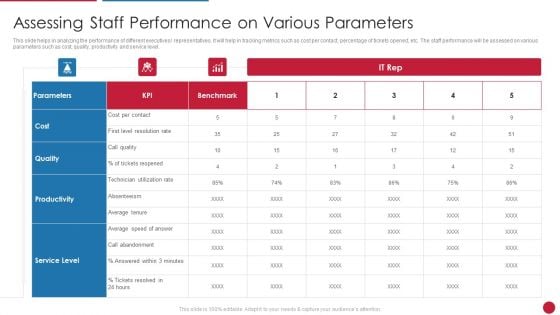
Facilitating IT Intelligence Architecture Assessing Staff Performance On Various Parameters Structure PDF
This slide helps in analyzing the performance of different executives representatives. It will help in tracking metrics such as cost per contact, percentage of tickets opened, etc. The staff performance will be assessed on various parameters such as cost, quality, productivity and service level. Deliver and pitch your topic in the best possible manner with this Facilitating IT Intelligence Architecture Assessing Staff Performance On Various Parameters Structure PDF Use them to share invaluable insights on Absenteeism, Productivity, Parameters and impress your audience. This template can be altered and modified as per your expectations. So, grab it now.
Impeccable Information Technology Facility Measuring IT Staff Performance Ppt Icon Design Templates PDF
This slide helps in analyzing the performance of different IT executives or representatives. It will help in tracking metrics such as cost per contact, percentage of tickets opened, etc. The staff performance will be assessed on various parameters such as cost, quality, productivity and service level. Deliver an awe-inspiring pitch with this creative impeccable information technology facility measuring it staff performance ppt icon design templates pdf bundle. Topics like service level, productivity, quality, cost can be discussed with this completely editable template. It is available for immediate download depending on the needs and requirements of the user.


 Continue with Email

 Home
Home


