Survey Icon
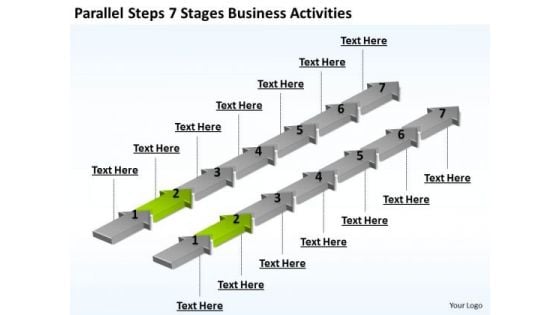
Power Point Arrow Presentation Activities PowerPoint Templates Backgrounds For Slides
3d, achievement, aim, arrows, business, career, chart, development, direction, diversity, education, financial, forecast, forward, glossy, graph, group, growth, higher, icon, increase, internet, investment, leader, leadership, moving, onwards, outlook, path, plan, prediction, price, profit, progress, property, race, sales, series, success, target, team, teamwork, turn, upwards, vector, win, winner Carry it off elegantly with our Power Point Arrow Presentation Activities PowerPoint Templates Backgrounds For Slides. Get your thoughts into fashion.
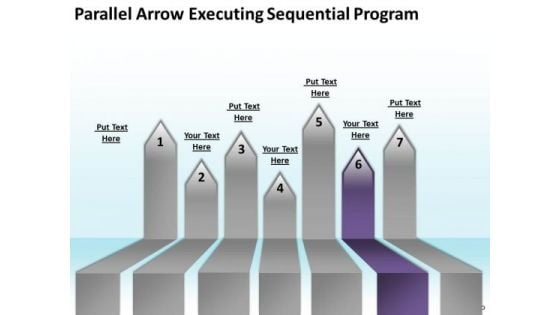
PowerPoint Arrows Parallel Executing Sequential Program Slides
abstract, achievement, aim, arrow, blue, business, button, career, chart, color, communication, competition, concept, development, direction, education, financial, forecast, forward, glossy, gradient, graph, group, growth, higher, icon, illustration, increase, investment, leader, leadership, moving, onwards, outlook, path, plan, prediction, price, profit, progress, property, sales, series, success, target, team, teamwork, upwards, vector, yellow Never fail to impress with our PowerPoint Arrows Parallel Executing Sequential Program Slides. You will be at the top of your game.
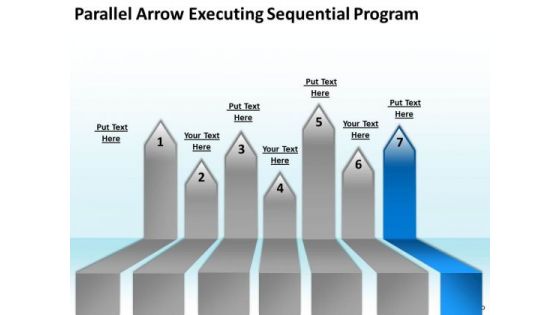
PowerPoint Circular Arrows Parallel Executing Sequential Program Slides
abstract, achievement, aim, arrow, blue, business, button, career, chart, color, communication, competition, concept, development, direction, education, financial, forecast, forward, glossy, gradient, graph, group, growth, higher, icon, illustration, increase, investment, leader, leadership, moving, onwards, outlook, path, plan, prediction, price, profit, progress, property, sales, series, success, target, team, teamwork, upwards, vector, yellow Win easily with our PowerPoint Circular Arrows Parallel Executing Sequential Program Slides. Download without worries with our money back guaranteee.
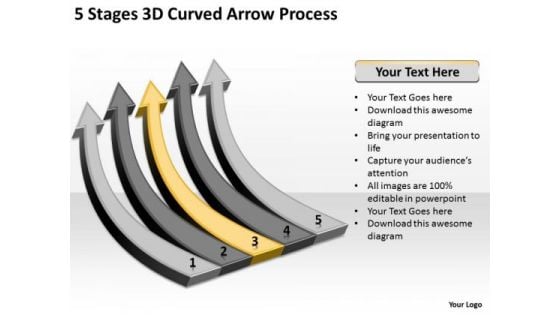
Power Point Arrows 5 Stages 3d Curved Process Ppt PowerPoint Slides
3d, achievement, aim, arrow, background, blue, career, chart, communication, competition, concept, curve, design, development, direction, education, financial, forecast, forward, glossy, graph, graphic, group, growth, icon, illustration, increase, investment, moving, outlook, path, plan, price, profit, progress, race, sales, start, success, target, team, three, turn, up, upwards, win, winner Our Power Point Arrows 5 Stages 3d Curved Process Ppt PowerPoint Slides ensure approval. Your ideas will fit the bill.
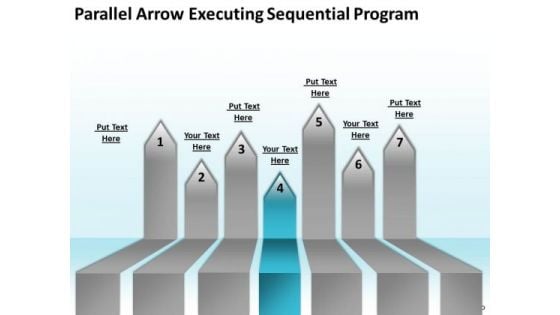
PowerPoint Arrows Parallel Executing Sequential Program Templates
abstract, achievement, aim, arrow, blue, business, button, career, chart, color, communication, competition, concept, development, direction, education, financial, forecast, forward, glossy, gradient, graph, group, growth, higher, icon, illustration, increase, investment, leader, leadership, moving, onwards, outlook, path, plan, prediction, price, profit, progress, property, sales, series, success, target, team, teamwork, upwards, vector, yellow Our PowerPoint Arrows Parallel Executing Sequential Program Templates are like a deep breath. They ensure your ideas endure.
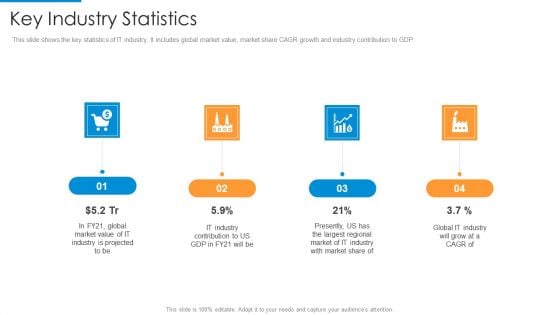
Key Industry Statistics Formats PDF
Presenting key industry statistics formats pdf to provide visual cues and insights. Share and navigate important information on four stages that need your due attention. This template can be used to pitch topics like key industry statistics. In addtion, this PPT design contains high resolution images, graphics, etc, that are easily editable and available for immediate download.
Pie Chart For Data Presentation Vector Ppt PowerPoint Presentation Summary Files
Presenting this set of slides with name pie chart for data presentation vector ppt powerpoint presentation summary files. The topics discussed in these slides are data visualization icon, research analysis, business focus. This is a completely editable PowerPoint presentation and is available for immediate download. Download now and impress your audience.
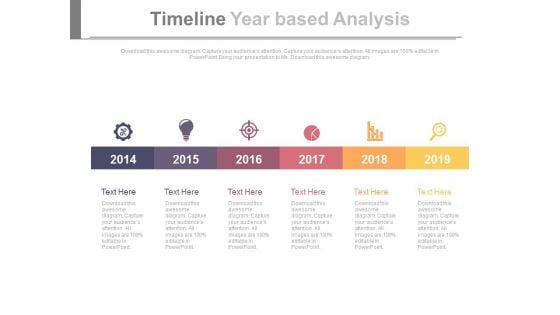
Six Steps Timeline For Business Research And Analysis Powerpoint Slides
This timeline slide design can be used to display yearly business growth. It contains linear steps with icons. This timeline template can be used in presentations where you need to display research and analysis or it may be used for business target analysis.
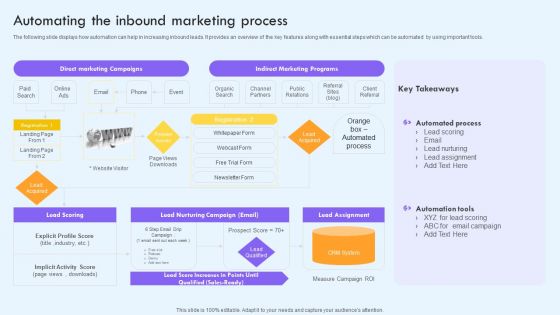
Automating The Inbound Marketing Process Ppt PowerPoint Presentation Diagram Lists PDF
The following slide displays how automation can help in increasing inbound leads. It provides an overview of the key features along with essential steps which can be automated by using important tools. The following slide displays how automation can help in increasing inbound leads. It provides an overview of the key features along with essential steps which can be automated by using important tools. Want to ace your presentation in front of a live audience Our Automating The Inbound Marketing Process Ppt PowerPoint Presentation Diagram Lists PDF can help you do that by engaging all the users towards you. Slidegeeks experts have put their efforts and expertise into creating these impeccable powerpoint presentations so that you can communicate your ideas clearly. Moreover, all the templates are customizable, and easy to edit and downloadable. Use these for both personal and commercial use.
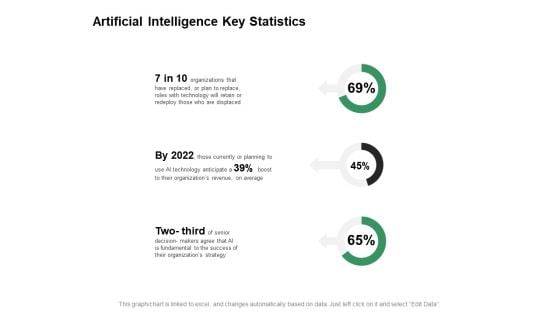
Artificial Intelligence Key Statistics Ppt PowerPoint Presentation Ideas
Presenting this set of slides with name artificial intelligence key statistics ppt powerpoint presentation ideas. The topics discussed in these slides are finance, marketing, management, investment, analysis. This is a completely editable PowerPoint presentation and is available for immediate download. Download now and impress your audience.

Artificial Intelligence Key Statistics Ppt PowerPoint Presentation File Clipart
Presenting this set of slides with name artificial intelligence key statistics ppt powerpoint presentation file clipart. The topics discussed in these slides are finance, marketing, management, investment, analysis. This is a completely editable PowerPoint presentation and is available for immediate download. Download now and impress your audience.
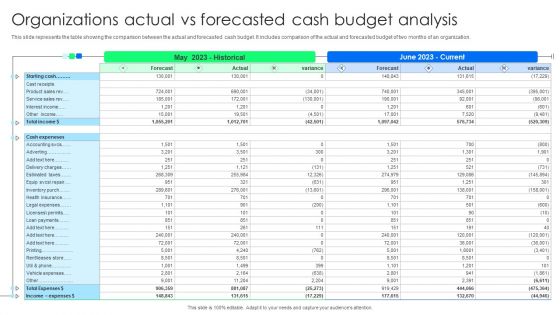
Organizations Actual Vs Forecasted Cash Budget Analysis Graphics PDF
This slide represents the table showing the comparison between the actual and forecasted cash budget. It includes comparison of the actual and forecasted budget of two months of an organization. Pitch your topic with ease and precision using this Organizations Actual Vs Forecasted Cash Budget Analysis Graphics PDF. This layout presents information on Organizations Actual, Forecasted Cash Budget Analysis. It is also available for immediate download and adjustment. So, changes can be made in the color, design, graphics or any other component to create a unique layout.
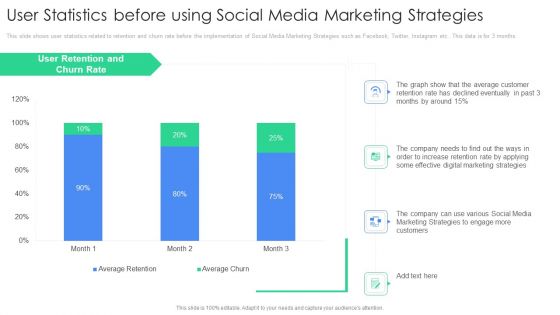
User Statistics Before Using Social Media Marketing Strategies Diagrams PDF
This slide shows user statistics related to retention and churn rate before the implementation of Social Media Marketing Strategies such as Facebook, Twitter, Instagram etc.. This data is for 3 months. Deliver an awe inspiring pitch with this creative user statistics before using social media marketing strategies diagrams pdf bundle. Topics like user statistics before using social media marketing strategies can be discussed with this completely editable template. It is available for immediate download depending on the needs and requirements of the user.
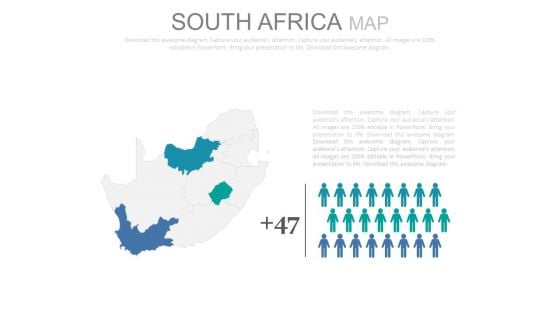
South Africa Map With Population Ratio Analysis Powerpoint Slides
This PowerPoint map template has been designed with map of South Africa and human icons. Use this map template to display gender population ratio analysis in your presentations. Any text can be entered at any point in the PowerPoint map slide.

3d Smiling Snowman Holidays PowerPoint Templates Ppt Backgrounds For Slides 1112
We present our 3d Smiling Snowman Holidays PowerPoint Templates PPT Backgrounds For Slides 1112.Present our Christmas PowerPoint Templates because you can Embrace the overwhelming mood of the season. Download and present our Festival PowerPoint Templates because they have always been a source of inspiration for us all. Download and present our Holidays PowerPoint Templates because The search for new holiday spots is an ongoing quest for many. Slightly off the beaten track but worth a visit. Download and present our Signs PowerPoint Templates because they help to focus the thoughts of your listeners. Use our Stars PowerPoint Templates because you can Inform your team of the various means they have to achieve them.Use these PowerPoint slides for presentations relating to Snowman over green background, christmas, festival, holidays, signs, stars . The prominent colors used in the PowerPoint template are White, Red, Green. Customers tell us our 3d Smiling Snowman With Green Background Holidays PowerPoint Templates PPT Backgrounds For Slides 1112 are Magical. Use our green PowerPoint templates and PPT Slides are Playful. People tell us our 3d Smiling Snowman With Green Background Holidays PowerPoint Templates PPT Backgrounds For Slides 1112 will make you look like a winner. PowerPoint presentation experts tell us our christmas PowerPoint templates and PPT Slides are Detailed. You can be sure our 3d Smiling Snowman With Green Background Holidays PowerPoint Templates PPT Backgrounds For Slides 1112 are Spiffy. The feedback we get is that our holidays PowerPoint templates and PPT Slides are Fancy. Enumerate your ideas with our 3d Smiling Snowman Holidays PowerPoint Templates Ppt Backgrounds For Slides 1112. Prioritize them as per your wish.

Three Years Sales Quantity Forecast Analysis Graphics PDF
Pitch your topic with ease and precision using this Three Years Sales Quantity Forecast Analysis Graphics PDF. This layout presents information on Three Years Sales, Quantity Forecast Analysis. It is also available for immediate download and adjustment. So, changes can be made in the color, design, graphics or any other component to create a unique layout.

Analysis Between Actual And Forecasted Financial Budget Infographics PDF
This slide shows the table representing the comparison between actual and forecasted financial budget of an ecommerce company. It includes details related to investments, start and finish date, budget, actual to date, budget remaining, Percent spent, forecast calculated and remaining etc. Showcasing this set of slides titled Analysis Between Actual And Forecasted Financial Budget Infographics PDF. The topics addressed in these templates are External Labor, Budget Remaining, Forecast Remaining. All the content presented in this PPT design is completely editable. Download it and make adjustments in color, background, font etc. as per your unique business setting.
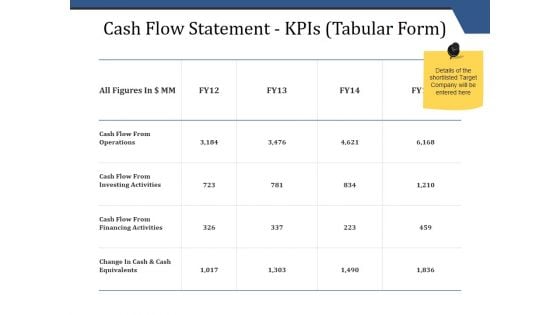
Cash Flow Statement Kpis Tabular Form Ppt PowerPoint Presentation Inspiration Master Slide
This is a cash flow statement kpis tabular form ppt powerpoint presentation inspiration master slide. This is a four stage process. The stages in this process are operations, financing activities, investing activities, net increase in cash.
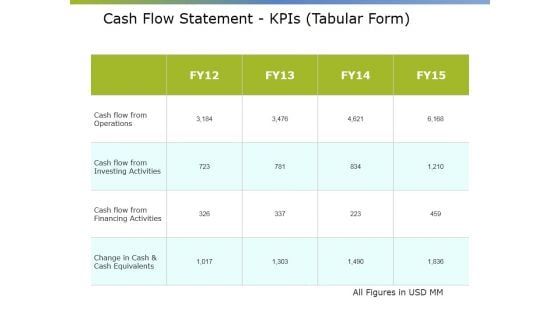
Cash Flow Statement Kpis Tabular Form Ppt PowerPoint Presentation Summary Elements
This is a cash flow statement kpis tabular form ppt powerpoint presentation summary elements. This is a four stage process. The stages in this process are net increase cash, financial activities, operations, investing activities.
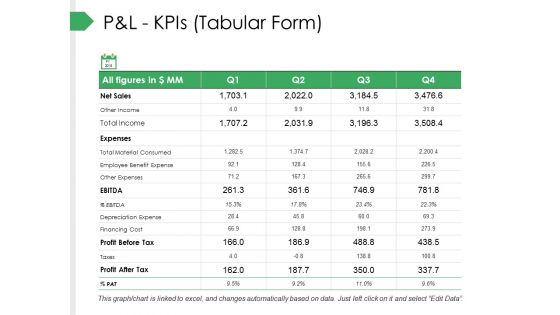
P And L Kpis Tabular Form Ppt PowerPoint Presentation Pictures Gallery
This is a p and l kpis tabular form ppt powerpoint presentation pictures gallery. This is a four stage process. The stages in this process are business, marketing, graph, strategy, finance.
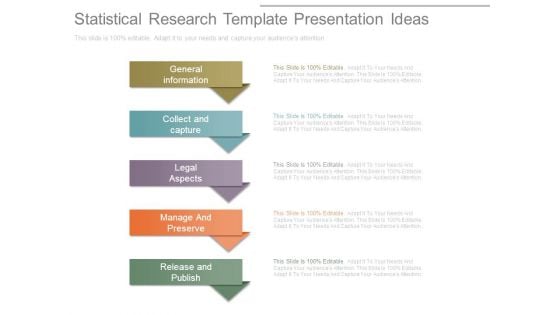
Statistical Research Template Presentation Ideas
This is a statistical research template presentation ideas. This is a five stage process. The stages in this process are general information, collect and capture, legal aspects, manage and preserve, release and publish.
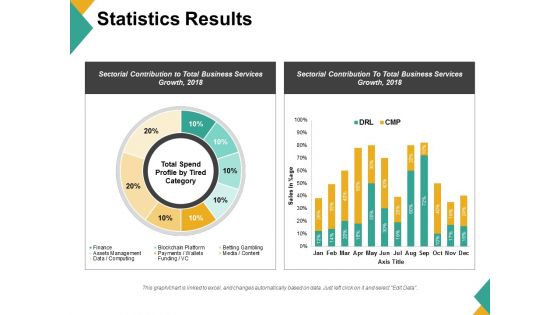
Statistics Results Ppt PowerPoint Presentation Gallery Graphics Pictures
This is a statistics results ppt powerpoint presentation gallery graphics pictures. This is a two stage process. The stages in this process are business, finance, marketing, strategy, analysis.
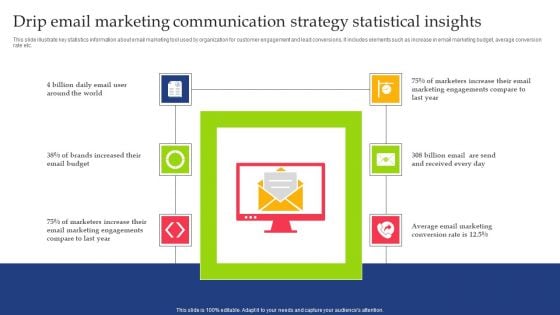
Drip Email Marketing Communication Strategy Statistical Insights Diagrams PDF
Persuade your audience using this Drip Email Marketing Communication Strategy Statistical Insights Diagrams PDF. This PPT design covers Six stages, thus making it a great tool to use. It also caters to a variety of topics including Communication Strategy, Statistical Insight. Download this PPT design now to present a convincing pitch that not only emphasizes the topic but also showcases your presentation skills.
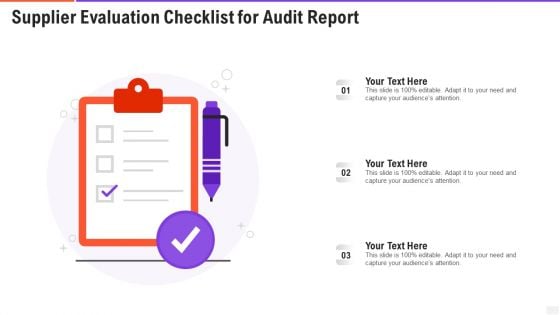
Supplier Evaluation Checklist For Audit Report Diagrams PDF
Persuade your audience using this supplier evaluation checklist for audit report diagrams pdf. This PPT design covers three stages, thus making it a great tool to use. It also caters to a variety of topics including supplier evaluation checklist for audit report. Download this PPT design now to present a convincing pitch that not only emphasizes the topic but also showcases your presentation skills.
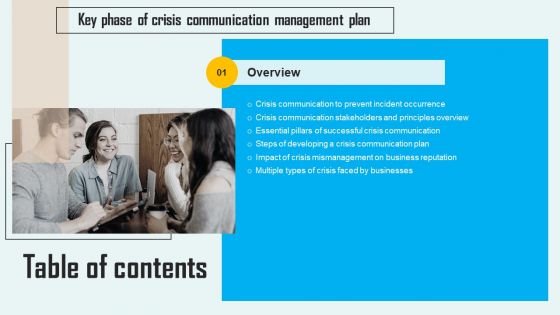
Key Phase Of Crisis Communication Management Plan Table Of Content Designs PDF
Are you searching for a Key Phase Of Crisis Communication Management Plan Table Of Content Designs PDF that is uncluttered, straightforward, and original Its easy to edit, and you can change the colors to suit your personal or business branding. For a presentation that expresses how much effort you have put in, this template is ideal. With all of its features, including tables, diagrams, statistics, and lists, its perfect for a business plan presentation. Make your ideas more appealing with these professional slides. Download Key Phase Of Crisis Communication Management Plan Table Of Content Designs PDF from Slidegeeks today.
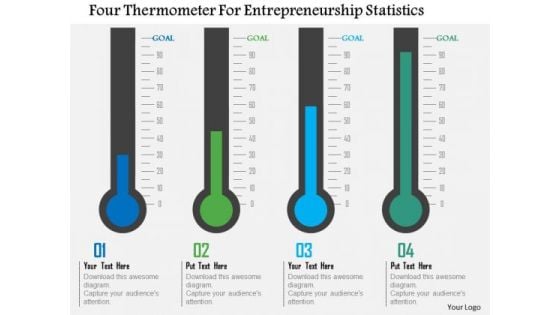
Business Diagram Four Thermometer For Entrepreneurship Statistics Presentation Template
Graphic of thermometers have been used to design this business diagram. Thermometers can be used to display entrepreneurship statistics. Use this diagram your data and information related topics in any presentation.
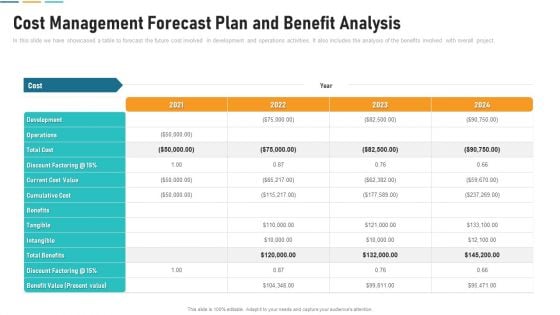
Cost Management Forecast Plan And Benefit Analysis Clipart PDF
In this slide we have showcased a table to forecast the future cost involved in development and operations activities. It also includes the analysis of the benefits involved with overall project. Pitch your topic with ease and precision using this cost management forecast plan and benefit analysis clipart pdf. This layout presents information on cost management forecast plan and benefit analysis. It is also available for immediate download and adjustment. So, changes can be made in the color, design, graphics or any other component to create a unique layout.
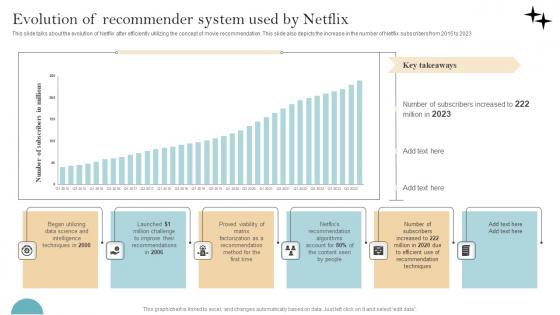
Recommender System Implementation Evolution Of Recommender System Used Information Pdf
This slide talks about the evolution of Netflix after efficiently utilizing the concept of movie recommendation. This slide also depicts the increase in the number of Netflix subscribers from 2015 to 2023. Are you searching for a Recommender System Implementation Evolution Of Recommender System Used Information Pdf that is uncluttered, straightforward, and original It is easy to edit, and you can change the colors to suit your personal or business branding. For a presentation that expresses how much effort you have put in, this template is ideal With all of its features, including tables, diagrams, statistics, and lists, it is perfect for a business plan presentation. Make your ideas more appealing with these professional slides. Download Recommender System Implementation Evolution Of Recommender System Used Information Pdf from Slidegeeks today. This slide talks about the evolution of Netflix after efficiently utilizing the concept of movie recommendation. This slide also depicts the increase in the number of Netflix subscribers from 2015 to 2023.
Scholastic Alliance Statistic Management Diagram Powerpoint Slide Designs
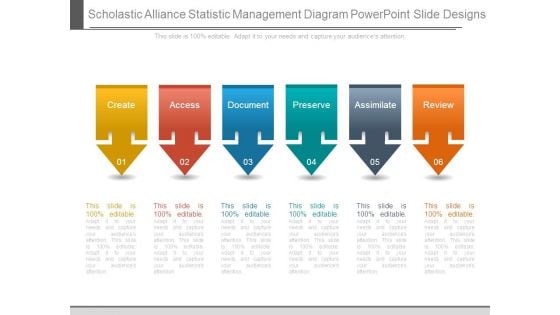
This is a scholastic alliance statistic management diagram powerpoint slide designs. This is a six stage process. The stages in this process are create, access, document, preserve, assimilate, review.
External Analysis Labour Market Forecasts Ppt PowerPoint Presentation Ideas Examples
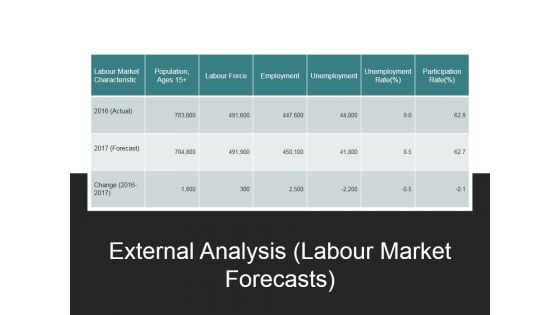
This is a external analysis labour market forecasts ppt powerpoint presentation ideas examples. This is a six stage process. The stages in this process are population, ages, labour market characteristic, labour force, employment, unemployment.
External Analysis Labour Market Forecasts Ppt PowerPoint Presentation Infographics Outfit
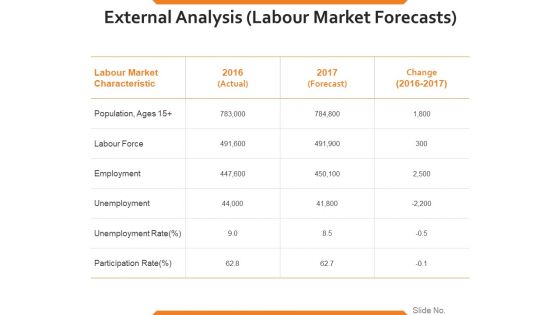
This is a external analysis labour market forecasts ppt powerpoint presentation infographics outfit. This is a three stage process. The stages in this process are labour force, employment, unemployment, unemployment rate, participation rate.
Demand Analysis Forecasting Managerial Economics Ppt PowerPoint Presentation Slides Deck
Presenting this set of slides with name demand analysis forecasting managerial economics ppt powerpoint presentation slides deck. This is an editable Powerpoint five stages graphic that deals with topics like demand analysis forecasting managerial economics to help convey your message better graphically. This product is a premium product available for immediate download and is 100 percent editable in Powerpoint. Download this now and use it in your presentations to impress your audience.
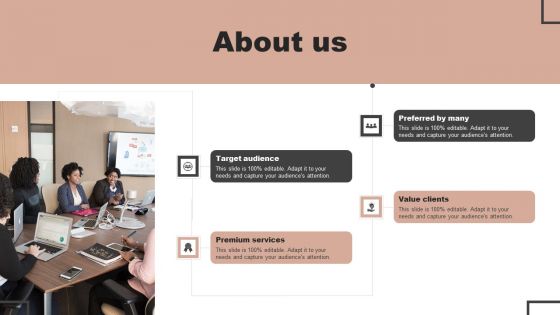
Forecast Analysis Technique IT About Us Summary PDF
Create an editable Forecast Analysis Technique IT About Us Summary PDF that communicates your idea and engages your audience. Whether you are presenting a business or an educational presentation, pre designed presentation templates help save time. Forecast Analysis Technique IT About Us Summary PDF is highly customizable and very easy to edit, covering many different styles from creative to business presentations. Slidegeeks has creative team members who have crafted amazing templates. So, go and get them without any delay.
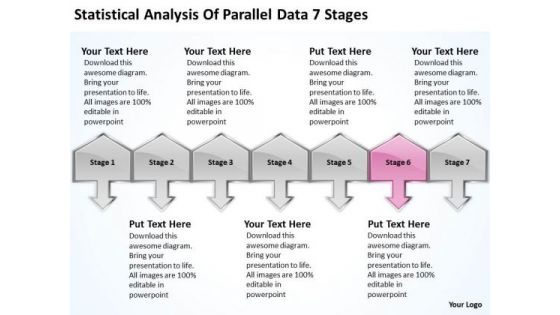
Statistical Analysis Of Parallel Data 7 Stages Business Planning Guide PowerPoint Slides
We present our statistical analysis of parallel data 7 stages business planning guide PowerPoint Slides.Download our Communication PowerPoint Templates because the mind is always whirring with new ideas. Use our Business PowerPoint Templates because watch the excitement levels rise as they realise their worth. Download our Arrows PowerPoint Templates because you know Coincidentally it will always point to the top. Use our Success PowerPoint Templates because they represent the proress in our lives. Use our Symbol PowerPoint Templates because with the help of our Slides you can Illustrate how each element flows seamlessly onto the next stage.Use these PowerPoint slides for presentations relating to 3d, Achievement, Action, Aim, Arrows, Black, Business, Color, Communication, Competition, Concept, Connection, Creative, Design, Different, Direction, Element, First, Forward, Graph, Graphic, Group, Growth, Higher, Icon, Illustration, Image, Isolated, Leader, Leadership, Line, Menu, Motion, Orange, Progress, Series, Seven, Sign, Slew, Solution, Success, Swerve, Symbol, Team, Teamwork, Turn, Up. The prominent colors used in the PowerPoint template are Pink, Gray, Black. Customers tell us our statistical analysis of parallel data 7 stages business planning guide PowerPoint Slides are Graceful. Use our Black PowerPoint templates and PPT Slides are Attractive. PowerPoint presentation experts tell us our statistical analysis of parallel data 7 stages business planning guide PowerPoint Slides are Nice. People tell us our Business PowerPoint templates and PPT Slides are Glamorous. We assure you our statistical analysis of parallel data 7 stages business planning guide PowerPoint Slides are Flirty. People tell us our Color PowerPoint templates and PPT Slides are Great. Scale mountains with our Statistical Analysis Of Parallel Data 7 Stages Business Planning Guide PowerPoint Slides. You will come out on top.
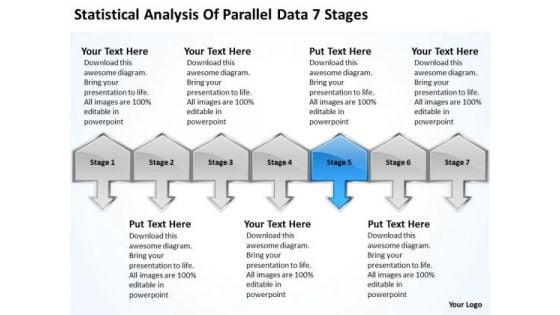
Statistical Analysis Of Parallel Data 7 Stages Fashion Business Plan PowerPoint Slides
We present our statistical analysis of parallel data 7 stages fashion business plan PowerPoint Slides.Download our Communication PowerPoint Templates because there is a key aspect to be emphasised. Present our Business PowerPoint Templates because watch the excitement levels rise as they realise their worth. Download our Arrows PowerPoint Templates because our PowerPoint templates designed for your ideas to sell. Download our Success PowerPoint Templates because your quest has taken you well onto the path of success. Download our Symbol PowerPoint Templates because they will Amplify your basic corporate concept and forefront the benefits of overlapping processes to arrive at common goals.Use these PowerPoint slides for presentations relating to 3d, Achievement, Action, Aim, Arrows, Black, Business, Color, Communication, Competition, Concept, Connection, Creative, Design, Different, Direction, Element, First, Forward, Graph, Graphic, Group, Growth, Higher, Icon, Illustration, Image, Isolated, Leader, Leadership, Line, Menu, Motion, Orange, Progress, Series, Seven, Sign, Slew, Solution, Success, Swerve, Symbol, Team, Teamwork, Turn, Up. The prominent colors used in the PowerPoint template are Blue, Gray, Black. Customers tell us our statistical analysis of parallel data 7 stages fashion business plan PowerPoint Slides are Awesome. Use our Business PowerPoint templates and PPT Slides will get their audience's attention. PowerPoint presentation experts tell us our statistical analysis of parallel data 7 stages fashion business plan PowerPoint Slides are Awesome. People tell us our Aim PowerPoint templates and PPT Slides are Sparkling. We assure you our statistical analysis of parallel data 7 stages fashion business plan PowerPoint Slides are Royal. People tell us our Black PowerPoint templates and PPT Slides are Detailed. Make your mark with our Statistical Analysis Of Parallel Data 7 Stages Fashion Business Plan PowerPoint Slides. You will be at the top of your game.
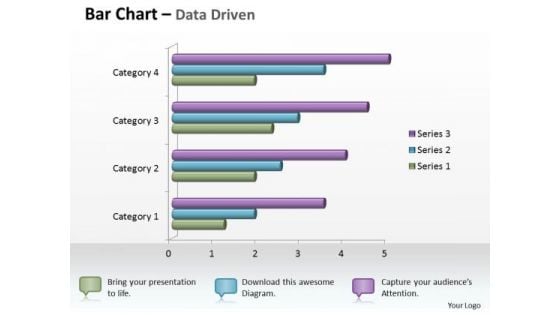
Data Analysis In Excel 3d Bar Chart For Business Statistics PowerPoint Templates
Knock On The Door To Success With Our data analysis in excel 3d bar chart for business statistics Powerpoint Templates . Be Assured Of Gaining Entry.
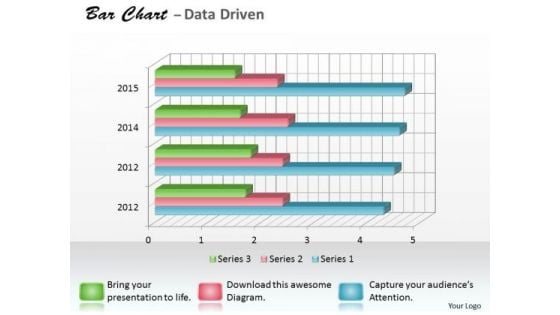
Data Analysis Programs 3d Bar Chart For Research In Statistics PowerPoint Templates
Draw It Out On Our data analysis programs 3d bar chart for research in statistics Powerpoint Templates . Provide Inspiration To Your Colleagues.
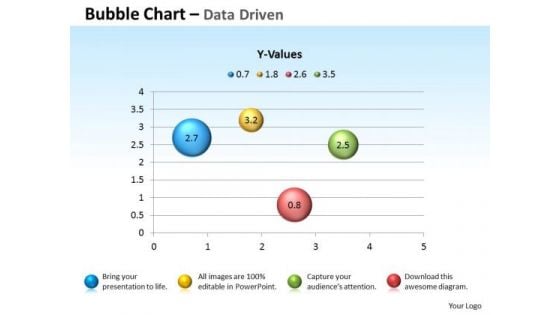
Excel Data Analysis Data Tools Data Methods Statistical Chart For Process PowerPoint Templates
Blend Your Views With Our excel data analysis data tools data methods statistical chart for process Powerpoint Templates . They Are Made For Each Other.
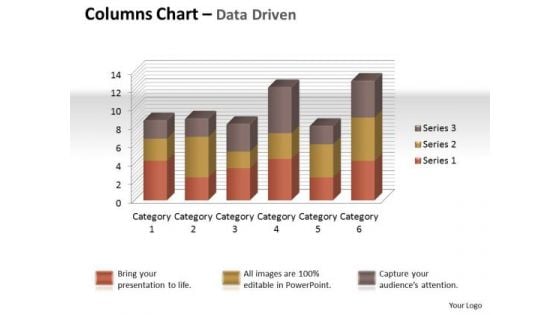
Excel Data Analysis Data Tools Data Methods Statistical Tool Chart PowerPoint Templates
Give Your Thoughts Some Durability. Coat Them With Our excel data analysis data tools data methods statistical tool chart Powerpoint Templates .
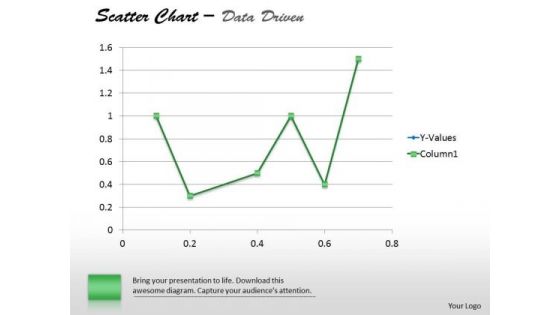
Financial Data Analysis Driven Demonstrate Statistics With Scatter Chart PowerPoint Slides Templates
Establish The Dominance Of Your Ideas. Our financial data analysis driven demonstrate statistics with scatter chart powerpoint slides Templates Will Put Them On Top.
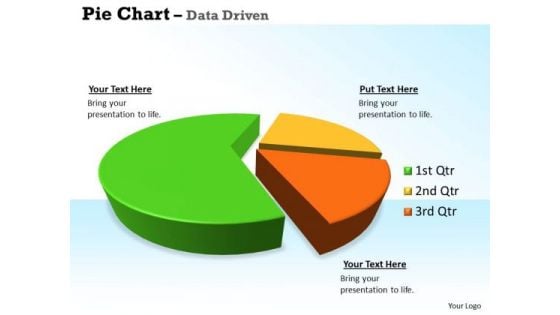
Quantitative Data Analysis 3d Pie Chart For Business Statistics PowerPoint Templates
Our quantitative data analysis 3d pie chart for business statistics Powerpoint Templates Allow You To Do It With Ease. Just Like Picking The Low Hanging Fruit.

Puzzles Forming Word Community Solution PowerPoint Templates Ppt Backgrounds For Slides 0113
We present our Puzzles Forming Word Community Solution PowerPoint Templates PPT Backgrounds For Slides 0113.Use our Business PowerPoint Templates because You can Be the star of the show with our PowerPoint Templates and Slides. Rock the stage with your ideas. Download and present our Puzzles or Jigsaws PowerPoint Templates because You aspire to touch the sky with glory. Let our PowerPoint Templates and Slides provide the fuel for your ascent. Use our Marketing PowerPoint Templates because It can Conjure up grand ideas with our magical PowerPoint Templates and Slides. Leave everyone awestruck by the end of your presentation. Use our Shapes PowerPoint Templates because Our PowerPoint Templates and Slides will definately Enhance the stature of your presentation. Adorn the beauty of your thoughts with their colourful backgrounds. Download our Success PowerPoint Templates because You can Stir your ideas in the cauldron of our PowerPoint Templates and Slides. Cast a magic spell on your audience.Use these PowerPoint slides for presentations relating to Find the right words to convey your ideas. Get it exact with our Puzzles Forming Word Community Solution PowerPoint Templates Ppt Backgrounds For Slides 0113.
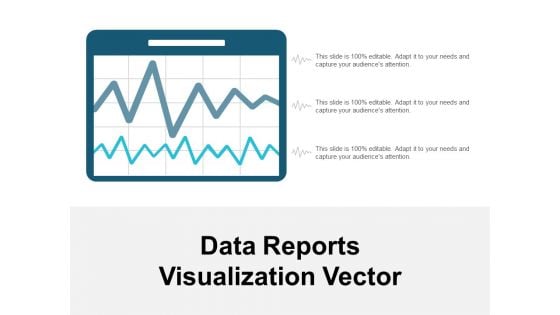
Data Reports Visualization Vector Ppt PowerPoint Presentation Visual Aids Deck
Presenting this set of slides with name data reports visualization vector ppt powerpoint presentation visual aids deck. The topics discussed in these slides are data visualization icon, research analysis, business focus. This is a completely editable PowerPoint presentation and is available for immediate download. Download now and impress your audience.
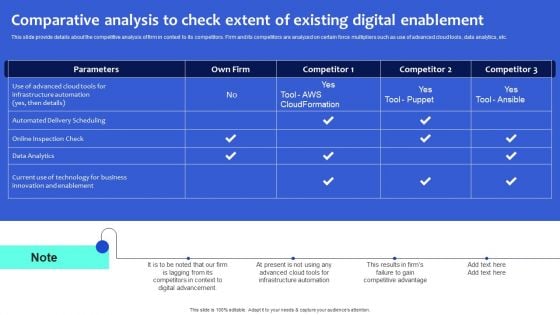
Digital Transformation Checklist To Accelerate Innovation In Business Comparative Analysis To Check Extent Summary PDF
This slide provide details about the competitive analysis of firm in context to its competitors. Firm and its competitors are analyzed on certain force multipliers such as use of advanced cloud tools, data analytics, etc. Make sure to capture your audiences attention in your business displays with our gratis customizable Digital Transformation Checklist To Accelerate Innovation In Business Comparative Analysis To Check Extent Summary PDF. These are great for business strategies, office conferences, capital raising or task suggestions. If you desire to acquire more customers for your tech business and ensure they stay satisfied, create your own sales presentation with these plain slides.
Elementary Statistics Ppt PowerPoint Presentation Portfolio Diagrams Cpb Pdf
Presenting this set of slides with name elementary statistics ppt powerpoint presentation portfolio diagrams cpb pdf. This is an editable Powerpoint four stages graphic that deals with topics like elementary statistics to help convey your message better graphically. This product is a premium product available for immediate download and is 100 percent editable in Powerpoint. Download this now and use it in your presentations to impress your audience.
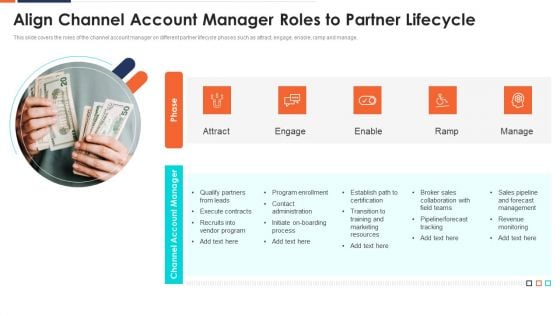
Form And Sustain A Business Partnership Align Channel Account Ppt File Images PDF
This slide covers the roles of the channel account manager on different partner lifecycle phases such as attract, engage, enable, ramp and manage. This is a form and sustain a business partnership align channel account ppt file images pdf template with various stages. Focus and dispense information on five stages using this creative set, that comes with editable features. It contains large content boxes to add your information on topics like execute contracts, recruits, resources, teams, revenue. You can also showcase facts, figures, and other relevant content using this PPT layout. Grab it now.
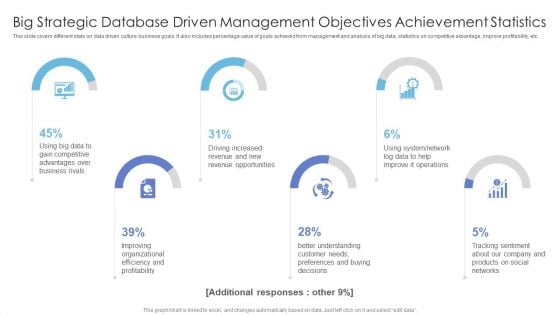
Big Strategic Database Driven Management Objectives Achievement Statistics Professional PDF
This slide covers different stats on data driven culture business goals. It also includes percentage value of goals achieved from management and analysis of big data, statistics on competitive advantage, improve profitability, etc.Showcasing this set of slides titled Big Strategic Database Driven Management Objectives Achievement Statistics Professional PDF. The topics addressed in these templates are Gain Competitive, Driving Increased, Revenue Opportunities. All the content presented in this PPT design is completely editable. Download it and make adjustments in color, background, font etc. as per your unique business setting.
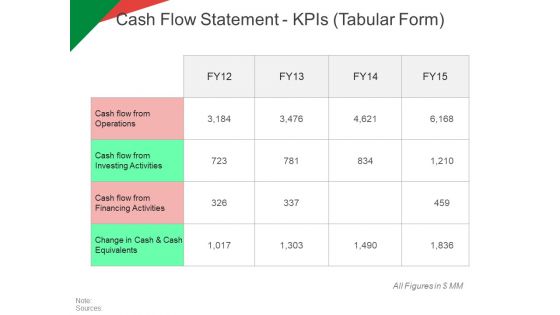
Cash Flow Statement Kpis Tabular Form Ppt PowerPoint Presentation Model Graphic Tips
This is a cash flow statement kpis tabular form ppt powerpoint presentation model graphic tips. This is a four stage process. The stages in this process are operations, investing activities, net increase in cash, financing activities.
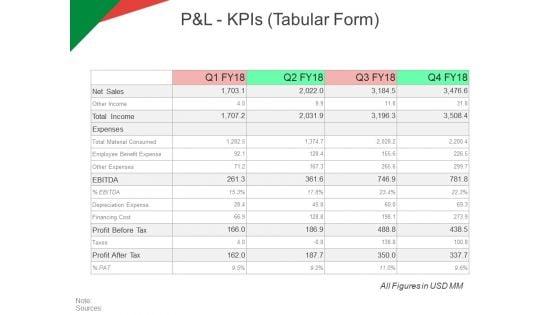
P And L Kpis Tabular Form Ppt PowerPoint Presentation Model Ideas
This is a p and l kpis tabular form ppt powerpoint presentation model ideas. This is a four stage process. The stages in this process are revenue, operating profit, cogs, net profit.
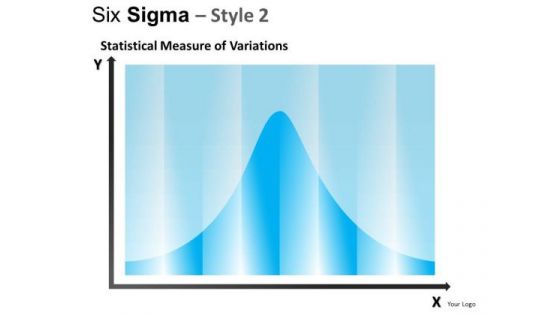
Bell Curve Statistics PowerPoint Slides And Ppt Diagram Templates
Bell Curve Statistics PowerPoint Slides And PPT Diagram Templates-These high quality powerpoint pre-designed slides and powerpoint templates have been carefully created by our professional team to help you impress your audience. All slides have been created and are 100% editable in powerpoint. Each and every property of any graphic - color, size, orientation, shading, outline etc. can be modified to help you build an effective powerpoint presentation. Any text can be entered at any point in the powerpoint template or slide. Simply DOWNLOAD, TYPE and PRESENT! Thoughts won't dry up with our Bell Curve Statistics PowerPoint Slides And Ppt Diagram Templates. They keep your brain going at it all the time.
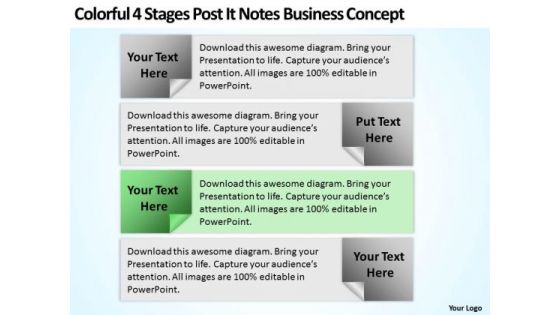
Business Organizational Chart Template PowerPoint Templates Backgrounds For Slide
We present our business organizational chart template PowerPoint templates backgrounds for slide.Use our Advertising PowerPoint Templates because They will Put your wonderful verbal artistry on display. Our PowerPoint Templates and Slides will provide you the necessary glam and glitter. Download our Success PowerPoint Templates because Our PowerPoint Templates and Slides help you meet the demand of the Market. Just browse and pick the slides that appeal to your intuitive senses. Download and present our Shapes PowerPoint Templates because Our PowerPoint Templates and Slides will let you Hit the right notes. Watch your audience start singing to your tune. Download our Boxes PowerPoint Templates because Our PowerPoint Templates and Slides offer you the widest possible range of options. Download our Business PowerPoint Templates because You have gained great respect for your brilliant ideas. Use our PowerPoint Templates and Slides to strengthen and enhance your reputation.Use these PowerPoint slides for presentations relating to Posting, note, vector, yellow, pad, urgent, art, checklist, list, important, advertisement, isolated, page, square, to do, adhesive, white, business, blank, sign, symbol, letter, reminder, graphic, supply, element, memory, shape, label, illustration, icon, object, shiny, attached, remind, design, color, sticky, empty, paper, notify, thumbtack, banner, board, message, single, office, announcement, messageboard, communication. The prominent colors used in the PowerPoint template are Green, Black, Gray. Start driving productivity gains with our Business Organizational Chart Template PowerPoint Templates Backgrounds For Slide. They will make you look good.
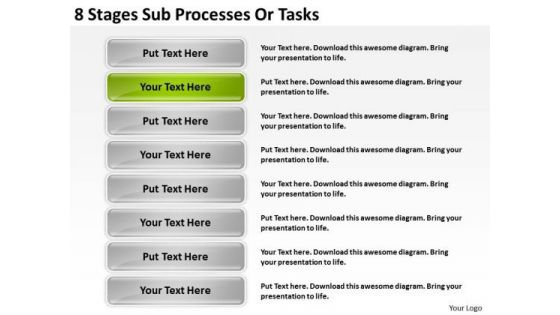
Sub Processes Or Tasks Creating Business Plan For Small PowerPoint Slides
We present our sub processes or tasks creating business plan for small PowerPoint Slides.Download our Communication PowerPoint Templates because It can Conjure up grand ideas with our magical PowerPoint Templates and Slides. Leave everyone awestruck by the end of your presentation. Download and present our Advertising PowerPoint Templates because You can Be the star of the show with our PowerPoint Templates and Slides. Rock the stage with your ideas. Download and present our Org Charts PowerPoint Templates because Our PowerPoint Templates and Slides are created with admirable insight. Use them and give your group a sense of your logical mind. Download our Process and Flows PowerPoint Templates because Our PowerPoint Templates and Slides will let you meet your Deadlines. Present our Business PowerPoint Templates because It can Conjure up grand ideas with our magical PowerPoint Templates and Slides. Leave everyone awestruck by the end of your presentation.Use these PowerPoint slides for presentations relating to Task, checklist, clipboard, checkmark, isolated, page, file, document, rate, pad, strip, business, render, list, line, ranking, reminder, service, supply, report, tick, result, object, paperwork, research, planning, notice, check, stationary, paper, fiberboard, organization, organize, approval, accept, memo, board, note, message, office, notepad, customer, 3d. The prominent colors used in the PowerPoint template are Green, Gray, White. Our Sub Processes Or Tasks Creating Business Plan For Small PowerPoint Slides will give you the right feeling. You will be sure you have made the right choice.
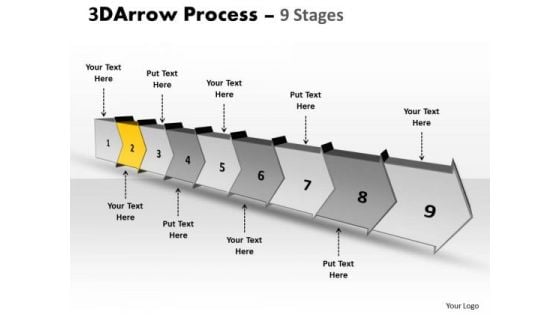
Ppt Background Continous Establishment PowerPoint Theme Flow Process Diagram 3 Graphic
We present our PPT Background continuous establishment PowerPoint theme flow Process diagram 3 Graphic. Use our Arrows PowerPoint Templates because; Show them how you can save the day. Use our Shapes PowerPoint Templates because, you understand the ailment and how to fight it. Use our Finance PowerPoint Templates because, Original thinking is the need of the hour. Use our Business PowerPoint Templates because, Marketing Strategy Business Template: - Maximizing sales of your product is the intended destination. Use our Process and Flows PowerPoint Templates because, you understand the ailment and how to fight it. Use these PowerPoint slides for presentations relating to 3d, arrow, background, bullet, business, chart, checkmark, chevron, diagram, drop, eps10, financial, glass, graphic, gray, icon, illustration, perspective, point, process, reflection, set, shadow, silver, text, transparency, vector,. The prominent colors used in the PowerPoint template are Yellow, Gray, and Black Cross continents with our Ppt Background Continous Establishment PowerPoint Theme Flow Process Diagram 3 Graphic. Your thoughts will cover the earth.
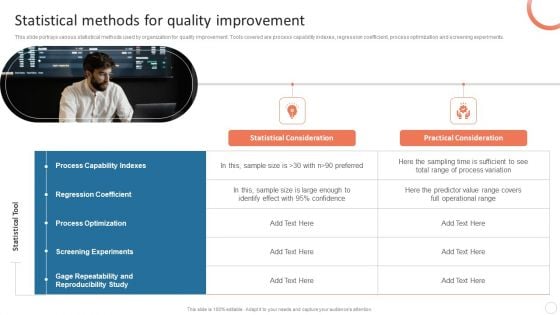
Quality Control Plan Statistical Methods For Quality Improvement Diagrams PDF
This slide portrays various statistical methods used by organization for quality improvement. Tools covered are process capability indexes, regression coefficient, process optimization and screening experiments. The Quality Control Plan Statistical Methods For Quality Improvement Diagrams PDF is a compilation of the most recent design trends as a series of slides. It is suitable for any subject or industry presentation, containing attractive visuals and photo spots for businesses to clearly express their messages. This template contains a variety of slides for the user to input data, such as structures to contrast two elements, bullet points, and slides for written information. Slidegeeks is prepared to create an impression.
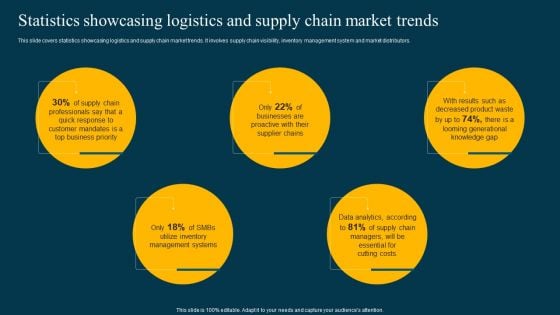
Statistics Showcasing Logistics And Supply Chain Market Trends Diagrams PDF
This slide covers statistics showcasing logistics and supply chain market trends. It involves supply chain visibility, inventory management system and market distributors.This Statistics Showcasing Logistics And Supply Chain Market Trends Diagrams PDF from Slidegeeks makes it easy to present information on your topic with precision. It provides customization options, so you can make changes to the colors, design, graphics, or any other component to create a unique layout. It is also available for immediate download, so you can begin using it right away. Slidegeeks has done good research to ensure that you have everything you need to make your presentation stand out. Make a name out there for a brilliant performance.
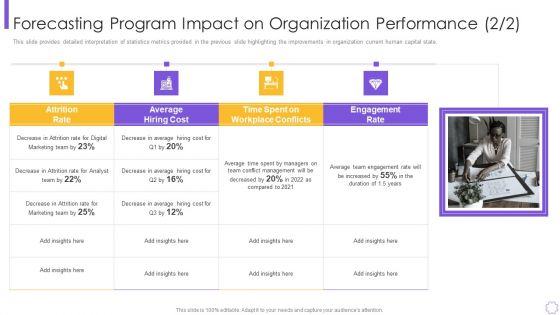
Forecasting Program Impact On Organization Performance Rules Clipart PDF
This slide provides detailed interpretation of statistics metrics provided in the previous slide highlighting the improvements in organization current human capital state.Presenting forecasting program impact on organization performance rules clipart pdf to provide visual cues and insights. Share and navigate important information on one stage that need your due attention. This template can be used to pitch topics like average hiring cost, decrease in attrition, conflict management In addtion, this PPT design contains high resolution images, graphics, etc, that are easily editable and available for immediate download.

Forecasting Program Impact On Organization Performance Guidelines PDF
This slide provides detailed interpretation of statistics metrics provided in the previous slide highlighting the improvements in organization current human capital state.This is a forecasting program impact on organization performance guidelines pdf template with various stages. Focus and dispense information on one stage using this creative set, that comes with editable features. It contains large content boxes to add your information on topics like average hiring cost, engagement rate, average time spent You can also showcase facts, figures, and other relevant content using this PPT layout. Grab it now.
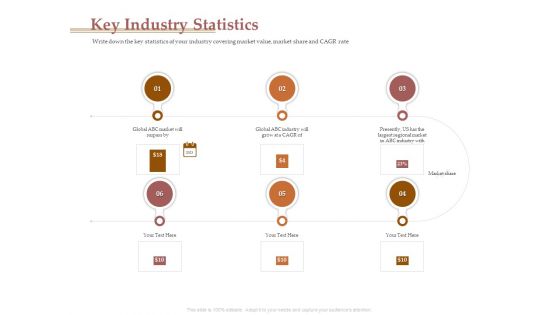
Market Assessment Key Industry Statistics Ppt Show Diagrams PDF
Presenting this set of slides with name market assessment key industry statistics ppt show diagrams pdf. This is a six stage process. The stages in this process are global, market, industry, regional. This is a completely editable PowerPoint presentation and is available for immediate download. Download now and impress your audience.
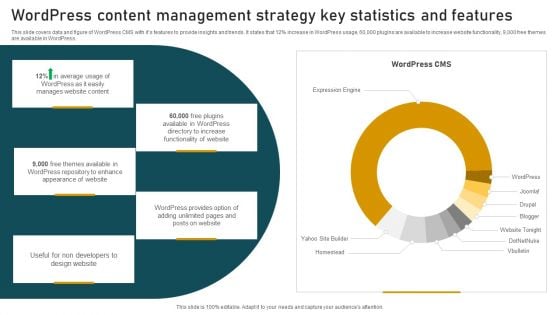
Wordpress Content Management Strategy Key Statistics And Features Summary PDF
This slide covers data and figure of WordPress CMS with its features to provide insights and trends. It states that 12 percent increase in WordPress usage, 60,000 plugins are available to increase website functionality, 9,000 free themes are available in WordPress. Showcasing this set of slides titled Wordpress Content Management Strategy Key Statistics And Features Summary PDF. The topics addressed in these templates are Wordpress Content, Management Strategy, Statistics And Features. All the content presented in this PPT design is completely editable. Download it and make adjustments in color, background, font etc. as per your unique business setting.
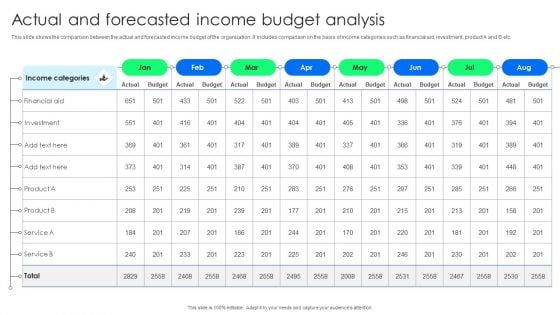
Actual And Forecasted Income Budget Analysis Elements PDF
This slide shows the comparison between the actual and forecasted income budget of the organization. It includes comparison on the basis of income categories such as financial aid, investment, product A and B etc. Pitch your topic with ease and precision using this Actual And Forecasted Income Budget Analysis Elements PDF. This layout presents information on Investment, Financial Aid. It is also available for immediate download and adjustment. So, changes can be made in the color, design, graphics or any other component to create a unique layout.

 Home
Home